Abstract
Background and aim of the study
Rupture/dissection of ascending thoracic aortic aneurysm (aTAA) is a cardiovascular emergency. Elective surgical repair is primarily based on maximum diameter, but complications have occurred under the size limits for surgical intervention. aTAA wall stress may be a better predictor of patient-specific rupture risk, but cannot be directly measured in vivo. The study aim was to develop an aTAA computational model associated with tricuspid aortic valve (TAV) to determine patient-specific wall stresses.
Methods
A TAV-associated aTAA was excised intact during surgery. Zero-pressure geometry was generated from microcomputed tomography, and an opening angle was used to calculate residual stress. Material properties determined from stress-strain data were incorporated into an Ogden hyperelastic model. Wall stress distribution and magnitudes at systemic pressure were determined using finite element analyses (FEA) in LS-DYNA.
Results
Regional material property differences were noted: the left aTAA region had a higher stiffness compared to the right, and anterior/posterior walls. During systole, the mean principal wall stresses were 172.0 kPa (circumferential) and 71.9 kPa (longitudinal), while peak wall stresses were 545.1 kPa (circumferential) and 430.1 kPa (longitudinal). Elevated wall stress pockets were seen in anatomic left and right aTAA regions.
Conclusion
A validated computational approach was demonstrated to determine aTAA wall stresses in a patient-specific fashion, taking into account the required zero-stress geometry, wall thickness, material properties and residual stress. Regions of maximal wall stress may indicate the sites most prone to rupture. The creation of a patient-specific aTAA model based on a surgical specimen is necessary to serve as the ‘gold standard’ for comparing models based on in-vivo data alone. Validated data using the surgical specimen are essential for establishing wall stress and rupture-risk relationships.
The dissection and/or rupture of an ascending thoracic aortic aneurysms (aTAA) is a catastrophic and often lethal cardiovascular emergency. An elective surgical replacement of the ascending aorta, based on size criteria, rate of growth and symptoms, remains the clinical paradigm to prevent adverse aTAA events (1). Both, the present authors and others have shown that a significant proportion of dissections occur with aortic dimensions under the recommended size for surgical intervention (2,3). A mean aortic diameter after acute type A dissection of just under 5.0 cm suggests that a significant number of patients develop dissection with diameters <5.0 cm (3). Current diameter-based guidelines do not adequately capture the predisposing risk factors for dissection/rupture. The ‘Holy Grail’ for managing aTAA patients would be to establish criteria to determine patient-specific risks of dissection/rupture. Surgical risks would only be incurred for those patients with small aTAAs at risk of dissection/rupture.
Biomechanically, dissection/rupture occurs when wall stress exceeds wall strength, but unfortunately neither wall stress nor wall strength is directly measurable in vivo. A finite element analysis (FEA) in physiologic and biomechanical studies is a valuable method for obtaining critical data about complicated real-world systems that otherwise would be extraordinarily difficult or impossible to obtain (i.e., in vivo wall stress). Wall stress can be determined via the FEA of realistic three-dimensional (3D) computational models of patient-specific aTAAs, while wall strength is determined by failure testing. Generalized wall strength has been examined by failure testing of aTAA surgical specimens for a better understanding of its contribution to dissection (4,5). Accurate patient-specific finite element (FE) models require precise 3D geometry in the zero-stress state, regional material properties, wall thickness, and residual stress. Although, previously, stress-strain relationships have been studied to determine aTAA mechanical properties (4,6,7), current in vivo aTAA FE models (8-12) are fraught with assumptions that limit the accuracy and validity of the results obtained (13,14). One such common assumption is to use in-vivo geometry at systemic pressure from computed tomography (CT) or magnetic resonance imaging (MRI) as the reference zero-stress geometry. In vitro specimens at zero-pressure are best for obtaining zero-stress geometry and patient-specific material properties. To date, no computational aTAA models have taken the required factors into account for accurate determination of wall stress.
Given the limitations of diameter as a predictor of adverse events, aTAA wall stress may serve as a more reliable predictor of dissection/rupture risk; however, true aTAA wall stress is unknown. A method of accurate FE model generation must first be established with measures to ensure that the model is based on patient-specific material properties and appropriate zero-stress geometry.
The aim of the present study was to develop the first patient-specific FE model of tricuspid aortic valve (TAV)-associated aTAA to accurately quantify aortic wall stress at systemic pressure.
Materials and methods
aTAA mesh generation
An aTAA surgical specimen from a 57-year-old man was excised as an intact cylinder from the sinotubular junction to just proximal to the innominate artery during repair. Care was noted to identify the proximal and distal ends, as well as the anterior, posterior, right, and left regions.
The fresh aTAA sample was examined using microcomputed tomography (microCT-40; Scanco Medical AG, Baseldorf, Switzerland) to capture the surface contours and wall thickness. Imaging the surgical specimen ex vivo, in the absence of hemodynamic loading, ensured that a zero-pressure geometry was obtained, a step which is vital to the development of an accurate computational model. High-resolution DICOM (Digital Imaging and Communications in Medicine) radiologic images (voxel size 76 × 76 × 76 μm) were imported into ITK-SNAP (www.itksnap.org), an open-source automatic image segmentation software (15). The images were then filtered using an intensity threshold to isolate the aTAA geometry from the background. An aTAA surface mesh was formed with Rapidform XOR (INUS Technology, Inc., Sunnyvale, CA, USA). The space between the inner lumen and the outer wall was filled with approximately 100,000 hexahedral elements (TrueGrid; XYZ Scientific, Inc., Livermore, CA, USA) to create a volume mesh of accurate size and thickness.
Informed consent was obtained to use this tissue for research purposes. The acquisition of human tissue was approved by the Committee on Human Research at the University of California at San Francisco Medical Center and the Institutional Review Board at San Francisco Veterans Administration Medical Center.
Finite element analysis
After microCT, the aTAA specimen underwent biaxial stretch testing as described previously (6,16) to obtain stress-strain data for the material properties. The TAV-associated aTAA was assigned material properties obtained from four anatomic regions: anterior; posterior; right; and left. Ogden hyperelastic material, which had been used previously to describe non-linear stress-strain relationships of various arterial tissues, was chosen to model aTAA biomechanical properties (17). The Ogden hyperelastic non-linear constitutive equation is described as follows:
| (Eq. 1) |
where N, μp and αp are material constants, and λj are the principal stretches.
LS-DYNA (LSTC, Inc., Livermore, CA, USA), a commercially available explicit FE solver, was employed for pressure loading simulations and data analysis. Raw stress-strain data from aTAA was input into LS-DYNA for regression to the Ogden model.
Residual stress
Prior to the division of the aTAA specimen for biaxial tensile testing, a thin cross-sectional ring of tissue was obtained and cut longitudinally to determine experimentally the opening angle. The specimen was photographed and the opening angle measured as ~115°. The aTAA residual stress was calculated based on the opening angle of the tissue. A radial cut FE simulation was performed to incorporate residual stress into the aTAA model. Given the opening angle obtained from the ring of tissue, a FE model of ring of the inner lumen was created and assigned composite average material properties, as determined by bi-axial stretch testing. One element was removed from the simulated inner lumen ring, to re-create the ‘radial cut’, and was pressurized until its opening angle correlated to the angle obtained experimentally. A reference geometry was then created, comprising an entire aTAA model of the innermost luminal layer, and pressurized to the same pressure needed to re-create the opening angle in the radial cut simulation. LS-DYNA permitted use of the inflated inner layer to serve as a reference configuration for stress calculation of the inner lumen during FEA of the entire aTAA model, thus incorporating residual stress in the model.
Pressure-loading simulations
Simulation was performed by applying pressure loading conditions that were representative of human physiological waveforms of arterial systemic pressure applied uniformly to the aTAA inner lumen. In order to characterize the changes in aTAA size and wall stress, simulations were run at systemic pressures with the cardiac cycle ranging from 80 to 120 mmHg. The mesh geometry was taken from an unpressurized aTAA, but wall stresses and dilatation were relevant between systolic and diastolic pressures. Thus, the initial pressurization during simulation featured a ramp-up from 0 mmHg to maximum systolic pressure (120 mmHg) over 100 ms duration, followed by decrease in pressure to the minimum diastolic pressure (80 mmHg) over another 100 ms period. The application of pressure in this fashion eliminated any unrealistic inertial forces and improved numerical stability during simulation (18). After an initial ramp-up to systolic pressure and decrease to diastolic pressure, two cardiac cycles each of 800 ms duration were applied. Each cardiac cycle was composed of a 300 ms ramp upwards to maximum systolic pressure, followed by a 500 ms ramp downwards to minimum diastolic pressure. Systole comprised 38% of the cardiac cycle. Sliding plane boundary conditions were employed at the proximal and distal lumens of the aTAA. All remaining elements were unconstrained.
Post-processing and data analysis
Simulation results were examined at times corresponding to peak systolic and minimum diastolic pressures, in order to measure wall stress and changes in aTAA diameter. First and second principal stresses corresponding to circumferential and longitudinal stress were calculated using LS-DYNA post-processing software. To measure the changes in aTAA diameter, four sets of nodes spanning the maximum diameter of the aneurysm were chosen. The distances between each set of nodes were tracked during the cardiac cycle, and the distances at systole and diastole recorded. The maximum model diameter at systole was compared to that obtained by in vivo electrocardiogram (ECG)-gated CT imaging to validate the simulation.
Results
An in vivo CT image (coronal slice) of the patient’s aTAA and its 3D reconstruction are shown in Figure 1. Surgical excision of the aTAA (Fig. 2) showed significant shrinkage in both circumferential and longitudinal directions at zero-pressure, demonstrating the erroneous nature of utilizing in vivo pressurized geometry as a baseline from which to reload pressure during simulations.
Figure 1.
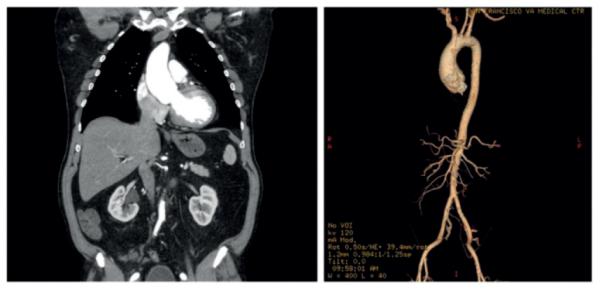
Left: Coronal slice from ECG-gated computed tomogram of the aTAA. Right: Three-dimensional reconstruction of the aTAA.
Figure 2.
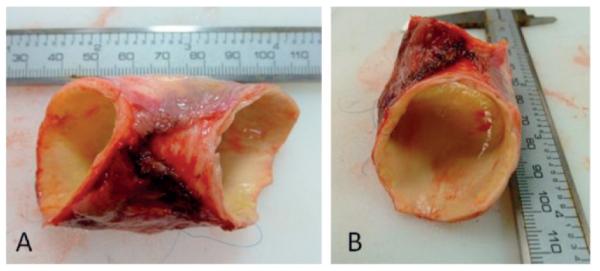
The surgically excised aTAA. A) Lateral view. B) En-face view.
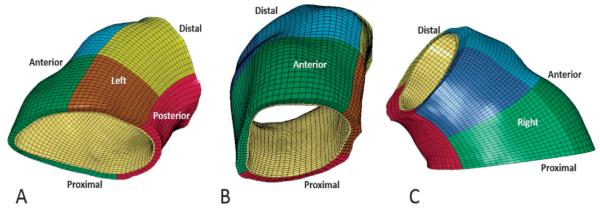
Using microCT, segmentation was performed; the corresponding mesh generated is shown in Figure 3, and the aTAA opening angle in Figure 4.
Figure 3.
The aTAA mesh. A) Left inferior view; the red region is posterior, brown and yellow regions are proximal and distal left, respectively. B) Anterior view; the green and blue regions are proximal and distal anterior, respectively. C) Right lateral view; the light green and dark blue regions are proximal and distal right, respectively.
Figure 4.
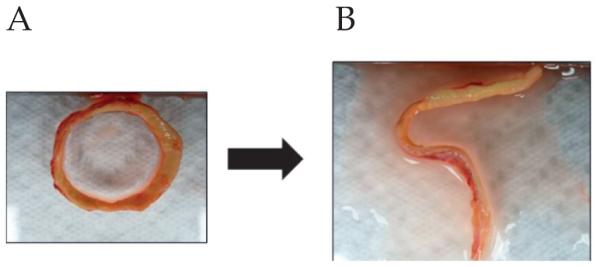
The opening angle. A) Prior to the radial cut. B) After cutting.
The aTAA specimen was divided into seven regions; stress-strain curves in the circumferential and longitudinal directions are shown in Figure 5. aTAA tissue stiffness was obtained at 74 kPa, corresponding to the mean ascending aortic physiologic stress level under systemic pressure. The ascending aortic stress level was calculated based on the Laplace equation, considering a mean systemic pressure of 100 mmHg and using the average thickness and diameter of the normal ascending aorta. aTAA stiffness at 74 kPa in the circumferential direction was highest in the left proximal and distal regions (1415.5 and 1370.05 kPa, respectively), followed by the right proximal, anterior, posterior, and right distal regions. As no significant differences between circumferential and longitudinal directions in each region were noted (Table I), the tissue was modeled as isotropic, which correlates with the data of Pham et al. (4).
Figure 5.
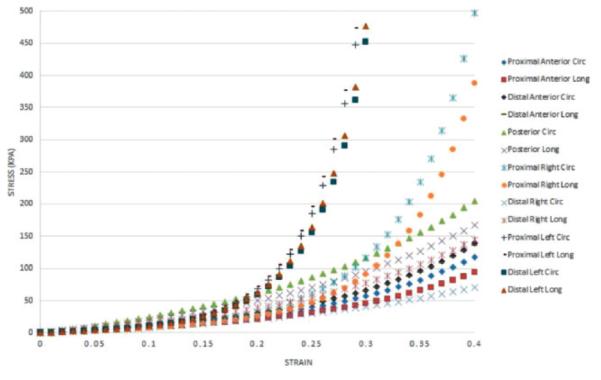
Regional aTAA circumferential and longitudinal stress-strain curves.
Table I.
aTAA regional stiffness at 74 kPa.
| Region | Circumferential stiffness |
Longitudinal stiffness |
|---|---|---|
| Anterior (distal) | 541.55 | 547.25 |
| Anterior (proximal) | 533.27 | 534.64 |
| Left (distal) | 1375.11 | 1364.99 |
| Left (proximal) | 1420.88 | 1410.20 |
| Posterior | 500.51 | 468.97 |
| Right (distal) | 385.35 | 484.85 |
| Right (proximal) | 969.07 | 979.94 |
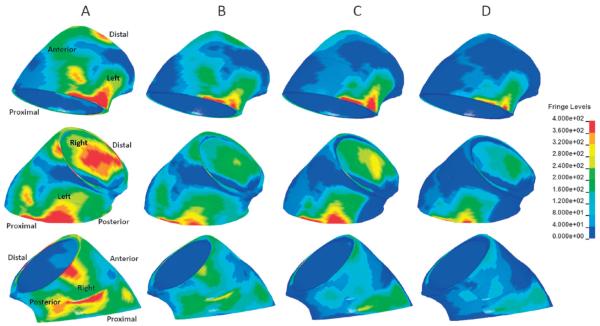
At systolic pressure (120 mmHg), the peak aTAA first principal wall stress in the circumferential direction was 545.1 kPa, with mean of 172.0 kPa (Fig. 6). The peak second principal wall stress in the longitudinal direction was 430.1 kPa, with a mean of 71.9 kPa. At diastole (80 mmHg), the peak first principal wall stress was 347.2 kPa, with a mean 107.9 kPa, while the peak second principal wall stress was 300.3 kPa with a mean of 45.6 kPa. The difference in peak first principal wall stress was 197.9 kPa throughout the cardiac cycle, while that for the peak second principal wall stress was 129.8 kPa. The difference in mean first principal wall stress from diastole to systole was 64.1 kPa, while that for the mean second principal was 26.3 kPa. The maximum diameter ranged from 48.7 to 51.3 mm, from diastole to systole. The distensibility (the change in diameter from diastole to systole) of the aTAA at systemic pressure was 5.3% proximally, and 6.0% distally. Pockets of elevated wall stress, which contained the maximal wall stresses, could be appreciated at the anatomical left and right regions (Fig. 7). The aTAA model in systole, when compared to preoperative ECG-gated CT imaging in vivo (5.2 cm maximum), exhibited a good correlation with diameter.
Figure 6.
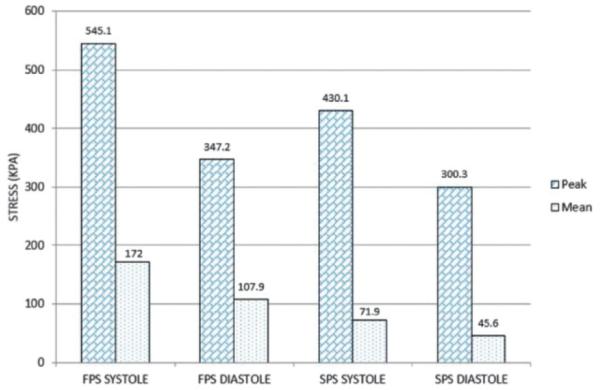
First (FPS) and second (SPS) principal wall stresses in diastole and systole at systemic pressure.
Figure 7.
The aTAA first and second principal stresses at systole and diastole (scale in kPa). The columns represent the same set of conditions with different anatomical views. A) First principal stress at systole. B) First principal stress at diastole. C) Second principal stress at systole. D) Second principal stress at diastole.
Discussion
The development of the first validated FE model of a patient-specific aTAA associated with TAV to obtain data on wall stress distribution and magnitude at systemic pressure, using an intact surgical specimen excised freshly during repair, was undertaken in the present study. The use of a fresh surgical specimen to obtain zero-stress geometry, an unloaded wall thickness, and regional material properties, as well as the incorporation of residual stress, distinguish this study from other computational models created previously (8-12).
Patient-specific regional material properties
The mechanical properties of fresh aTAAs, taking specimens from anterior and posterior regions, were described previously (6). No obvious differences in regional mechanical properties were noted between the anterior and posterior aTAA, although the right and left regions were not studied. In the present patient-specific TAV-associated aTAA, there were striking differences in stress-strain curves of the left compared to other regions. In addition, there were significant differences in stress-strain curves from proximal versus distal aTAA on the right, which suggested that localized regional material property variations had occurred in this patient. The left aTAA region had the greatest stiffness at a given stress level than the proximal right, which in turn was stiffer than the distal right and other regions. Whilst further studies of regional aTAA mechanical properties (to incorporate the right and left regions in a large sample size) will be necessary, the demonstration of such differences in this patient-specific aTAA suggests that computational models incorporating average literature-based aTAA material properties uniformly applied may not yield realistic physiological results.
aTAA distensibility and wall stress
In this patient-specific TAV-associated aTAA with elevated wall stiffness, 5-6% distensibility was seen proximally and distally, with changes in diameter of only 2.54 mm from diastole to systole at systemic pressure. Normal aortic distensibility depends on patient age, with a typical circumferential distensibility of 10 ± 3% for younger patients compared to 3 ± 1% for older patients (19). As such, the present patient’s distensibility lay between the expected range for young and old patients without aTAA. The peak aTAA first principal wall stress in systole was approximately three-fold greater than the mean wall stress. Overall, the mean aTAA first principal wall stress from diastole to systole at systemic pressure was 107.9 to 172.0 kPa, within the peak stress range seen in the normal aortic root (20,21). On the other hand, peak wall stress ranged from 347.2 to 545.0 kPa circumferentially and from 300.3 to 430.1 kPa longitudinally, from diastole to systole at systemic pressure. The wall stress distribution in the present patient showed that peak wall stress was concentrated in the left proximal region, towards the sinotubular junction, and in the right region towards the ascending aorta. In this patient, and in the absence of any surgical intervention, dissection/rupture would most likely occur in these regions.
Wall strength
Previously, Pichamuthu et al. (5) reported the aTAA to be stronger circumferentially than longitudinally in 15 TAV aTAA patients with an average age of 66 years and a mean aTAA diameter of 5.7 cm. The TAV-associated aTAA tensile strength was 961 ± 610 kPa circumferentially, and 540 ± 370 kPa longitudinally. Similarly, Duprey et al. (22) performed uniaxial testing for failure, and showed the maximum elastic modulus to be 834 kPa and 905 kPa circumferentially for greater and lesser curvatures, respectively; and 565 kPa and 297 kPa longitudinally for greater and lesser curvatures, respectively. Given the range of the peak aTAA first principal wall stresses, the present patient’s aTAA would not be predicted to rupture circumferentially. However, the peak second principal wall stresses were within the range of TAV aTAA longitudinal failure strength, based on Duprey’s data, though not quite within the failure range for Pichamuthu’s data. At higher blood pressures, the patient’s aTAA could yield longitudinally so as to create a circumferential tear that would predispose to aortic dissection. Hence, the present patient-specific FE model served to validate the need for surgical intervention in this patient and to predict a possible mechanism of failure.
Future model development
Clinically, the development of accurate patient-specific FE aTAA models in surgical patients undergoing elective repair would not affect the patients’ medical management as they have already been identified as being at high risk for rupture/dissection and require surgical intervention. However, this model and future systems based on surgical specimens will fill an important gap in the knowledge of aTAA biomechanics. An understanding of true patient-specific aTAA wall stress magnitude and distribution in comparison to aTAA failure strength is critical to developing more precise and better predictors of dissection/rupture than diameter alone. If the current clinical paradigm based on diameter is validated by showing that peak wall stresses fall within the range of aTAA failure strength (as shown in the present study), then the threshold of wall stress magnitude can be applied to smaller aneurysms which, despite their size, may reach critical wall stress values.
The other essential role for this type of model development is that these FE models composed of experimentally obtained parameters from the specimen must serve as the ‘gold standard’ by which to compare corresponding FE models derived from in-vivo data. Only when patient-specific aTAA FE models based solely on in-vivo parameters are seen to correlate favorably with their FE counterparts from actual surgical specimens will the reliable assessment of rupture risk from in-vivo data alone be possible. At such time, accurate validated patient-specific FE models may become the clinical paradigm to assess rupture risk, and the present study represents the first step in that process by using surgical specimens to incorporate zero-stress state geometry, regional material properties, and residual stress.
Model geometry obtained from in vivo aTAA imaging reflects hemodynamic loading forces, and not the zero-stress state when no pressure forces are acting upon the tissue. A pressurized geometry would require inverse FE modeling to effectively shrink aTAA geometry to an unloaded state. Wall thickness and regional material properties can be difficult to estimate in vivo, although Cine Displacement Encoding with Simulated Echos (DENSE) MRI has the potential to allow such determinations. The intact aTAA surgical specimens are subjected to intrinsic wall stress (called residual stress) which maintains the tissue in a closed-ring configuration. Subsequently, residual stress was determined by making a longitudinal cut in the aTAA ring, yielding an opening angle due to the release of circumferential residual stresses. Significantly altered wall stress calculations have been obtained in FE models where residual stress was not accounted for (23). Whilst the exact method of addressing residual stress in in-vivo-based FE models is not yet clear, the development of in-vivo-based FE models that are accurately validated by their surgical specimen models is crucial for future biomechanical risk prediction of rupture/dissection.
Computational aTAA models
The present study was focused on FEA where wall stress was calculated to determine biomechanical factors that assess dissection/rupture risk. Others have performed computational fluid dynamics (CFD) or fluid structure interaction (FSI) simulations to determine how hemodynamic factors such as flow patterns and wall shear stress may lead to aTAA development and growth. By using CFD, Viscardi et al. (12) studied aTAA wall shear stress with TAV hemodynamics, with a peak systolic jet velocity of 2.3 m/s. In this case, the study limitations included aortic surface mesh generation based on pressurized MRI imaging, aortic modeling as a rigid, non-deformable body. By using FSI, Pasta et al. (11) showed that sites of maximum wall shear stress occurred in the anterolateral ascending aorta, which suggested that this region was susceptible to aTAA development and enlargement. The limitations of these studies included the application of a uniform wall thickness and material properties, as well as the use of a pressurized CT geometry.
Study limitations
In the present study it was assumed that, within the defined anatomic regions, the aTAA was homogeneous. More pronounced regional variations may exist, but differences in tissue stiffness and material properties were successfully identified to a greater degree than by current computational models to date. The model incorporated residual stress using the inner layer as a primary contributor. Finally, simulation was performed to determine wall stress based on arterial pressurization, but did not account for FSI nor any asymmetric or turbulent flow patterns from the valve. The FEA of wall stress is paramount to understanding the mechanical factors related to dissection/rupture - wall stress based on pressure is of significantly greater magnitude than the contribution of fluid shear stress, the maximum value of which was 0.0023 kPa (11). In contrast, the evaluation of aTAA development and growth is believed to depend on eccentricities of flow, and FSI may be important for predicting growth. Unlike FEA, which requires surgical specimens for accuracy, FSI studies also require accurate flow input conditions which can be obtained in vivo, either invasively on cardiac catheterization or non-invasively by four-dimensional flow MRI. Such investigations of growth were not relevant to the current investigation.
In conclusion, to the authors’ knowledge the present study was the first to demonstrate and utilize a patient-specific TAV-associated aTAA FE model developed from an intact, freshly excised surgical specimen that incorporated zero-stress geometry, accurate wall thicknesses, residual stress, and regional material properties. The mean wall stress was within the normal peak wall stress range for ascending aorta, but the peak wall stress was significantly less than reported circumferential aTAA strength, though within the limits of longitudinal aTAA strength. Peak wall stress in the present patient occurred in the left anatomic region just above the sinotubular junction and in the right anatomic region towards the ascending aorta. The data obtained suggest that the risk of longitudinal failure with a circumferential tear was a possible predisposing mechanism for dissection in the absence of a surgical repair. The creation of accurate FE models based on surgical specimens represents a vital first step in the development of a biomechanically based clinical paradigm for in-vivo, patient-specific aTAA risk prediction.
Acknowledgements
These studies were supported by an American Heart Association Western States Affiliate Medical Student Fellowship.
Footnotes
Presented at the American Heart Association 2013 Scientific Sessions, 16th-20th November 2013, Dallas, Texas, USA
References
- 1.Elefteriades JA. Indications for aortic replacement. J Thorac Cardiovasc Surg. 2010;140(6 Suppl.):S5–S9. doi: 10.1016/j.jtcvs.2010.10.001. discussion S45-S51. [DOI] [PubMed] [Google Scholar]
- 2.Pape LA, Tsai TT, Isselbacher EM, et al. Aortic diameter >or = 5.5 cm is not a good predictor of type A aortic dissection: Observations from the International Registry of Acute Aortic Dissection (IRAD) Circulation. 2007;116:1120–1127. doi: 10.1161/CIRCULATIONAHA.107.702720. [DOI] [PubMed] [Google Scholar]
- 3.Jaussaud N, Chitsaz S, Meadows A, et al. Acute type A aortic dissection intimal tears by 64-slice computed tomography: A role for endovascular stent grafting? J Cardiovasc Surg (Torino) 2013;54:373–381. [PubMed] [Google Scholar]
- 4.Pham T, Martin C, Elefteriades J, Sun W. Biomechanical characterization of ascending aortic aneurysm with concomitant bicuspid aortic valve and bovine aortic arch. Acta Biomater. 2013;9:7927–7936. doi: 10.1016/j.actbio.2013.04.021. [DOI] [PMC free article] [PubMed] [Google Scholar]
- 5.Pichamuthu JE, Phillippi JA, Cleary DA, et al. Differential tensile strength and collagen composition in ascending aortic aneurysms by aortic valve phenotype. Ann Thorac Surg. 2013;96:2147–2154. doi: 10.1016/j.athoracsur.2013.07.001. [DOI] [PMC free article] [PubMed] [Google Scholar]
- 6.Azadani AN, Chitsaz S, Mannion A, et al. Biomechanical properties of human ascending thoracic aortic aneurysms. Ann Thorac Surg. 2013;96:50–58. doi: 10.1016/j.athoracsur.2013.03.094. [DOI] [PubMed] [Google Scholar]
- 7.Okamoto RJ, Xu H, Kouchoukos NT, Moon MR, Sundt TM., III The influence of mechanical properties on wall stress and distensibility of the dilated ascending aorta. J Thorac Cardiovasc Surg. 2003;126:842–850. doi: 10.1016/s0022-5223(03)00728-1. [DOI] [PubMed] [Google Scholar]
- 8.Beller CJ, Labrosse MR, Thubrikar MJ, Robicsek F. Role of aortic root motion in the pathogenesis of aortic dissection. Circulation. 2004;109:763–769. doi: 10.1161/01.CIR.0000112569.27151.F7. [DOI] [PubMed] [Google Scholar]
- 9.Nathan DP, Xu C, Plappert T, et al. Increased ascending aortic wall stress in patients with bicuspid aortic valves. Ann Thorac Surg. 2011;92:1384–1389. doi: 10.1016/j.athoracsur.2011.04.118. [DOI] [PMC free article] [PubMed] [Google Scholar]
- 10.Thubrikar MJ, Agali P, Robicsek F. Wall stress as a possible mechanism for the development of transverse intimal tears in aortic dissections. J Med Eng Technol. 1999;23:127–134. doi: 10.1080/030919099294177. [DOI] [PubMed] [Google Scholar]
- 11.Pasta S, Rinaudo A, Luca A, et al. Difference in hemodynamic and wall stress of ascending thoracic aortic aneurysms with bicuspid and tricuspid aortic valve. J Biomech. 2013;46:1729–1738. doi: 10.1016/j.jbiomech.2013.03.029. [DOI] [PMC free article] [PubMed] [Google Scholar]
- 12.Viscardi F, Vergara C, Antiga L, et al. Comparative finite element model analysis of ascending aortic flow in bicuspid and tricuspid aortic valve. Artif Organs. 2010;34:1114–1120. doi: 10.1111/j.1525-1594.2009.00989.x. [DOI] [PubMed] [Google Scholar]
- 13.Georgakarakos E, Ioannou CV, Papaharilaou Y, Kostas T, Katsamouris AN. Computational evaluation of aortic aneurysm rupture risk: What have we learned so far? J Endovasc Ther. 2011;18:214–225. doi: 10.1583/10-3244.1. [DOI] [PubMed] [Google Scholar]
- 14.Reeps C, Gee M, Maier A, Gurdan M, Eckstein HH, Wall WA. The impact of model assumptions on results of computational mechanics in abdominal aortic aneurysm. J Vasc Surg. 2010;51:679–688. doi: 10.1016/j.jvs.2009.10.048. [DOI] [PubMed] [Google Scholar]
- 15.Yushkevich PA, Piven J, Hazlett HC, et al. User-guided 3D active contour segmentation of anatomical structures: Significantly improved efficiency and reliability. Neuroimage. 2006;31:1116–1128. doi: 10.1016/j.neuroimage.2006.01.015. [DOI] [PubMed] [Google Scholar]
- 16.Azadani AN, Chitsaz S, Matthews PB, et al. Comparison of mechanical properties of human ascending aorta and aortic sinuses. Ann Thorac Surg. 2012;93:87–94. doi: 10.1016/j.athoracsur.2011.08.002. [DOI] [PubMed] [Google Scholar]
- 17.Holzapfel GA, Ogden RW. Modelling the layer-specific three-dimensional residual stresses in arteries, with an application to the human aorta. J R Soc Interface. 2010;7:787–799. doi: 10.1098/rsif.2009.0357. [DOI] [PMC free article] [PubMed] [Google Scholar]
- 18.Matthews PB, Jhun CS, Yaung S, et al. Finite element modeling of the pulmonary autograft at systemic pressure before remodeling. J Heart Valve Dis. 2011;20:45–52. [PubMed] [Google Scholar]
- 19.Morrison TM, Choi G, Zarins CK, Taylor CA. Circumferential and longitudinal cyclic strain of the human thoracic aorta: Age-related changes. J Vasc Surg. 2009;49:1029–1036. doi: 10.1016/j.jvs.2008.11.056. [DOI] [PMC free article] [PubMed] [Google Scholar]
- 20.Grande KJ, Cochran RP, Reinhall PG, Kunzelman KS. Stress variations in the human aortic root and valve: The role of anatomic asymmetry. Ann Biomed Eng. 1998;26:534–545. doi: 10.1114/1.122. [DOI] [PubMed] [Google Scholar]
- 21.Grande KJ, Cochran RP, Reinhall PG, Kunzelman KS. Mechanisms of aortic valve incompetence: Finite element modeling of aortic root dilatation. Ann Thorac Surg. 2000;69:1851–1857. doi: 10.1016/s0003-4975(00)01307-2. [DOI] [PubMed] [Google Scholar]
- 22.Duprey A, Khanafer K, Schlicht M, Avril S, Williams D, Berguer R. In vitro characterisation of physiological and maximum elastic modulus of ascending thoracic aortic aneurysms using uniaxial tensile testing. Eur J Vasc Endovasc Surg. 2010;39:700–707. doi: 10.1016/j.ejvs.2010.02.015. [DOI] [PubMed] [Google Scholar]
- 23.Han HC, Fung YC. Direct measurement of transverse residual strains in aorta. Am J Physiol. 1996;270(2):H750–H759. doi: 10.1152/ajpheart.1996.270.2.H750. Pt 2. [DOI] [PubMed] [Google Scholar]


