

SUMMARY
Mutations in SF3B1, which encodes a spliceosome component, are associated with poor outcome in chronic lymphocytic leukemia (CLL), but how these contribute to CLL progression remains poorly understood. We undertook a transcriptomic characterization of primary human CLL cells to identify transcripts and pathways affected by SF3B1 mutation. Splicing alterations, identified in the analysis of bulk cells, were confirmed in single SF3B1-mutated CLL cells and also found in cell lines ectopically expressing mutant SF3B1. SF3B1 mutation was found to dysregulate multiple cellular functions including DNA damage response, telomere maintenance, and Notch-signaling—mediated through KLF8 upregulation, increased TERC and TERT expression, or altered splicing of DVL2 transcript, respectively. SF3B1 mutation appears to be a mechanism by which changes in diverse cancer-related pathways are generated.
Keywords: CLL, SF3B1, Notch signaling, RNA sequencing, alternative splicing
INTRODUCTION
Large-scale cancer sequencing efforts have enabled the discovery of paths to carcinogenesis. In chronic lymphocytic leukemia (CLL), these initiatives unexpectedly led to the identification of highly recurrent mutations in SF3B1, which encodes a key component of the spliceosome, at restricted sites (50% at K700E), implicating a role of altered RNA splicing in CLL (Quesada et al., 2012; Rossi et al., 2011; Wang et al., 2011). Mutated SF3B1 has been associated with adverse clinical outcome in CLL and has a higher incidence in refractory CLL (Jeromin et al., 2014; Landau et al., 2015). However, mechanistic insights into downstream paths affected by mutated SF3B1 and its role in the oncogenic phenotype are still unclear.
SF3B1 is an essential component of the U2 snRNP, which interacts with branch point sequences close to 3’ splice sites during pre-mRNA splicing (Chen and Manley, 2009). The critical function of SF3B1 in pre-mRNA splicing leads to the hypothesis that SF3B1 mutations contribute to CLL through the generation of alternatively spliced transcripts. A variety of previous studies have identified splicing alterations associated with mutated SF3B1 in CLL (Alsafadi et al., 2016; Darman et al., 2015; DeBoever et al., 2015; Ferreira et al., 2014; Kesarwani et al., 2016), but the breadth of its functional impact on CLL biology has remained elusive. The study of SF3B1 function has been complicated by difficulties in the genetic manipulation of human B cells and the complex biology associated with altering an essential component of the splicing machinery.
In the current study, we set out to examine the functional impacts of SF3B1 mutations by overcoming these challenges.
RESULTS
Mis-splicing in CLL samples with SF3B1 mutations is enriched for alternative 3’ splice sites
Given the key role of SF3B1 in pre-mRNA splicing, we hypothesized that features of altered splicing associated with this recurrently mutated gene could provide mechanistic insights into the functional impact of this putative CLL driver. We therefore performed RNA-Seq from poly-A selected RNA of 22 CLL samples and combined these results with a published set of 15 CLL RNA-Seq data (Ferreira et al., 2014) to yield a total of 13 and 24 cases with and without SF3B1 mutation, respectively. Thirteen of 37 cases (4 of 10 SF3B1-mutated cases with known IGHV status) had unmutated IGHV. Of the 9 samples with cancer cell fraction data available, 5 had clonal and 4 had near-clonal (cancer cell fractions of 60–90%) SF3B1 mutations (Table S1).
To identify and classify altered splicing events associated with SF3B1 mutation, we applied the tool JuncBASE (Brooks et al., 2011). We also used JuncBASE to detect unannotated alternative splicing and calculate a “percent spliced in” (PSI) value for each individual splicing event to quantify the inclusion of an alternative exon relative to the total abundance of all isoforms. Unsupervised hierarchical clustering of the samples based on the top 25% most variable splicing events among the 37 CLL cases revealed clustering of CLL cases with SF3B1 mutations, separate from SF3B1 unmutated samples; however, batch effects were observed (Figure S1A).
To account for these batch effects, we implemented a permutation-based approach in the JuncBASE package to identify robustly altered splicing events associated with SF3B1 mutated samples (Experimental Procedures). We found pervasive changes in 3’ splice site selection as observed by a large skew toward lower p values in a Q–Q plot (Figure 1A). To a lesser extent, SF3B1 mutations also were associated with changes in other types of alternative splicing (e.g., alternative 5’ splice sites, cassette exons) (Figure S1B). Although significant splicing changes (p < 0.05) were consistent amongst SF3B1-mutated CLLs, the majority of changes were subtle, such that 65% showed a <10% difference in the median PSI value (ΔPSI) of SF3B1 wild-type and mutated samples (Figure S1C, Table S2). When randomly sampling 13 versus 24 cases, 92% of ΔPSI values were <10%, supporting a difference in PSI of > 10% as an appropriate cutoff to identify alterations with stronger effects (Figure 1B).
Figure 1. SF3B1 mutation is associated with alternative splicing at 3’ splice sites in CLL.

(A) Q–Q plots comparing observed empirical with expected p values between SF3B1 wild-type and mutated CLL identified through the analysis of bulk poly-A selected RNA-seq from 37 CLLs. Red line - the least-squares linear fit to the lower 95 percentile of points with slope λ. Grey-shaded areas - 95% confidence intervals for the expected distribution.
(B) Frequency of ΔPSI from random comparisons (top) or significant splice changes (middle, p<0.05) from the RNA-Seq data above and volcano plot of ΔPSI versus log10(p) of all splicing changes (bottom). Red dotted lines - thresholds of ΔPSI of 10%. Blue dots -significant splicing events.
(C) Categories of alternative splicing within the 304 splice events significantly associated with mutant SF3B1 in CLL vs. the 304 most variable alternatively spliced events in wild-type CLL from bulk poly-A selected RNA-seq.
(D) Heat map of the top 40 alternatively spliced events with the highest ΔPSI between CLL samples with mutant (n=13) and wild-type (n=24) SF3B1. Expression of splice variants from RNA-seq analysis of CD19+ selected B cells from 7 healthy adult volunteers indicated, along with RNA-seq batch labels, SF3B1 mutation type and clonality status. Right panel - ΔPSI for each splice event.
(E) Left-Density plot of the positions of cryptic AGs relative to their canonical splice sites in SF3B1 mutant samples, compared to the distance to the first AG (non-GAG trimer) from all RefSeq canonical 3’ splice sites. Right-Relative positions of mapped branchpoints (BP) (n = 16) from Mercer et al. X axis - distance in nucleotides (nt) of the BP to the cryptic AG (upstream positions are negative distances); Y axis - the frequency of BP found at that position.
(F) Validation of RNA-seq analysis through quantitative PCR of selected significantly altered spliced events in independent CLL samples (11 with wild-type (WT) and 10 with mutated (MT) SF3B1).
See also Figure S1.
Because altered splicing may generate splice variants that could in turn affect cellular circuitry, we focused on splicing changes most strongly associated with SF3B1 mutation (false discovery rate (FDR) < 10% and ΔPSI > 10%), resulting in 304 splicing changes (Table S2). As expected, there was a significant difference in the types of alternative splicing events strongly associated with SF3B1 mutation, compared to highly variable splicing events among samples without SF3B1 mutation (p < 0.0001, Figure 1C). CLL samples without SF3B1 mutation had PSI values for these splicing events similar to normal B cells from 7 healthy donors, further indicating that these splicing alterations are specific to SF3B1 mutation and not a general feature of CLL (Figure 1D, Figure S1D). We observed a bias in the distance between the canonical to alternative 3’ splice sites associated with SF3B1 mutation. In addition, branchpoints used in SF3B1 WT conditions (Mercer et al., 2015) were found to map at or <10nt from the aberrant 3’ splice site (Figure 1E) and we observed A’s enriched upstream of the aberrant 3’ splice site (Figure S1E), suggesting altered branchpoint usage in the presence of SF3B1 mutation, as recently described (Alsafadi et al., 2016; Darman et al., 2015; DeBoever et al., 2015). Of 4 randomly selected candidate SF3B1 mutation-associated splice variants (GCC2, MAP3K7, TPP2, ZNF91), all were validated as present by quantitative real-time RT-PCR in 10 independent CLL samples, but not in 11 wild-type SF3B1 CLL samples (Table S1, Figure 1F).
SF3B1 mutation causes alternative splicing
To confirm the effects of SF3B1 mutation on RNA splicing, we cloned full-length wild-type and K700E-mutated SF3B1 using codon-optimized cDNA sequences (GenBank KX881377). Over-expression of these constructs in the hematopoietic cell line K562 revealed SF3B1 expression within the cell nucleus, demonstrating that mutation does not affect the nuclear localization of SF3B1 (Figure 2A). N-terminal tagged, but not C-terminal tagged, mutated SF3B1 appropriately bound to other protein components of the U2 snRNP (Figure 2B, Figure S2A–B). Hence, mutated SF3B1 still interacts with its binding partners, suggesting its ability to participate in pre-mRNA splicing.
Figure 2. Expression of mutant SF3B1 causes alternative splicing.

(A) Schematics of wild-type (WT) and K700E mutated (MT) SF3B1 expression constructs (top) and immunoflourescence staining of FLAG-tagged SF3B1 in K562 cells that were nucleofected with SF3B1 constructs (bottom).
(B) Cell lysate from HeLa cells overexpressing either WT or MT SF3B1 was immunprecipated with anti-FLAG antibody and probed with anti-SF3B1 antibody.
(C) FLAG-tagged mutant and wild-type SF3B1 protein were transiently expressed in HEK293T cells and detected by immunoblotting.
(D) Expression of alternative splicing associated with SF3B1 mutations in transfected K562 cells (left, n=4 for each group) and in isogenic Nalm-6 cells (right) was assessed with quantitative RT-PCR assays.
(E) Analysis of bulk poly-A selected RNA-seq of K562 cells expressing SF3B1-K700E. Top panel- Q–Q plot of alternative 3’ splice sites between empirical p value of observed and expected spliced events. Lower panel - volcano plot of ΔPSI in relation to significance between wild-type and mutant SF3B1 overexpression in K562 cells for each splicing events. Red dots - significantly differentially spliced events also identified in the primary CLL analysis.
See also Figure S2.
Following introduction of these full-length expression constructs into cell lines including K562, HeLa, U2OS, JeKo-1 and HG3, and also primary B cells, we observed expression of mutated SF3B1 protein over 24–72 hours (Figure 2C), which was associated with upregulation of splice variants identified from the aforementioned bulk RNA-Seq analysis (Figure S2C, Table S2). For example, K562 cells transfected with the SF3B1-K700E expression construct revealed a more than 10-fold increase in candidate splice-variant expression compared to cells expressing wild-type SF3B1 (p <0.0001; Figure 2D). Likewise, expression of altered splice variants was observed in isogenic Nalm-6 cells, gene-edited at the endogenous SF3B1 locus to express SF3B1K700E or SF3B1H662Q but not in matched control (SF3B1K700K) cells (p <0.0001; Figure 2D) (Darman et al. 2015). JuncBASE analysis of RNA-Seq data from K562 cells expressing mutant SF3B1 showed pervasive altered 3’ splice site usage, and enrichment of the same splice variants observed in primary CLL samples (35 events, chi-squared, p < 0.0001) (Figure 2E, Figure S2D, Table S3). Altogether, these results link SF3B1 mutation with the generation of splicing changes in CLL, either through direct or indirect interactions.
Single CLL cells with mutated SF3B1 demonstrate altered splicing
We confirmed the association of SF3B1 mutation with splicing through the analysis of single cells. We adapted a sensitive microfluidics-based approach that uses multiplexed targeted amplification of RNA to simultaneously detect expressed genes, somatic mutations, and alternative splicing within a single cell (Supplemental Experimental Procedures). Assays for targeted detection of specific SF3B1 wild-type versus mutant alleles in single cells were generated. In this manner, we confirmed the association of mutation in SF3B1 with altered splicing through the analysis of hundreds of single cells within each sample. By bulk analysis, the SF3B1-G742D mutation was estimated to be present in 15% of the sample population of CLL096, while the SF3B1-K700E mutation was nearly clonal (>84%) in sample CLL032. We established background expression thresholds using 96 single CD19+ B cells from a healthy adult with no SF3B1 mutation (Figure 3A, Table S4). Consistent with the bulk estimates, 44 of 367 (12%) CLL096 single cells were positive for SF3B1-G742D, whereas 215 of 288 (75%) CLL032 single cells were positive for SF3B1-K700E. Assays for detection of constitutive and alternative forms of MAP3K7, ZNF91, and GCC2 transcripts (identified as significantly alternatively spliced from the bulk analysis) were also generated for single cells. In the single cells with mutated SF3B1 from CLL096, we observed significantly higher levels of the altered SF3B1-mutation associated splice variants (Figure 3B, Table S4).
Figure 3. Single CLL cells with SF3B1 mutation express alternatively spliced RNAs.

(A) Example of SF3B1 mutation call in single normal B cells and from CLL cells from samples with either subclonal (CLL096) or clonal (CLL032) SF3B1 mutation. Log2 transformed expression of mutant vs wild-type SF3B1 alleles are plotted, with each dot representing one single cell. Purple - cells identified to be SF3B1 wild-type; Orange - cells inferred to be SF3B1 mutant; Grey - cells with ambiguous calls.
(B) Expression of alternative vs. constitutive transcript relative to total expression of the genes MAP3K7, ZNF91 and GCC2 from single cells of sample CLL096.
(C) Frequency of mutations in SF3B1 at different mutation sites from a recent study of 538 CLL samples (Landau et al., 2015). Yellow shading - heat repeat region; Blue - mutation sites previously reported from the COSMIC database.
(D) Single cell profiling of splice variant expression across 5 SF3B1 mutations from 6 CLL samples (one cell per column). Expression of the alternative transcript relative to total gene expression in 24 selected genes, identified from the bulk poly-A RNA-seq analysis, was scored along with 3 control genes. Orange and purple bars indicate cells with and without mutation, respectively.
To explore if other SF3B1 mutations result in a spectrum of altered splicing similar to K700E, we examined 845 cells from 6 patient samples across 5 different SF3B1 mutations using 45 splice variant assays (Table S4). For 4 of 5 mutations (E622D, K666Q, K700E, G742D), we observed highly similar patterns of significant altered splicing (p < 0.05) for 24 of 45 splice variants. The one SF3B1 mutation (Q903R) positioned farther from the mutation-enriched region (but still in the HEAT repeat domain) did not exhibit increased alternative splicing for the selected K700E mutation-associated variants (Figure 3C, Table S1). Splicing events not found to be associated with the SF3B1-K700E mutation also did not show splicing changes for other HEAT repeat mutations, supporting the idea that the shared splicing events are specific to SF3B1 mutation rather than a generalized splicing defect in CLL.
Preferential 3’ splice site alterations in SF3B1 mutated samples are also observed in CLL total RNA
Since SF3B1 acts on pre-mRNA and splicing can occur co-transcriptionally in advance of polyadenylation, the full effects of SF3B1 mutation on splicing may be masked by sequencing of only fully processed and stable mRNAs. We therefore examined the transcriptome changes of non-poly-A selected total RNA by RNA-seq from 3 wild-type and 3 SF3B1 mutated samples, using an rRNA depletion method (Adiconis et al., 2013; Levin et al., 2010). Three of 6 samples (1 wild-type and 2 SF3B1 mutated) were included in the aforementioned poly-A selected RNA-Seq analysis (Table S1). From the total RNA libraries, the number of mapped paired reads (median of 27 million) was comparable to those of the poly-A selected libraries (median of 25 million) (Figure S3A, left). However, 55% of reads from sequenced total RNA mapped within introns compared to 28% from the same RNA sample processed by poly-A selection, consistent with the increased sequencing of pre-mRNA from these libraries (Figure S3A, right). We again observed an enrichment of 3’ splice site changes associated with SF3B1 mutation, further supporting the idea that this effect is unlikely due to a bias in the stability of fully processed mRNAs (Figure 4A, Table S5).
Figure 4. Affected genes associated with SF3B1 mutation in CLL samples.

(A) Q–Q plots of alternative 5’ and 3’ splice sites between empirical p value of observed and expected spliced events from RNA-Seq analysis of CLL total RNA libraries.
(B) Heat map visualizations of significantly differentially expressed genes (batch corrected, adjusted p value < 0.2) between CLL samples with or without SF3B1 mutation derived from poly-A selected RNA. The barplot at the right shows the average log2 fold expression difference between the two conditions.
(C) Left-visualization of the 327 significantly differentially expressed genes (batch corrected, adjusted p value < 0.2) identified from total RNA libraries derived from one sample of normal CD19+ B cells, two SF3B1 wild type samples, and three SF3B1 mutant CLL samples. Right- heatmap of the same genes, extracted from RNA-Seq data prepared from poly-A selected libraries of matched CLL samples.
(D) TERC expression in CLL samples with SF3B1 mutation from RNA-Seq data prepared from either total RNA or poly-A selected libraries. Mean (red line) ± SD; n=3.
(E) TERC expression was assessed in independent CLL samples with mutant or wild-type SF3B1, with cDNA prepared with random hexamers.
(F) TERC and TERT expression was examined in Nalm-6 cells gene-edited to express SF3B1K700E and SF3B1H622Q (compared to SF3B1K700K), with cDNA prepared with random hexamers. Red line indicates mean.
(G) Telomerase activity in Nalm-6 cells expressing either SF3B1K700E or SF3B1K700K was measured with telomeric repeat amplification protocol assay. Shown are representative results from one of three experiments.
See also Figure S3.
Sequencing data from total RNA provided an opportunity to directly investigate branchpoint usage when SF3B1 is mutated by identifying reads derived from spliced lariats that spanned the branchpoint (Taggart et al., 2012). As expected, since we did not enrich for spliced lariats (Mercer et al., 2015), we only identified branchpoint support for 3 events that were differentially spliced in the presence of SF3B1 mutation and 14 in a set of control splicing events after stringent filtering (Experimental Procedures, Table S5). For the event in GCC2 where cryptic 3’ splice site usage was observed upstream of the annotated splice site in SF3B1 mutated samples, there were 11 lariat reads among 3 SF3B1 mutated samples supporting upstream alternative branch point usage and 4 lariat reads supporting downstream branchpoint usage compared to two branchpoint positions identified in an SF3B1 wild-type sample (Table S5). Improved genome-wide approaches to enrich for branchpoint spanning reads in SF3B1 mutated samples will provide more conclusive evidence of differential branchpoint usage.
SF3B1 mutation impacts multiple cellular pathways
To investigate the global effects of SF3B1 mutation on cellular processes in CLL, we examined whether coherent changes in cellular pathways could be observed in samples with SF3B1 mutation compared to those without. We identified 1963 and 327 significantly differentially expressed genes (batch corrected, adjusted p value < 0.2) between these two groups through analysis of the poly-A and total RNA libraries, respectively (Figure 4B–C, Table S6). Differentially expressed genes from the total RNA data exhibited similar trends and directionalities in matched poly-A data (Figure 4C) and vice versa (Figure S3B–D). Ninety-nine of 327 genes from the total RNA libraries overlapped with differentially expressed genes identified from the poly-A selected libraries (Figure S3E). In addition, twenty-five percent of significantly differentially expressed genes were found in common between the primary CLL datasets and with previously reported data from the Nalm-6 lines (Darman et al., 2015).
We explored the spectrum of non-polyadenylated transcripts associated with SF3B1 mutation through RNA-seq analysis of the total RNA libraries. One noteworthy target with significantly increased expression in mutant SF3B1 samples was TERC, encoding an essential RNA component of telomerase. TERC transcript could be amplified in total RNA from SF3B1 mutated samples, but was undetected in the matched poly-A RNA (Figure 4D). We validated this discovery in independent CLL samples (p=0.0039) using cDNA generated by random hexamers (Figure 4E). Examination of the Nalm6 isogenic cell lines showed both K700E and H622Q mutations to lead to upregulation of TERC and TERT gene expression (Figure 4F). Since TERC overexpression can increase telomerase activity in activated lymphoid cells (Weng et al. 1997), and the spliceosome has been implicated in telomerase RNA processing in yeast (Qi et al. 2015), we investigated if SF3B1 mutation impacted telomerase activity. Indeed, SF3B1K700E Nalm-6 cells had higher telomerase activity than cell lines with the silent mutation by a sensitive in vitro PCR-based assay (Figure 4G). Altogether, mutant SF3B1 may affect telomerase activity through dysregulated TERC and TERT expression.
To more generally identify possible cellular processes altered by SF3B1 mutation, we performed gene set enrichment analysis (GSEA) against 1970 gene sets from MSigDb, and 14 additional manually curated gene sets from pathways known to be altered in CLL. From the 1963 differentially expressed genes from the poly-A RNA-seq data, we identified 180 significantly upregulated and 37 downregulated gene sets (q-value < 0.1), with enrichment across diverse cellular processes related to cancer and CLL (Table S7). Likewise, GSEA of 327 differentially expressed genes from the total RNA data and of 341 SF3B1 mutation-associated splice variants (all q-value < 0.1) revealed involvement in a similar spectrum of diverse cellular processes (Figure 5A, Table S7).
Figure 5. SF3B1 mutations affect genes involved in multiple CLL-associated pathways.
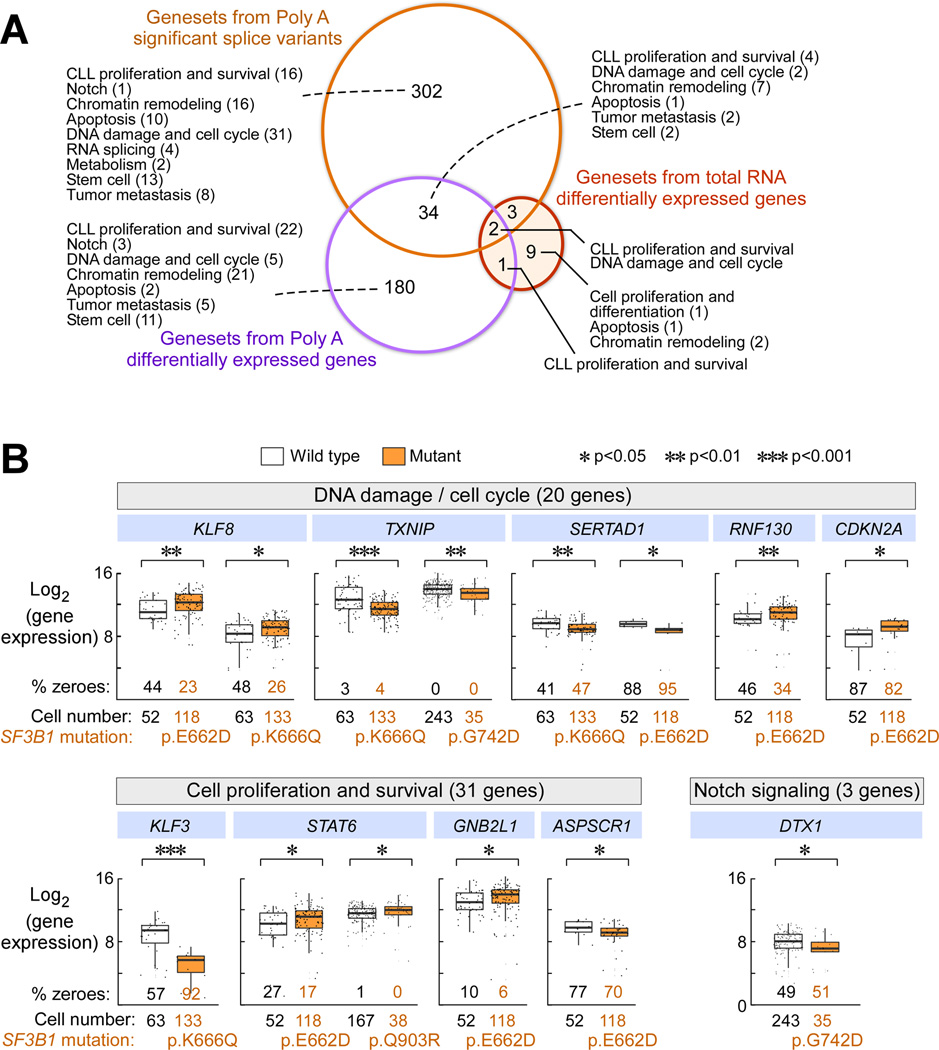
(A) An analysis of overlap of enriched gene sets (all with q-value < 0.1) using splice variants and differentially expressed genes associated with mutant SF3B1 derived from total and poly-A selected RNA libraries. This analysis includes 1970 gene sets from MSigDb and 14 additional manually curated gene sets. Each number represents the number of gene sets enriched in the different groups.
(B) Gene expression of single CLL cells from samples with subclonal SF3B1 mutation that were tested in parallel against a panel of 96 genes, encompassing targets of CLL-associated pathways. Significantly differentially expressed genes associated with expression of SF3B1 mutation in individual cells associated with the DNA damage response and cell cycle regulation, proliferation and survival and Notch signaling are shown. Median is represented as a line inside the box. Lines at the bottom and top of the box represent, respectively, the 25th and the 75th quartile, and lines above and below the box show the minimum and maximum. P values were defined by a two-sided Wilcoxon rank sum test. ‘% zeroes’ represents the percent of total cells samples with zero expression for that particular genes.
See also Figure S4.
Signals obtained from bulk analyses reflect only the average characteristics of a population. Since SF3B1 mutation is commonly a subclonal event in CLL (Landau et al., 2013), we assessed the effects of SF3B1 mutation on the transcriptome of the subpopulation of single cells within CLL cases with mutated SF3B1 (vs. with wild-type SF3B1). We performed whole transcriptome amplification and sequencing of up to 96 individual cells per sample from 2 primary CLL samples with (CLL032 and CLL096) and 2 without (CLL003, CLL005) SF3B1 mutation. We noted poor ability to directly call SF3B1 mutation status from these data, as SF3B1 expression across single cells was highly variable (mean SF3B1 expression 870.20 counts +/− 1677.15 sd) and lacking in 11 cells. Likewise, coverage at the SF3B1 mutation site was highly variable and lacking in the majority of cells from CLL032 and CLL096, such that we were only able to confidently call SF3B1 mutation in 12 cells. As an alternative, we attempted to infer SF3B1 mutation status of individual cells based on expression of 59 significantly 3’ alternatively spliced isoforms associated with SF3B1 mutation (per bulk RNA-Seq analysis) and with detectable expression in single cells. Still, with this strategy, we could readily distinguish between bulk samples with or without SF3B1 mutation but were nonetheless unable to confidently ascertain mutation status on the majority of individual cells (Figure S4, Table S8).
We therefore used a microfluidics-based targeted gene expression and SF3B1-mutation detection approach to identify significant changes in genes associated with pathways implicated by GSEA in single cells. We developed a panel of 96 gene expression assays encompassing target genes across the diverse affected pathways (Table S9), against which we interrogated expression of 1109 SF3B1-wild-type and mutant single cells from samples CLL161, 171, 096, or 040. Across the 4 samples, single cells with SF3B1 mutation were significantly associated with changes in genes related to poor prognosis in CLL and cancer (KLF3, TYROBP, DDIT4, FYN, GNBL2, TRABD, STAT6, ZBTB48), apoptosis (BIRC3, BCL2, SH3BP1, KLH21, TIMP1), DNA damage and cell cycle (KLF8, ATM, FANCD2, CDKN2A, CCND1, CCNE1, TXNIP, RNF130, ANAPC7, KLF3, LRWD1, SKP2, SERTAD1, FRK) and Notch signaling (DTX1) (p < 0.05; Figure 5B, Table S9).
Next we systematically examined evidence of change in other pathways previously characterized as affected in CLL (Landau et al., 2013) through overexpression of wild type versus mutated SF3B1 in cell lines or in the isogenic Nalm-6 cells using established pathway readout assays. We did not detect any impact of overexpressed SF3B1 mutation on Wnt pathway signaling, nor on cell cycle or apoptosis (Figure 6A). Consistent with the single cell results, we found evidence of altered DNA damage response with overexpression of mutated SF3B1 in cell lines. HeLa cells overexpressing mutant SF3B1 demonstrated greater evidence of DNA damage (Figure 6B, Figure S5A). Since KLF8, a kruppel-like transcription factor implicated in tumor transformation, progression and DNA damage repair in solid tumors (Lu et al., 2012), was consistently upregulated in SF3B1-mutated samples at both single cell (Figure 5B) and bulk RNA levels (Figure 6C), we tested the effects of overexpression of KLF8 on this pathway. With overexpression of KLF8 in HEK293 and Nalm-6 SF3B1K700K cells, higher levels of DNA damage were consistently induced, as detected by γH2AX expression and attenuated phosphoryation of CHK2 following exposure to γ-irradiation (Figure 6D–E, Figure S5B–C). These results support SF3B1 mutation-associated gene dysregulation as a contributor to altered DNA response. In the Nalm-6 cell lines, we consistently observed a subtle growth disadvantage associated with SF3B1 mutation when in coculture with the SF3B1K700K expressing cells (Figure 6F), although this was not due to mutation-induced cell cycle arrest or apoptosis (data not shown).
Figure 6. Functional assessment of SF3B1 K700E on cellular processes in CLL and in cell lines.

(A) Summary of effects of expressing SF3B1-K700E on 6 CLL-associated pathways examined in different cell lines. Shaded –cell lines and pathways for which SF3B1-K700E expression appeared to exert a functional change in the cell type evaluated.
(B) Levels of phosphorylated forms of H2AX, ATM and CHK1 in HeLa cells upon γ-irradiation were examined from cells overexpressing wild-type or mutant SF3B1 for 48 hours. Relative signal intensity was plotted based on Image J quantification of bands from the raw image.
(C) Box-and-whisker plots of KLF8 expression in bulk CLL samples with SF3B1 mutation compared to WT SF3B1 derived from the RNA-seq dataset was plotted (Median-center line within box; Bottom and Top lines of box represent the 25th and the 75th quartile, respectively, while whiskers above and below the box show the minimum and maximum values).
(D, E) DNA damage response was assessed in HEK293 (D) and Nalm-6 (E) SF3B1K700K cells that were transfected or nucleofected with control or KLF8 expressing constructs upon various doses of γ-irradiation, and protein levels of phosphorylated form of H2AX protein expression was quantified using Image J.
(F) Nalm-6 SF3B1K700E and SF3B1K700K cells were co-cultured and the percentage of each cell population was assessed daily. Shown is representative data from 2 independent culture experiments.
See also Figure S5.
SF3B1 mutation affects Notch signaling through a splice variant of DVL2
Using a well-characterized Notch luciferase-reporter-assay system (Minoguchi et al., 1997), we detected significantly higher Notch pathway activation induced across myeloid and lymphoid cells lines expressing mutated SF3B1 compared to wild-type SF3B1 when Notch signaling in these cells was activated by co-expression of an active form of Notch 1 (Figure 7A, Figure S6A–B). We confirmed that the observed upregulation of Notch signaling was not due to changes in activated Notch 1 since its levels were detected at equivalent levels in the cell lines expressing either wild-type or mutant SF3B1 (Figure S6C).
Figure 7. SF3B1 mutation modulates Notch signaling and generates alternative splicing of DVL2.

(A) Nalm-6 SF3B1K700K, SF3B1H622Q and SF3B1K700E cells were nucleofected with a Notch luciferase reporter along with a GFP-expressing plasmid in the presence or absence of a Notch1-expressing construct. 48 hours after the nucleofection, GFP positive cells were isolated and Notch activity in these cells was assessed by measuring luciferase activity.
(B) Visualization of the DVL2 transcript from RNA-Seq of CLL samples with and without SF3B1 mutation.
(C) Detection of DVL2 transcript using primers that cross exons 10 and 11 with cDNA derived from K562 cells overexpressing the vector control, or the wild-type or mutant SF3B1. Sanger sequencing of the two different fragments from mutant samples revealed the same junction as detected in the RNA-Seq.
(D) DVL2 alternative transcript levels in the Nalm-6K700E, Nalm6 H622Q, and Nalm-6K700K cells. (E) Expression of the alternative splice isoform of DVL2 mRNA (alt-DVL2) is evaluated in relation to SF3B1 mutation. PSI of alt-DVL2 in RNA-Seq data from the GTEx consortium (693 samples from blood, brain, breast, lung, and colon), 7 samples of normal B cells, 37 CLL samples and K562 and HEK293T cells overexpressing wild-type or mutant SF3B1 (Median-center line within box; Bottom and Top lines of box represent the 25th and the 75th quartile, respectively, while whiskers above and below the box show the minimum and maximum values). (F) Total mRNA or the alternative form of DVL2 expression in single CLL cells with mutated or wild-type SF3B1, using samples and an analysis approach per Figure 3D. Median is represented as a line inside the box. Lines at the bottom and top of the box represent, respectively, the 25th and the 75th quartile, and lines above and below the box show the minimum and maximum. Outliers displayed as points.
(G, H) Detection of protein expression of alternative DVL2 in Nalm-6 isogenic cell lines (G) and primary CLL samples with or without SF3B1 mutation (H).
See also Figure S6.
Given these unexpected observations, we considered whether altered spliced variants associated with SF3B1 mutation could mediate downstream Notch pathway signaling. Focusing on splicing events in genes involved in Notch signaling identified from GSEA of splice variants, we identified an altered splicing event in DVL2 as a promising candidate target (PSI = 29.6). A core canonical Wnt pathway member, DVL2 has also been previously reported to negatively regulate Notch signaling (Collu et al., 2012). Examination of the RNA-seq level evidence revealed CLL samples with SF3B1 mutation to exhibit preferential 3’ altered splicing between exons 10 and 11 of DVL2, leading to an in-frame 24 amino acid deletion (Figure 7B). By RT-PCR of transcript spanning exons 10 and 11, we could detect both normal and altered DVL2 transcripts in K562 cells overexpressing mutated SF3B1 but only the normal variant in cells overexpressing the wild-type protein, confirmed by Sanger sequencing of the constitutive and altered products (Figure 7C). Moreover, we confirmed higher expression of altered rather than constitutive DVL2 in Nalm-6 SF3B1K700E and SF3B1H622Q cells compared to Nalm-6 SF3B1K700K cells (Figure 7D).
A more thorough examination of DVL2 transcript expression across bulk RNA-seq datasets confirmed the strong association between expression of altered DVL2 transcript and of SF3B1 mutation. Altered DVL2 was absent or minimally expressed across RNA-Seq samples from 693 normal tissues within the GTEx collection (Consortium, 2015), 7 normal B cells or from 24 CLLs as well as cell lines (K562, HEK293T) with WT SF3B1. In contrast, altered DVL2 expression of >10% PSI was detected in CLLs with mutated SF3B1 or in cell lines overexpressing mutated SF3B1 (Figure 7E). We confirmed the higher expression of the DVL2 splice variant in individual primary CLL cells with SF3B1 mutation compared to those without, despite equivalent total DVL2 expression between these two cell populations (Figure 7F). In addition, the protein product of altered DVL2 was readily identified by immunoblot in the isogenic B cell lines (Nalm-6 SF3B1K700E, SF3B1H622Q), with overexpression of the SF3B1-K700E construct in K562 cells, and in primary CLL samples with SF3B1 mutation but not in those without (Figure 7G–H, Figure S6D). Expression of altered DVL2 at transcript and protein levels was stable for at least 96 hours following expression of mutated SF3B1 in cell lines, with similar degradation rates between altered and wild-type DVL2 after exposure to the protein synthesis inhibitor cycloheximide (Figure S6E–G).
To directly test whether altered DVL2 dysregulates Notch signaling, we subcloned DVL2 wild-type and altered cDNA into expression vectors (Figure S7A–B), and tested if expression of altered DVL2 could change Notch signaling. Although the Notch pathway was clearly activated in K562 cells following overexpression of full-length SF3B1-K700E (Figure S6A–B), we focused on developing a reliable system to interrogate this pathway in a B cell context. We therefore generated stable B cell lines (from the lymphoma OCI-Ly1 line) expressing either wild-type or altered DVL2 or both through lentivirus-mediated transduction (Figure 8A), and then activated the Notch pathway through co-culture with OP-9 cells overexpressing the Notch ligand Delta 1 (‘OP9-DL1 cells’). In the setting of Notch pathway activation, wild-type DVL2 repressed Notch signaling, as previously reported (Collu et al., 2012). In contrast, expression of altered DVL2 markedly abrogated these repressive effects. Moreover, combined expression of wild-type and altered DVL2 also reversed these repressive effects, suggesting the dominant impact of altered DVL2 on the wild-type isoform (Figure 8B). In line with these findings, expression of the downstream Notch pathway target gene HES1 was higher in the presence of altered DVL2 and of combined altered and wild-type DVL2 than when wild-type DVL2 was expressed alone (p< 0.05) (Figure 8C). The impact of altered DVL2 on Notch pathway activation was independent of an effect on Wnt pathway signaling, since altered and wild-type DVL2 demonstrated equivalent potencies for activating the Wnt signaling (Figure S7C–D). Altogether, these data identify DVL2 as a target of mutated SF3B1 through which alternative splicing modulates Notch signaling activity.
Figure 8. SF3B1 mutation modulates Notch signaling through a splice variant of DVL2.

(A) Detection of DVL2 expression in OCI-Ly1 B cell lymphoma cells with stable expression of wild-type (WT), altered (ALT), or combined wild-type and altered forms (WT+ALT) of DVL2 by immunoblot.
(B) Activation of Notch1 in OCI-Ly1 cells expressing different DVL2 isoforms co-cultured with OP9 or OP9-DL1 cells for 48 hours assessed by immunoblot.
(C) Expression of the Notch target gene HES1 in OCI-Ly1 cells described in Figure 8A co-cultured with either OP9 or OP9-DL1 cells was measured by qRT-PCR. Red line indicates mean. See also Figure S7.
DISCUSSION
Mutations in transcription factors can wield a multitude of effects on cancer cells; mutated TP53 is a prototypical example of this concept (Bieging et al., 2014). Our comprehensive transcriptome characterization of mutated SF3B1 in CLL, together with growing knowledge of the types of transcript alterations arising from other cancer-associated mutated splicing factors and the subsequent effects on cellular transformation (e.g., mutated U2AF1 and SRSF2) (Brooks et al., 2014; Ilagan et al., 2015; Kim et al., 2015; Park et al., 2016; Shirai et al., 2015) suggest that mutated splicing factors in cancer may well behave in an analogous fashion. We now demonstrate that mutated SF3B1 induces hundreds of alterations both through splicing and dysregulated gene expression, with involvement of these RNA changes across diverse cellular processes previously implicated in CLL through somatic mutation characterization.
The majority of SF3B1 mutation-associated splicing changes have been previously reported to create transcripts with premature stop codons, resulting in truncated proteins or downregulation of gene expression through nonsense-mediated decay (Darman et al., 2015; DeBoever et al., 2015; Quesada et al., 2012). We likewise observed numerous splicing changes in CLL samples with SF3B1 mutations that would cause a frameshift in the resulting protein (69% with out-of-frame changes). However, of the in-frame splicing alterations, we identified an alteration in DVL2 that increases Notch signaling, a driving pathway in CLL (Puente et al., 2015; Puente et al., 2011; Wang et al., 2011). The Notch pathway was first highlighted as an important CLL pathway upon the discovery of recurrent frameshift NOTCH1 mutations in 10–15% of CLL patients from early whole-exome sequencing (WES) studies (Puente et al., 2011; Wang et al., 2011). In CLL, somatic NOTCH1 mutations have been characterized as pathway-activating (Puente et al., 2011) with the induction of apoptosis resistance (Rosati et al., 2009; Zweidler-McKay et al., 2005)), and have been associated with poorer prognosis (Puente et al., 2011). Recently, recurrent activating mutations in the 3’ UTR of NOTCH1 associated with worse prognosis were identified (Puente et al., 2015). Our findings uncover yet another mode by which Notch signaling is activated in CLL. Of note, among the 229 of 538 CLL samples with unmutated IGHV recently characterized by WES (Landau et al., 2015), only two samples have co-occurring NOTCH1 and SF3B1 mutations, which is significantly less frequent than expected by chance under an assumption of independence (p=0.012). Our findings thus support the idea that at least some SF3B1 mutation-induced splicing changes include ‘driver’ rather than ‘passenger’ transcript variants, and reinforce the notion that multiple convergent molecular mechanisms can be utilized by cancer cells to dysregulate core cancer pathways.
While we focused on the functional effects of altered DVL2, we noted several other splice variants in mutated SF3B1 CLLs with ΔPSI >10% predicted to be pathway-altering in genes linked to Notch signaling (e.g., DNAJC3, TRIP12 and HDAC7). Moreover, our results extend findings from other investigators that have suggested subtle changes in the DNA damage response by SF3B1 mutation (Te Raa et al., 2015). A number of altered splice variants in this pathway would be predicted to impose effects on DNA damage response (CHD1L, GAK, RAD9A, JMY). Of the nonpolyadenylated transcripts, we found evidence of TERC overexpression associated with SF3B1 mutation. Finally, we observed KLF3 and KLF8 as the most consistently differential expressed genes across the patient samples with SF3B1 mutation. Both genes have been associated with oncogenic transformation, cell cycle regulation, DNA-damage response and cell differentiation (Lu et al., 2012; Wang and Zhao, 2007). Consistent with this, we observed dysregulated DNA damage responses in cell lines overexpressing KLF8. Our aggregate results support the idea that multiple alterations in transcript sequence or expression impact CLL in a concerted fashion across CLL pathways, and our findings provide rich fodder for future in-depth functional studies.
We emphasize that the numerous transcript-level changes induced by mutated SF3B1 were subtle overall. The majority of identified variants from both poly-A selected and total CLL RNA had ΔPSIs of less than 10%. We focused on spliced transcripts with ΔPSI >10%, but we do not exclude the possibility that lowly expressed altered transcripts could have functional impact. For example, an altered ATM transcript, previously identified as associated with SF3B1 mutation (Ferreira et al., 2014), was also found within our dataset, but with a ΔPSI of <4% (data not shown). Regardless of the ΔPSI cut-off, SF3B1 mutation appears to exert numerous transcript-level changes on a broad range of genes at relatively low intensity per gene to modulate CLL biology. We speculate that this pattern of activity may affect oncogenesis by allowing the cancer cell to tolerate many changes, even in essential genes, without drastically affecting cell viability, hence allowing these changes to be propagated. At the same time, these broad changes vastly increase the diversity of gene expression in the cancer cell and would be anticipated to enhance its evolutionary capacity. Indeed, this may explain why mutation in SF3B1 in otherwise normal hematopoietic cells, recently described as contributing to clonal hematopoiesis (Jaiswal et al., 2014; Xie et al., 2014), does not alone drive cancer in a B cell. However, consistent with SF3B1 mutation as a ‘later’ or commonly subclonal CLL event (Landau et al., 2013), mutation in SF3B1 in the backdrop of other cancer-driving alterations could push the CLL cell towards a more aggressive phenotype. Recently, another recurrently mutated splicing factor SRSF2 was likewise observed to generate multiple subtle changes in splicing (Zhang et al., 2015), further hinting this as a general mode of action by mutated cancer-associated splicing factor genes.
EXPERIMENTAL PROCEDURES
Human samples
Heparinized blood samples were obtained from healthy donors and patients enrolled on clinical research protocols with informed consent, approved by the Human Subjects Protection Committee of the Dana-Farber Cancer Institute (DFCI) and at UCSD (CLL Research Consortium). For 21 samples, SF3B1 mutation status was confirmed by targeted sequencing.
Full-length SF3B1 expression construct and gene-edited cell lines
Full-length SF3B1 was constructed as described in the Supplemental Experimental Procedures. In brief, full-length SF3B1 was cloned using a partial fragment of SF3B1 cDNA (gift from Dr. Robin Reed, Harvard Medical School) (Wang et al., 1998), and ligating this to a codon-optimized synthetic fragment encoding the uncloned region of 414 nucleotides (Blue Heron Biotechnology, Bothell, WA). Pre-B Nalm-6 isogenic cell lines expressing either endogeneous SF3B1-K700E (SF3B1K700E), SF3B1-H622Q (SF3B1H622Q) or SF3B1-K700K (SF3B1K700K) was introduced by AAV-mediated homology (provided by H3 Biomedicine) (Darman et al., 2015).
Detection of activity of SF3B1 mutation on CLL cellular pathways
Effects of SF3B1 mutation on CLL cellular pathways were assessed in the isogenic Nalm-6 cell lines or in HEK293T, HeLa, U2OS, K562, HG3, JeKo-1, and MEC2 cells by transiently transfecting or nucleofecting vector control, wild-type or mutant SF3B1 constructs, without or with pathway reporters, in the presence or absence of ligand constructs (Wnt 1, Notch1), depending on the readout. We also interrogated stable cell lines expressing the constitutive and/or altered DVL2 transcript on OCI-Ly1 cells with or without co-culture with OP9-DL1 cells (Holmes and Zuniga-Pflucker, 2009). See Supplemental Experimental Procedures for more detailed information..
Bulk and single cell RNA-Seq library generation and data processing
Bulk and single cell RNA-Seq libraries were generated as previously described (Landau et al., 2014). Analysis of alternative splicing was performed using JuncBASE (Brooks et al., 2011) in both bulk and single cell RNA-Seq data. Differential gene-expression analysis on bulk samples and single cells was performed using the DESeq2 R package (Love et al., 2014) and SCDE R package (Kharchenko et al., 2014), respectively. The detailed methods regarding total and poly-A RNA library generation, single cell RNA-Seq, analysis of bulk RNA gene expression, single cell gene expression, mutation call and splice variants are provided in the Supplemental Experimental Procedures.
Statistical analysis
The data in Figures 1F, 2D, 4D–E, 7A and 6D were analyzed using unpaired two-tailed Student’s t test. A p value<0.05 was considered significant. The data in Figure 8C was analyzed using two-tailed Welch t-test.
Supplementary Material
SIGNIFICANCE.
SF3B1 encodes a RNA splicing factor and is among the most frequently mutated genes in CLL; however, mechanistic insights into its role in the oncogenic process are lacking. We report a comprehensive transcriptomic analysis of CLL bulk and single cells, coupled with functional examination, to investigate the impact of mutated SF3B1 on CLL-associated pathways. Our analyses suggest that SF3B1 mutation induces subtle but broad changes in gene expression and splicing across multiple pathways including DNA damage, Notch signaling, and telomere maintenance. We found that SF3B1 mutation modulates DNA damage response through KLF8 upregulation and increases Notch signaling through altered splicing of DVL2. Our studies point to diverse mechanisms that RNA splicing factors can affect cancer phenotype.
Acknowledgments
The authors thank A. D’Andrea, G. Gould, and C. Burge for critical discussions, and J. Wong, G. Harris and B.Z. Tong for excellent technical support. We thank J. Daley, S. Lazo-Kallanian, K. Cowens, and S. Paula of the DFCI Flow Cytometry facility for their assistance in single-cell sorting. We further thank M. Imielinksi, S. Lee and K. Slowikowski for assistance with sequence analysis.
This work was in part supported by funding from the National Institutes of Health to the CLL Research Consortium (PO1-CA81534). L.W. was supported by the Lymphoma Research Foundation (LRF) postdoctoral fellowship . A.N.B. was a Merck Fellow of the Damon Runyon Cancer Research Foundation (DRG-2138-12). J.F. was supported by the National Science Foundation Graduate Research Fellowship (DGE1144152). Y. W. was supported by a fellowship from the Leukemia and Lymphoma Society (LLS). C.J.W. acknowledges support from the Blavatnik Family Foundation, the LRF, NHLBI (1R01HL103532-01; 1R01HL116452-01) and NCI (1R01CA155010-01A1; 1U10CA180861-01) and is a recipient of a LLS Translational Research Program and Scholar Award and of an AACR SU2C Innovative Research Grant.
Footnotes
Accession Numbers
The CLL and normal B cell sequencing data were deposited in the database of Genotypes and Phenotypes (dbGaP) (phs000435.v2.p1) and the processed data deposited in Gene Expression Omnibus (GEO) (GSE58889). SF3B1 codon-optimized cDNA sequences were deposited in GenBank (KX881377).
Author Contributions
L.W., A.N.B., J.F., Y.W., and C.J.W. designed the study. L.W., R.G, K.J.L., S.L., and S.H. performed all the pathway analysis and single cell study related to SF3B1 mutation, Y.W., R.G., and W.Z generated SF3B1 and DVL2 constructs, performed splice variants and TERC validation in primary CLL samples and cell lines and biochemical studies related to incorporation of SF3B1 into the splicing complex. S.Y performed the telomerase activity detection experiment. D.B.B. performed the immunoflorescence staining of SF3B1 in K562 cells. J.Z.L. and L.F. generated the total RNA libraries, L.Z.R., E.M.G., T.J.K., S.F., and J.R.B. provided the samples. A.N.B performed the bulk RNA-Seq analysis and J.F. performed gene expression and single cell analyses. M.S. performed branch point and alternative splice site mapping analysis. S.S.F. performed lariat read mapping. D.K., D.A.L., S.S., K.C., C.L.C., and D.S.D. provided computational help. D.N. performed statistical analysis. S. B., P.G.S., J.C.A., R.R., G.G., M.M.M. and P.V.K. provided reagents and constructive suggestions. C.J.W. supervised the study. All co-first authors prepared the manuscript with help from all co-authors.
Conflict of Interest
Michael Seiler, Silvia Buonamici, Peter G. Smith are employees and shareholders of H3 Biomedicine. Catherine J. Wu is co-founder and scientific advisory board member of Neon Therapeutics, Inc. All other authors have no conflicts of interest.
References
- Adiconis X, Borges-Rivera D, Satija R, DeLuca DS, Busby MA, Berlin AM, Sivachenko A, Thompson DA, Wysoker A, Fennell T, et al. Comparative analysis of RNA sequencing methods for degraded or low-input samples. Nat Methods. 2013;10:623–629. doi: 10.1038/nmeth.2483. [DOI] [PMC free article] [PubMed] [Google Scholar]
- Alsafadi S, Houy A, Battistella A, Popova T, Wassef M, Henry E, Tirode F, Constantinou A, Piperno-Neumann S, Roman-Roman S, et al. Cancer-associated SF3B1 mutations affect alternative splicing by promoting alternative branchpoint usage. Nat Commun. 2016;7:10615. doi: 10.1038/ncomms10615. [DOI] [PMC free article] [PubMed] [Google Scholar]
- Bieging KT, Mello SS, Attardi LD. Unravelling mechanisms of p53-mediated tumour suppression. Nat Rev Cancer. 2014;14:359–370. doi: 10.1038/nrc3711. [DOI] [PMC free article] [PubMed] [Google Scholar]
- Brooks AN, Choi PS, de Waal L, Sharifnia T, Imielinski M, Saksena G, Pedamallu CS, Sivachenko A, Rosenberg M, Chmielecki J, et al. A pan-cancer analysis of transcriptome changes associated with somatic mutations in U2AF1 reveals commonly altered splicing events. PLoS One. 2014;9:e87361. doi: 10.1371/journal.pone.0087361. [DOI] [PMC free article] [PubMed] [Google Scholar]
- Brooks AN, Yang L, Duff MO, Hansen KD, Park JW, Dudoit S, Brenner SE, Graveley BR. Conservation of an RNA regulatory map between Drosophila and mammals. Genome Res. 2011;21:193–202. doi: 10.1101/gr.108662.110. [DOI] [PMC free article] [PubMed] [Google Scholar]
- Chen M, Manley JL. Mechanisms of alternative splicing regulation: insights from molecular and genomics approaches. Nat Rev Mol Cell Biol. 2009;10:741–754. doi: 10.1038/nrm2777. [DOI] [PMC free article] [PubMed] [Google Scholar]
- Collu GM, Hidalgo-Sastre A, Acar A, Bayston L, Gildea C, Leverentz MK, Mills CG, Owens TW, Meurette O, Dorey K, Brennan K. Dishevelled limits Notch signalling through inhibition of CSL. Development. 2012;139:4405–4415. doi: 10.1242/dev.081885. [DOI] [PMC free article] [PubMed] [Google Scholar]
- Consortium GT. Human genomics. The Genotype-Tissue Expression (GTEx) pilot analysis: multitissue gene regulation in humans. Science. 2015;348:648–660. doi: 10.1126/science.1262110. [DOI] [PMC free article] [PubMed] [Google Scholar]
- Darman RB, Seiler M, Agrawal AA, Lim KH, Peng S, Aird D, Bailey SL, Bhavsar EB, Chan B, Colla S, et al. Cancer-Associated SF3B1 Hotspot Mutations Induce Cryptic 3’ Splice Site Selection through Use of a Different Branch Point. Cell Rep. 2015;13:1033–1045. doi: 10.1016/j.celrep.2015.09.053. [DOI] [PubMed] [Google Scholar]
- DeBoever C, Ghia EM, Shepard PJ, Rassenti L, Barrett CL, Jepsen K, Jamieson CH, Carson D, Kipps TJ, Frazer KA. Transcriptome sequencing reveals potential mechanism of cryptic 3’ splice site selection in SF3B1-mutated cancers. PLoS Comput Biol. 2015;11:e1004105. doi: 10.1371/journal.pcbi.1004105. [DOI] [PMC free article] [PubMed] [Google Scholar]
- Ferreira PG, Jares P, Rico D, Gomez-Lopez G, Martinez-Trillos A, Villamor N, Ecker S, Gonzalez-Perez A, Knowles DG, Monlong J, et al. Transcriptome characterization by RNA sequencing identifies a major molecular and clinical subdivision in chronic lymphocytic leukemia. Genome Res. 2014;24:212–226. doi: 10.1101/gr.152132.112. [DOI] [PMC free article] [PubMed] [Google Scholar]
- Holmes R, Zuniga-Pflucker JC. The OP9-DL1 system: generation of T-lymphocytes from embryonic or hematopoietic stem cells in vitro. Cold Spring Harb Protoc. 2009;2009 doi: 10.1101/pdb.prot5156. pdb prot5156. [DOI] [PubMed] [Google Scholar]
- Ilagan JO, Ramakrishnan A, Hayes B, Murphy ME, Zebari AS, Bradley P, Bradley RK. U2AF1 mutations alter splice site recognition in hematological malignancies. Genome Res. 2015;25:14–26. doi: 10.1101/gr.181016.114. [DOI] [PMC free article] [PubMed] [Google Scholar]
- Jaiswal S, Fontanillas P, Flannick J, Manning A, Grauman PV, Mar BG, Lindsley RC, Mermel CH, Burtt N, Chavez A, et al. Age-related clonal hematopoiesis associated with adverse outcomes. N Engl J Med. 2014;371:2488–2498. doi: 10.1056/NEJMoa1408617. [DOI] [PMC free article] [PubMed] [Google Scholar]
- Jeromin S, Weissmann S, Haferlach C, Dicker F, Bayer K, Grossmann V, Alpermann T, Roller A, Kohlmann A, Haferlach T, et al. SF3B1 mutations correlated to cytogenetics and mutations in NOTCH1, FBXW7, MYD88, XPO1 and TP53 in 1160 untreated CLL patients. Leukemia. 2014;28:108–117. doi: 10.1038/leu.2013.263. [DOI] [PubMed] [Google Scholar]
- Kesarwani AK, Ramirez O, Gupta AK, Yang X, Murthy T, Minella AC, Pillai M. Cancer-associated SF3B1 mutants recognize otherwise inaccessible cryptic 3’ splice sites within RNA secondary structures. Oncogene. 2016;279:1–11. doi: 10.1038/onc.2016.279. [DOI] [PMC free article] [PubMed] [Google Scholar]
- Kharchenko PV, Silberstein L, Scadden DT. Bayesian approach to single-cell differential expression analysis. Nat Methods. 2014;11:740–742. doi: 10.1038/nmeth.2967. [DOI] [PMC free article] [PubMed] [Google Scholar]
- Kim E, Ilagan JO, Liang Y, Daubner GM, Lee SC, Ramakrishnan A, Li Y, Chung YR, Micol JB, Murphy ME, et al. SRSF2 Mutations Contribute to Myelodysplasia by Mutant-Specific Effects on Exon Recognition. Cancer Cell. 2015;27:617–630. doi: 10.1016/j.ccell.2015.04.006. [DOI] [PMC free article] [PubMed] [Google Scholar]
- Landau D, Wang L, Wu CJ. Locally disordered methylation forms the basis of intra-tumor methylome variation in chronic lymphocytic leukemia. Cancer Cell. 2014;26:813–825. doi: 10.1016/j.ccell.2014.10.012. [DOI] [PMC free article] [PubMed] [Google Scholar]
- Landau DA, Carter SL, Stojanov P, McKenna A, Stevenson K, Lawrence MS, Sougnez C, Stewart C, Sivachenko A, Wang L, et al. Evolution and impact of subclonal mutations in chronic lymphocytic leukemia. Cell. 2013;152:714–726. doi: 10.1016/j.cell.2013.01.019. [DOI] [PMC free article] [PubMed] [Google Scholar]
- Landau DA, Tausch E, Taylor-Weiner AN, Stewart C, Reiter JG, Bahlo J, Kluth S, Bozic I, Lawrence M, Bottcher S, et al. Mutations driving CLL and their evolution in progression and relapse. Nature. 2015;526:525–530. doi: 10.1038/nature15395. [DOI] [PMC free article] [PubMed] [Google Scholar]
- Levin JZ, Yassour M, Adiconis X, Nusbaum C, Thompson DA, Friedman N, Gnirke A, Regev A. Comprehensive comparative analysis of strand-specific RNA sequencing methods. Nat Methods. 2010;7:709–715. doi: 10.1038/nmeth.1491. [DOI] [PMC free article] [PubMed] [Google Scholar]
- Love MI, Huber W, Anders S. Moderated estimation of fold change and dispersion for RNA-seq data with DESeq2. Genome Biol. 2014;15:550. doi: 10.1186/s13059-014-0550-8. [DOI] [PMC free article] [PubMed] [Google Scholar]
- Lu H, Hu L, Li T, Lahiri S, Shen C, Wason MS, Mukherjee D, Xie H, Yu L, Zhao J. A novel role of Kruppel-like factor 8 in DNA repair in breast cancer cells. J Biol Chem. 2012;287:43720–43729. doi: 10.1074/jbc.M112.418053. [DOI] [PMC free article] [PubMed] [Google Scholar]
- Mercer TR, Clark MB, Andersen SB, Brunck ME, Haerty W, Crawford J, Taft RJ, Nielsen LK, Dinger ME, Mattick JS. Genome-wide discovery of human splicing branchpoints. Genome Res. 2015;25:290–303. doi: 10.1101/gr.182899.114. [DOI] [PMC free article] [PubMed] [Google Scholar]
- Minoguchi S, Taniguchi Y, Kato H, Okazaki T, Strobl LJ, Zimber-Strobl U, Bornkamm GW, Honjo T. RBP-L, a transcription factor related to RBP-Jkappa. Mol Cell Biol. 1997;17:2679–2687. doi: 10.1128/mcb.17.5.2679. [DOI] [PMC free article] [PubMed] [Google Scholar]
- Park SM, Ou J, Chamberlain L, Simone TM, Yang H, Virbasius CM, Ali AM, Zhu LJ, Mukherjee S, Raza A, Green MR. U2AF35(S34F) Promotes Transformation by Directing Aberrant ATG7 Pre-mRNA 3’ End Formation. Molecular cell. 2016;62:479–490. doi: 10.1016/j.molcel.2016.04.011. [DOI] [PMC free article] [PubMed] [Google Scholar]
- Puente XS, Bea S, Valdes-Mas R, Villamor N, Gutierrez-Abril J, Martin-Subero JI, Munar M, Rubio-Perez C, Jares P, Aymerich M, et al. Non-coding recurrent mutations in chronic lymphocytic leukaemia. Nature. 2015;526:519–524. doi: 10.1038/nature14666. [DOI] [PubMed] [Google Scholar]
- Puente XS, Pinyol M, Quesada V, Conde L, Ordonez GR, Villamor N, Escaramis G, Jares P, Bea S, Gonzalez-Diaz M, et al. Whole-genome sequencing identifies recurrent mutations in chronic lymphocytic leukaemia. Nature. 2011;475:101–105. doi: 10.1038/nature10113. [DOI] [PMC free article] [PubMed] [Google Scholar]
- Quesada V, Conde L, Villamor N, Ordonez GR, Jares P, Bassaganyas L, Ramsay AJ, Bea S, Pinyol M, Martinez-Trillos A, et al. Exome sequencing identifies recurrent mutations of the splicing factor SF3B1 gene in chronic lymphocytic leukemia. Nat Genet. 2012;44:47–52. doi: 10.1038/ng.1032. [DOI] [PubMed] [Google Scholar]
- Rosati E, Sabatini R, Rampino G, Tabilio A, Di Ianni M, Fettucciari K, Bartoli A, Coaccioli S, Screpanti I, Marconi P. Constitutively activated Notch signaling is involved in survival and apoptosis resistance of B-CLL cells. Blood. 2009;113:856–865. doi: 10.1182/blood-2008-02-139725. [DOI] [PubMed] [Google Scholar]
- Rossi D, Bruscaggin A, Spina V, Rasi S, Khiabanian H, Messina M, Fangazio M, Vaisitti T, Monti S, Chiaretti S, et al. Mutations of the SF3B1 splicing factor in chronic lymphocytic leukemia: association with progression and fludarabine-refractoriness. Blood. 2011;118:6904–6908. doi: 10.1182/blood-2011-08-373159. [DOI] [PMC free article] [PubMed] [Google Scholar]
- Shirai CL, Ley JN, White BS, Kim S, Tibbitts J, Shao J, Ndonwi M, Wadugu B, Duncavage EJ, Okeyo-Owuor T, et al. Mutant U2AF1 Expression Alters Hematopoiesis and Pre-mRNA Splicing In Vivo. Cancer Cell. 2015;27:631–643. doi: 10.1016/j.ccell.2015.04.008. [DOI] [PMC free article] [PubMed] [Google Scholar]
- Taggart AJ, DeSimone AM, Shih JS, Filloux ME, Fairbrother WG. Large-scale mapping of branchpoints in human pre-mRNA transcripts in vivo. Nat Struct Mol Biol. 2012;19:719–721. doi: 10.1038/nsmb.2327. [DOI] [PMC free article] [PubMed] [Google Scholar]
- Te Raa GD, Derks IA, Navrkalova V, Skowronska A, Moerland PD, van Laar J, Oldreive C, Monsuur H, Trbusek M, Malcikova J, et al. The impact of SF3B1 mutations in CLL on the DNA-damage response. Leukemia. 2015;29:1133–1142. doi: 10.1038/leu.2014.318. [DOI] [PubMed] [Google Scholar]
- Wang C, Chua K, Seghezzi W, Lees E, Gozani O, Reed R. Phosphorylation of spliceosomal protein SAP 155 coupled with splicing catalysis. Genes Dev. 1998;12:1409–1414. doi: 10.1101/gad.12.10.1409. [DOI] [PMC free article] [PubMed] [Google Scholar]
- Wang L, Lawrence MS, Wan Y, Stojanov P, Sougnez C, Stevenson K, Werner L, Sivachenko A, DeLuca DS, Zhang L, et al. SF3B1 and other novel cancer genes in chronic lymphocytic leukemia. N Engl J Med. 2011;365:2497–2506. doi: 10.1056/NEJMoa1109016. [DOI] [PMC free article] [PubMed] [Google Scholar]
- Wang X, Zhao J. KLF8 transcription factor participates in oncogenic transformation. Oncogene. 2007;26:456–461. doi: 10.1038/sj.onc.1209796. [DOI] [PubMed] [Google Scholar]
- Xie M, Lu C, Wang J, McLellan MD, Johnson KJ, Wendl MC, McMichael JF, Schmidt HK, Yellapantula V, Miller CA, et al. Age-related mutations associated with clonal hematopoietic expansion and malignancies. Nat Med. 2014;20:1472–1478. doi: 10.1038/nm.3733. [DOI] [PMC free article] [PubMed] [Google Scholar]
- Zhang J, Lieu YK, Ali AM, Penson A, Reggio KS, Rabadan R, Raza A, Mukherjee S, Manley JL. Disease-associated mutation in SRSF2 misregulates splicing by altering RNA-binding affinities. Proc Natl Acad Sci U S A. 2015;112:E4726–E4734. doi: 10.1073/pnas.1514105112. [DOI] [PMC free article] [PubMed] [Google Scholar]
- Zweidler-McKay PA, He Y, Xu L, Rodriguez CG, Karnell FG, Carpenter AC, Aster JC, Allman D, Pear WS. Notch signaling is a potent inducer of growth arrest and apoptosis in a wide range of B-cell malignancies. Blood. 2005;106:3898–3906. doi: 10.1182/blood-2005-01-0355. [DOI] [PMC free article] [PubMed] [Google Scholar]
Associated Data
This section collects any data citations, data availability statements, or supplementary materials included in this article.