Abstract
Type 2 diabetes mellitus (DM) is a major risk factor for the development of active pulmonary tuberculosis (PTB), with development of DM pandemic in countries where tuberculosis (TB) is also endemic. However, the effect of anti-TB treatment on the changes in dentritic cell (DC) and monocyte subset phenotype in TB-DM co-morbidity is not well understood. In this study, we characterized the frequency of DC and monocyte subsets in individuals with PTB with (PTB-DM) or without coincident diabetes mellitus (PTB-NDM) before, during and after completion of anti-TB treatment. PTB-DM is characterized by diminished frequencies of plasmacytoid and myeloid DCs and classical and intermediate monocytes at baseline and 2 months of anti-TB treatment but not following 6 months of treatment completion in comparison to PTB-NDM. DC and monocyte subsets exhibit significant but borderline correlation with fasting blood glucose and glycated hemoglobin levels. Finally, while minor changes in the DC and monocyte compartment were observed at 2 months of treatment, significantly increased frequencies of plasmacytoid and myeloid DCs and classical and intermediate monocytes were observed at the successful completion of anti-TB treatment. Our data show that coincident diabetes alters the frequencies of innate subset distribution of DC and monocytes in TB-DM co-morbidity and suggests that most of these changes are reversible following anti-TB therapy.
Introduction
Type 2 diabetes mellitus (DM) and pulmonary TB (PTB) are two of the most common co-morbid conditions in many parts of the world, and the union of these diseases poses a serious threat to global health. A variety of clinical and epidemiologic studies have identified that DM triples the risk for the development of active TB [1] and increases the chance of adverse TB treatment outcomes such as failure, death and relapse [2]. Global diabetes prevalence was estimated to be 382 million in 2013 and it is anticipated to reach 292 million in 2035 [22]. Interestingly the potential impact of a rising epidemic of PTB-DM comorbidity reveals a geographical overlap with approximately 80% of people with diabetes living in areas where TB is also endemic [23]. DM is associated with a greater severity of TB disease among the diseased population with harmful effects on both disease presentation and response to treatment [2, 3].
We have previously demonstrated that PTB-DM co-morbidity is characterized by significantly diminished frequencies of plasmacytoid and myeloid DCs and classical and intermediate monocytes at baseline and that DM appears to influence both the phenotype and function of DC and monocytes in Mycobacterium tuberculosis infection and pulmonary TB disease [4]. In this study, we characterized the frequencies of DC and monocyte subsets at baseline and at two time points following beginning of treatment: 2 months, which denotes the end of the intensive phase and 6 months, which denotes the completion of treatment. Our data reveal that DM differentially modulates the ex vivo phenotype of DC and monocyte subsets in PTB individuals before, during and after the completion of anti-TB treatment.
Materials and Methods
Study Population
We studied a group of 57 individuals with PTB: 30 individuals with DM and 27 without DM. These individuals were part of individuals enrolled for the "Effects of Diabetes on Tuberculosis Severity" study presently underway at the Prof. M. Viswanathan Diabetes Research Center and the National Institute for Research in Tuberculosis [5]. All individuals were examined as part of a natural history study protocol approved by the Ethics Committees of the Prof. M. Viswanathan Diabetes Research Center and NIRT. Informed consent was obtained from all participants. The baseline demographic, biochemical and hematological characteristics of the study population have been previously described [6]. PTB was diagnosed on the basis of sputum smear and culture positivity. DM was diagnosed on the basis of oral glucose tolerance test and/or glycated hemoglobin (HbA1c) levels (for known diabetics), according to the WHO criteria. All the individuals were HIV seronegative and anti-tuberculous treatment naïve. Anthropometric measurements and hematological and biochemical parameters were obtained by standardized techniques detailed elsewhere [6]. All individuals had pan-sensitive Mycobacterium tuberculosis on sputum culture at enrollment and all received standard Directly Observed Treatment Short Course (DOTS) with isoniazid, rifampicin, pyrazinamide and ethambutol for 2 months, followed by isoniazid and rifampicin for 4 months). All individuals were smear and culture negative at the end of 6 months of therapy (Table 1). Blood samples were collected at baseline, 2 months and 6 months post-treatment initiation.
Table 1.
Demographics of study individuals
| Study Demographics | Baseline (Before treatment) | Post Rx 1 (2nd Month) |
Post Rx 2 (6th Month) |
||||
|---|---|---|---|---|---|---|---|
| PTB Diabetes |
PTB Non- diabetes |
pValue | PTB Diabetes |
PTB Non- diabetes |
PTB Diabetes |
PTB Non- diabetes |
|
|
No. of subjects recruited |
30 | 27 | - | 30 | 27 | 30 | 27 |
|
Gender (Male / Female) |
23/7 | 24/3 | - | - | - | - | - |
| Median Age (Range) | 48 (25 – 70) | 40 (25 – 67) | p=0.0581 | - | - | - | - |
| Median Height, cm | 159 (133 – 169) |
162 (140 – 184) |
p=0.2121 | - | - | - | - |
| Median Weight, kg | 52 (32 – 67) | 46 (30 – 90) | p=0.2484 | - | - | - | - |
|
Smear Grade: 0/1+/2+/3+ |
0/16/9/5 | 0/16/6/5 | - | 17/11/2/0 | 24/3/0/0 | Negative | Negative |
|
Culture Results: Negative/1+/2+/3+ |
0/10/5/15 | 0/12/6/9 | - | 26/1/1/2 | 24/2/1/0 | Negative | Negative |
The values represent geometric means and range.
Ex vivo analysis
All antibodies used in the study were from BD Biosciences (San Jose, CA), BD Pharmingen (San Diego, CA), Biolegend (San Diego, CA). Whole blood was used for ex vivo phenotyping and it was performed on all 57 individuals. Briefly, to 250µl aliquots of whole blood was added a cocktail of monoclonal antibodies specific for various immune cell types. Phenotyping of DC subsets was performed using antibodies directed against HLADR PerCP (clone: L243; BD) lineage cocktail (CD3, CD14, CD16, CD19, CD20, CD56) FITC (clone SJ25C1, SK7, MΦp9, L27, NCAM16.2, 3G8 BD) CD123-PE (clone 9F5; BD) CD11c-APC (clone S-HCL-3; BD). Plasmacytoid DCs were classified as (Lin− HLA-DR+ CD123+) and myeloid DCs as (Lin− HLA-DR+ CD11c+). Monocyte phenotyping was performed using antibodies directed against CD45-PerCP (clone 2D1; BD), CD14-Pacific Blue (clone M5E2; Biolegend) HLA-DR-PE-Cy7 (clone L243; BD) and CD16-APCCy7 (clone 3G8; BD). Classical monocytes were classified as CD45+ HLA-DR+ CD14hiCD16−; intermediate monocytes as CD45+ HLA-DR+ CD14hi CD16dim and non-classical monocytes were classified as CD45+HLADR+ CD14dimCD16hi [7]. Following 30 min of incubation at room temperature erythrocytes were lysed using 2 ml of FACS lysing solution (BD Biosciences Pharmingen), and cells were washed twice with 2 ml of 1× PBS and suspended in 200µl of PBS (Lonza, Walkersville, MD). Eight colour flow cytometry was performed on a FACSCanto II flow cytometer with FACSDIVA software, version 6 (BD). The gating was set by forward and side scatter, and 100,000 gated events were acquired. Data were collected and analysed using FLOW JO software (TreeStar, Ashland, OR). A representative flow cytometry plot showing the gating strategies for DC and monocyte subsets is shown in the Supplementary material (Fig. S1).
Statistical analysis
Geometric means were used for measurements of central tendency. Comparisons were made using the Mann–Whitney U-test with Holm’s correction for multiple comparisons. Wilcoxon signed rank test and correlations with the Spearman Rank test. Analyses were performed using GRAPHPAD PRISM Version 6 (GraphPad, San Diego, CA).
Results
Biochemical and haematological features of the study population
No significant differences in age or gender were observed between the respective groups. PTB-DM individuals exhibited significantly higher levels of fasting and postprandial glucose, HbA1c, serum triglycerides, total cholesterol, low-density lipoprotein and very-low-density lipoprotein cholesterol (Table 2). They also exhibited significantly higher levels of total bilirubin but not other biochemical parameters (Table 2). Finally, PTB-DM individuals exhibited no significant difference in haematological parameters, with the exception of absolute neutrophil counts, which were significantly higher (Table 3).
Table 2.
Baseline biochemical parameters of study individuals
| Study Demographics | Baseline (Before treatment) | pValue | Post Treatment (6th Month) |
pValue | ||
|---|---|---|---|---|---|---|
| PTB Diabetes | PTB Non- diabetes |
PTB Diabetes |
PTB Non- diabetes |
|||
| Fasting Blood Glucose, mg/dL | 120 (98–293) | 90 (68–101) | p<0.0001 | |||
| Post Prandial Glucose, mg/dL | 257 (203–448) | 119 (76–137) | p<0.0001 | |||
| Glycated hemoglobin level, % | 9.3 (6.6 – 14.6) | 5.6 (5.0 – 5.9) | p<0.0001 | 8.8 (5.2 – 17.7) |
5.4 (4.6 – 6.1) |
p<0.0001 |
| Serum Triglycerides, mg/dL | 107 (66 – 178) | 76 (39 – 113) | p<0.0001 | |||
| Total Cholesterol, mg/dL | 182 (110 – 294) |
162 (86 – 182) | p=0.0298 | |||
| HDL Cholesterol, mg/dL | 37 (22 – 58) | 35 (19 – 69) | p=0.6957 | |||
| LDL Cholesterol, mg/dL | 95 (51 – 162) | 83 (49 – 107) | p=0.0204 | |||
| VLDL Cholesterol, mg/dL | 44 (18 – 76) | 36 (15 – 48) | p=0.0039 | |||
| Urea, mg/dL | 18 (7 – 30) | 16 (9 – 25) | p=0.8982 | |||
| Creatinine, mg/dL | 0.85 (0.6 – 1.0) | 0.8 (0.6 – 1.2) | p=0.2241 | |||
| Total Bilirubin, mg/dL | 0.5 (0.3 – 1.2) | 0.3 (0.1 – 0.7) | p=0.0282 | |||
| Total Protein, g/dL | 8.2 (6.3 – 9.0) | 8.2 (7.1 – 9.7) | p=0.8132 | |||
| Serum Albumin, g/dL | 4.1 (2.5 – 4.6) | 4.1 (3.1 – 5.1) | p=0.5735 | |||
| Serum Globulins, g/dL | 4 (3.2 – 5.1) | 4.3 (3.2 – 5.0) | p=0.4264 | |||
| SGOT, U/l | 15 (6 – 31) | 18 (10 – 48) | p=0.2059 | |||
| SGPT, U/l | 17 (6 – 57) | 14 (8 – 43) | p=0.5636 | |||
| Alkaline Phosphatase, U/l | 278 (162 – 499) |
235 (159 – 624) | p=0.0562 | |||
| Vitamine D3, ng/ml | 18 (3.1 – 48) | 16 (3 – 49) | p=0.2241 | |||
The values represent geometric means and range.
Table 3.
Baseline haematological parameters of study individuals
| Hematology profile | PTB-DM | PTB-NDM | pValue |
|---|---|---|---|
|
Red blood cell count, ×106 cells/µl |
4.9 (3.7–6.2) | 4.6(3–6.2) | NS |
|
White blood cell count, ×103 cells/µl |
9800(6300– 14700) |
8300(5200– 18700) |
NS |
| Lymphocyte count, cells/mL | 1775(1008–2940) | 1820(884–3071) | NS |
| Neutrophil count, cells/mL | 6525(3484– 10496) |
5698(3348– 14586) |
p=0.0408 |
| Monocyte count, cells/mL | 870(252–1414) | 803(102–1870) | NS |
| Eosinophil count, cells/mL | 189(87–819) | 296(73–913) | NS |
| Platelet count, ×103 platelets/µl | 342(215–591) | 378(131–676) | NS |
The values represent geometric means and range.
PTB-DM is associated with diminished percentages of plasmacytoid and myeloid dendritic cells
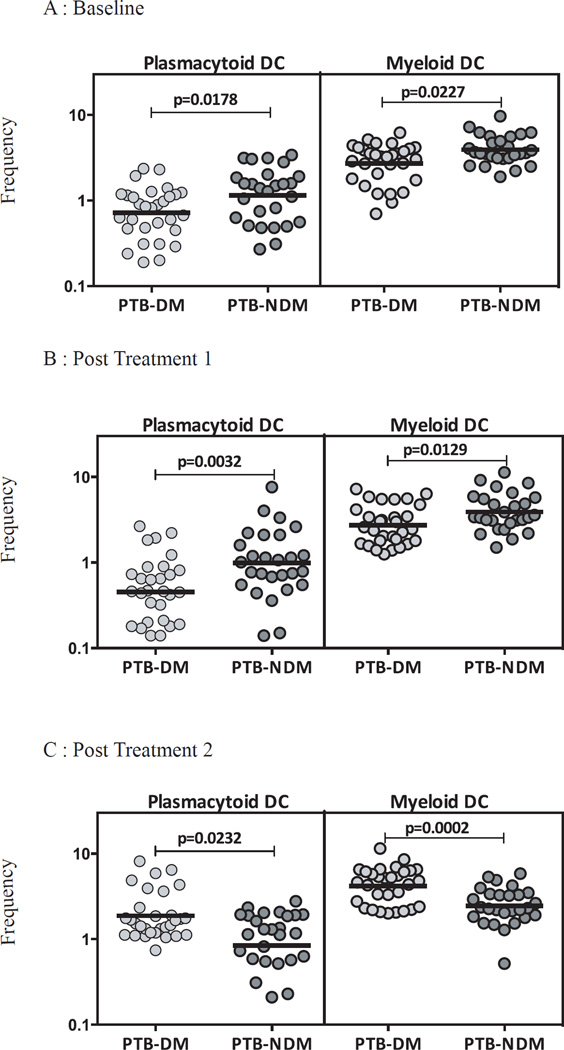
To study the influence of DM on DC subset homeostasis in PTB, we examined the ex vivo percentages of DC subsets in PTB-DM and PTB-NDM individuals at baseline and at two and six months following anti-TB therapy. As shown in Figure 1A, PTB-DM is characterized by decreased percentages of plasmacytoid and myeloid DCs before treatment in comparison to PTB-NDM individuals. Similarly, at 2 months following initiation of treatment, PTB-DM is characterized by decreased percentages of plasmacytoid and myeloid DCs (Figure 1B). In contrast, the percentage of plasmacytoid and myeloid DCs were significantly increased in PTB-DM compared to PTB-NDM at 6 months of treatment (Figure 1C). Therefore, DM is associated with alterations in the subset distribution of DCs in PTB before, during and after treatment.
Figure 1. PTB-DM is associated with altered frequencies of DC subsets at baseline and following treatment.
The frequencies of DC subsets in PTB-DM (n=30) and PTBNDM (n=27) individuals at baseline (A) and at two (B) and six (C) months following treatment. The data are represented as scatter plots with each circle representing a single individual. P values were calculated using the Mann-Whitney test.
PTB-DM is associated with diminished percentages of classical and intermediate monocyte subsets
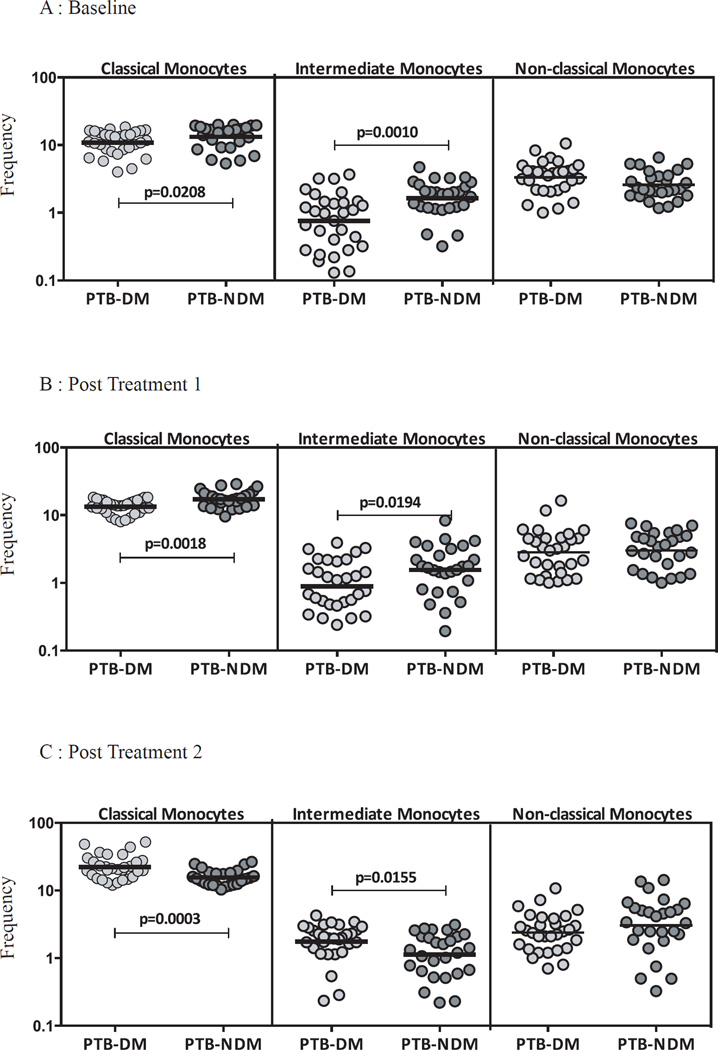
To study the influence of DM on monocyte subset homeostasis in PTB, we examined the ex vivo percentages of monocyte subsets in PTB-DM and PTB-NDM individuals at baseline and at two and six months following anti-TB therapy. As shown in Figure 2A, PTB-DM is characterized by decreased percentages of classical and intermediate monocytes and no significant differences in non-classical monocytes before treatment in comparison to PTB-NDM individuals. Similarly, at 2 months following initiation of treatment, PTB-DM is characterized by decreased percentages of classical and intermediate monocytes and no significant differences in non-classical monocytes (Figure 2B). In contrast, the percentages of classical and intermediate monocytes were significantly increased in PTB-DM compared to PTB-NDM at 6 months of treatment (Figure 2C). Therefore, DM is associated with alterations in the subset distribution of monocytes in PTB before, during and after treatment.
Figure 2. PTB-DM is associated with altered frequencies of monocyte subsets at baseline and following treatment.
The frequencies of monocyte subsets in PTB-DM (n=30) and PTB-NDM (n=27) individuals at baseline (A) and at two (B) and six (C) months following treatment. The data are represented as scatter plots with each circle representing a single individual. P values were calculated using the Mann-Whitney test.
DC subsets exhibit a borderline negative relationship with hyperglycemia but not with sputum smear status in PTB
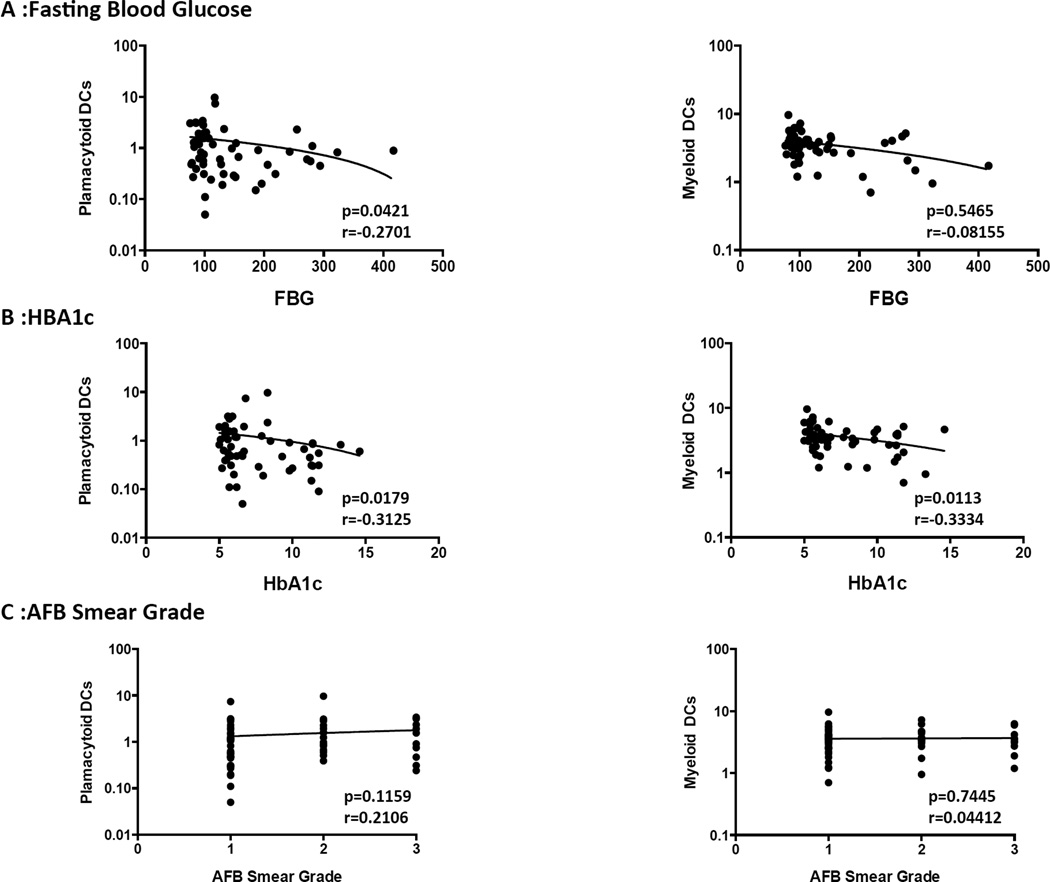
To determine the influence of hyperglycemia on DC subset distribution in PTB, we examined the correlation between DC subsets and fasting blood glucose or HbA1c levels in all PTB individuals (with or without DM). As shown in Figure 3A, plasmacytoid DCs exhibited a borderline negative correlation with fasting blood glucose levels. Similarly, as shown in Figure 3B, plasmacytoid and myeloid DCs exhibited a borderline negative correlation with HbA1c. To determine the influence of bacterial burdens on DC subset distribution in PTB, we also examined the relationship between DC subsets and bacterial smear grades, classified as 1+, 2+ and 3+. As shown in Figure 3C, the percentages of DCs subsets exhibited no significant correlation with bacterial smear grades in PTB individuals with or without DM.
Figure 3. Relationship between DC subsets and hyperglycemia or bacterial burdens in PTB individuals.
(A) The correlation between the frequencies of DC subsets and fasting blood glucose levels at baseline in all individuals. (B) The correlation between the frequencies of DC subsets and HbA1c levels at baseline in all individuals. (C) The correlation between the frequencies of DC subsets and bacterial burdens as determined by smear grades (1+, 2+ or 3+) in all individuals. The data are represented as scatter plots with each circle representing a single individual. P values were calculated using the Spearman Rank correlation
Monocyte subsets exhibit a borderline negative relationship with hyperglycemia but not with sputum smear status in PTB
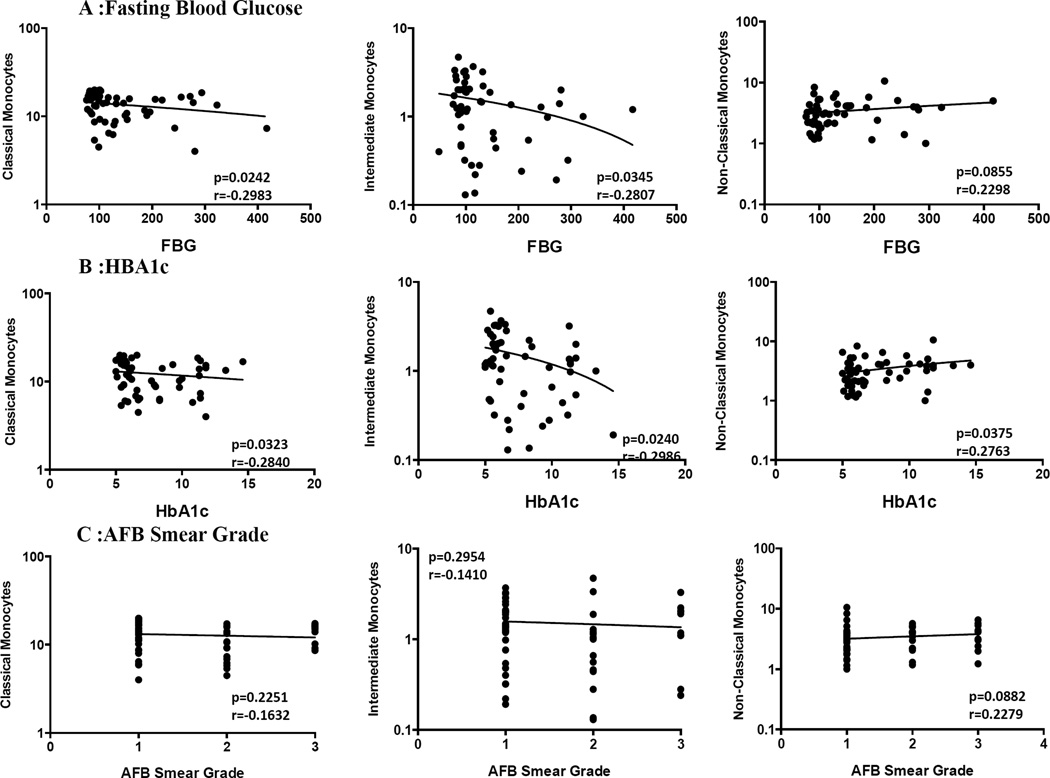
To determine the influence of hyperglycemia on monocyte subset distribution in PTB, we examined the correlation between monocyte subsets and fasting blood glucose or HbA1c levels in all PTB (with or without DM) individuals. As shown in Figure 4A, classical and intermediate monocyte subsets exhibited a borderline negative correlation with fasting blood glucose levels. Similarly, as shown in Figure 4B, classical and intermediate monocyte subsets exhibited a borderline negative correlation with HbA1c, while in contrast, non-classical monocytes exhibited a positive correlation with HbA1c. To determine the influence of bacterial burdens on monocyte subset distribution in PTB, we also examined the relationship between monocyte subsets and bacterial smear grades, classified as 1+, 2+ and 3+. However, as shown in Figure 4C, the percentages of monocyte subsets exhibited no significant correlation with bacterial smear grades in PTB individuals with or without DM.
Figure 4. Relationship between monocyte cell subsets and hyperglycemia or bacterial burdens in PTB individuals.
(A) The correlation between the frequencies of monocyte subsets and fasting blood glucose levels at baseline in all individuals. (B) The correlation between the frequencies of monocyte subsets and HbA1c levels at baseline in all individuals. (C) The correlation between the frequencies of monocyte subsets and bacterial burdens as determined by smear grades (1+, 2+ or 3+) in all individuals. The data are represented as scatter plots with each circle representing a single individual. P values were calculated using the Spearman Rank correlation.
Treatment-induced changes in DC subsets in PTB-DM individuals
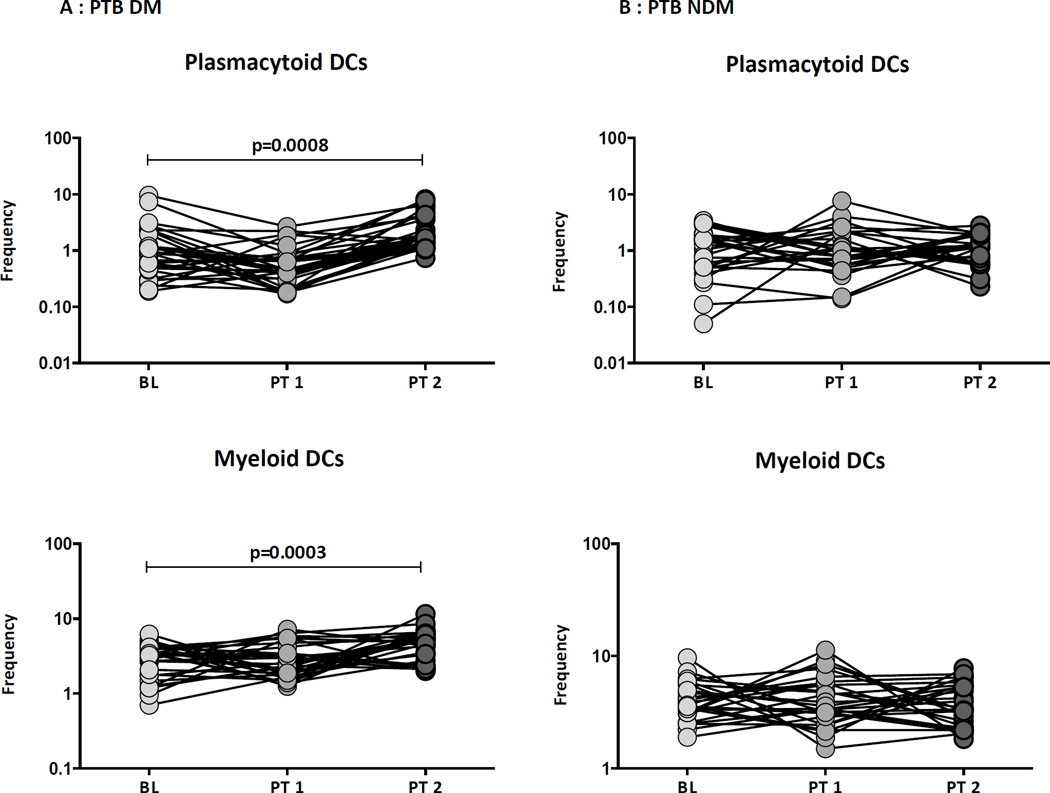
Alterations in DC subsets following treatment in PTB individuals has not been well described. Therefore, to elucidate the impact of treatment on the ex vivo phenotype of DC subsets in PTB-DM and PTB-NDM individuals, we examined the percentages of DC subsets before and at 2 months and 6 months following initiation of treatment. As shown in Figure 5A, PTB-DM individuals exhibited no significant differences in the percentages of DC subsets at 2 months following treatment. However, they exhibited a significant increase in the percentages of plamacytoid and myeloid DCs at the completion of treatment (6 months). In contrast, as shown in Figure 5B, PTB-NDM individuals no significant differences in the percentages of DC subsets, at 2 months and 6 month following treatment. Thus, the alterations in the percentages of DC subsets in PTB-DM individuals are reversed by anti-TB treatment.
Figure 5. Treatment induced alterations in dendritic cell subsets in PTB individuals.
The frequencies of DC subsets in (A) PTB- DM and (B) PTB-NDM individuals before and at 2 and 6 months following anti-TB treatment. The data are represented as line diagrams with each line representing a single individual. P values were calculated using the Wilcoxon signed rank test.
Treatment induced changes in monocyte subsets in PTB-DM individuals
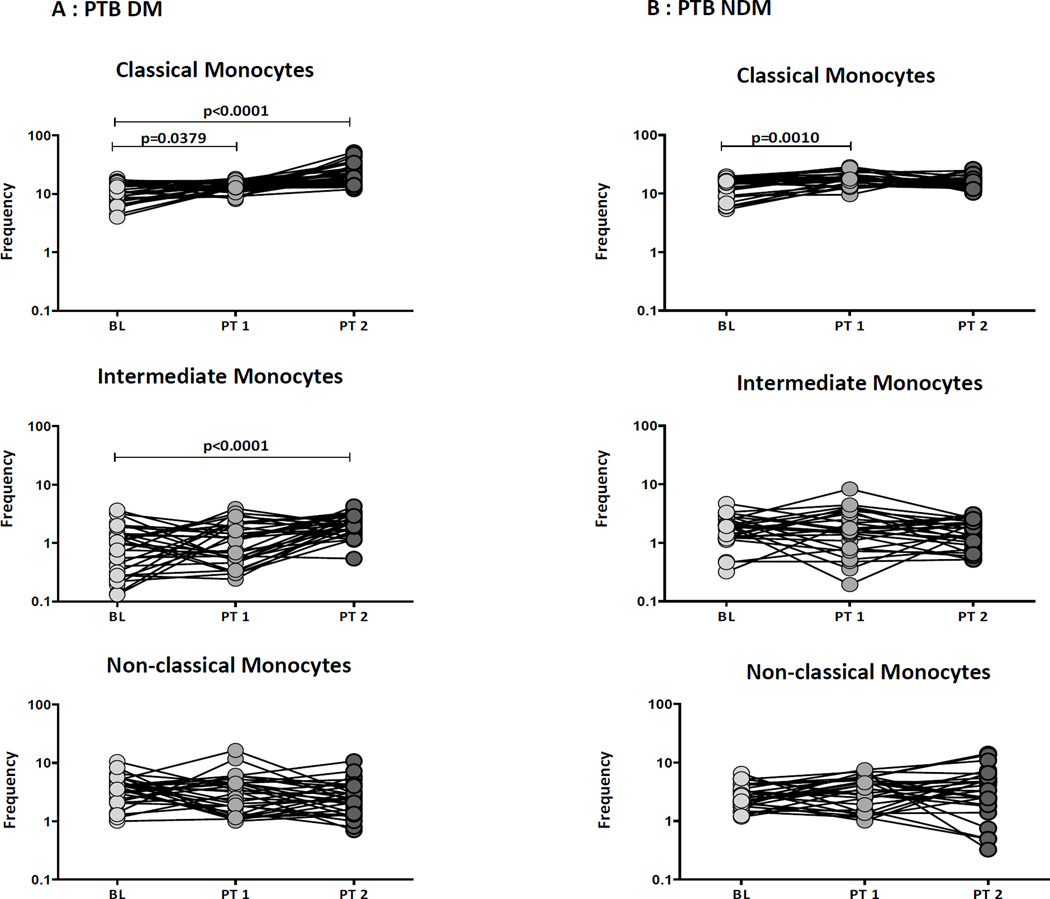
Alterations in monocyte subsets following treatment in PTB individuals has not been well described. Therefore, to elucidate the impact of treatment on the ex vivo phenotype of monocyte subsets in PTB-DM and PTB-NDM individuals, we examined the percentages of monocyte subsets before and at 2 months and 6 months following initiation of treatment. As shown in Figure 6A, PTB –DM individuals exhibited a significant increase in the percentages of classical monocytes but not intermediate and non-classical monocytes at 2 months following treatment. In addition, they exhibited a significant increase in the percentages of classical and intermediate monocytes at the completion of treatment (6 months). In contrast, as shown in Figure 6B, PTB-NDM individuals exhibited no significant differences in the percentages of monocyte subsets at 2 months and 6 month following treatment. Thus, the alterations in the percentages of monocyte subsets in PTB-DM individuals are reversed by anti-TB treatment.
Figure 6. Treatment induced alterations in monocyte subsets in PTB individuals.
The frequencies of monocyte subsets in in (A) PTB- DM and (B) PTB-NDM individuals before and at 2 and 6 months following anti-TB treatment. The data are represented as line diagrams with each line representing a single individual. P values were calculated using the Wilcoxon signed rank test.
Discussion
Diabetes is a major acquired TB susceptibility factor, particularly in Asian countries where its prevalence is rising [8]. Comorbid DM increases the risk to develop active TB and adversely affects TB treatment response and disease outcomes [3]. The immunological basis for susceptibility to TB among those with DM is not well understood. One probable mechanism is that a compromised immune response in diabetic patients accelerates either initial infection with M. tuberculosis or reactivation of latent tuberculosis [3]. Studies examining the innate and adaptive immune response to microbial antigens in diabetic patients propose that these responses are compromised, particularly in patients with chronic hyperglycemia [9–11]. Whether this applies to tuberculosis infection remains unclear. In addition DM can also significantly modulate cells of the innate and adaptive immune system, most particularly monocytes/macrophages and neutrophils [10]. However, the role of DC and monocyte subsets in DM with coincident TB has not been explored in detail. Our study is the first study, to our knowledge to explore the ex vivo phenotype of DC and monocyte subsets in TB-DM comorbidity after successful completion of standard anti-TB treatment.
Dendritic cells are one of the important cells in linking innate and adaptive immune response through their role in capturing, processing and presenting antigens. Circulating blood DCs have been classified as HLADR+ cells (but negative for lineage-specific markers) and are differentiated into cells of the myeloid lineage (CD11c+) or the plasmacytoid lineage (CD123+) [7]. Studies have shown that migration of DC to the draining lymph node is required for the activation of naïve T cells in TB infection [12] and that at the commencement of the infection, DCs are highly represented at sites of M. tuberculosis infection [13, 14]. Characterizing the role of these subsets in active TB shows that co-operation between M. tuberculosis infected myeloid DCs and plasmacytoid DCs favors the stimulation of CD4+ T cells [15]. In addition, the association between these subsets is also known to support antibacterial activity and CD8+ T-cell stimulation [16]. Thus it is clear that DC subsets play a crucial role in the immune responses to TB. We previously demonstrated that pulmonary TB profoundly alters the frequencies of DC subsets and that DM resulted in significantly lower frequencies of myeloid and plasmacytoid dendritic cells in PTB, LTB and NTB individuals [4]; however, no longitudinal studies on the progression of the DC subsets in TB-DM comorbidity have been reported.
Our findings reveal three major features of DC subsets by ex vivo phenotyping of PTB-DM patients. First, plasmacytoid and myeloid DC are significantly decreased in percentage in PTB-DM compared to PTB-NDM individuals. Secondly, the frequencies of DC subsets negatively correlated (although the correlation was only borderline significant) with hyperglycemia in the presence of active TB but not with bacterial burden as estimated by sputum smear grade. Finally, the frequencies of DC subsets were significantly diminished in PTB-DM at baseline but they demonstrate reversal upon standard TB treatment. Thus, hyperglycemia and its associated factors potentially function as the primary influence driving alterations in the frequency of DC subsets in TB. The functional consequences of this altered phenotypic distribution of DC subsets in PTB-DM individuals needs to be further explored. It could reflect differences in subset composition in the maintenance of the DC population in the periphery or differential migration of DC subsets to the site of infection in the presence of co-existent DM. Nevertheless, our data complement the growing body of evidence indicating an effect of hyperglycemia on the homeostatic or infection-driven function of DC subsets in DM.
Monocytes are critical to the innate immune system and play a vital role in numerous inflammatory conditions associated with chronic infections. Human monocyte subpopulations can be classified based on the dichotomous expression of the surface markers CD14 and CD16 into three major subsets: Classical (CD14++CD16−), intermediate (CD14+CD16+) and non-classical (CD14dimCD16+) [17]. Earlier studies have reported that these monocyte subsets have different biological roles in TB infection and disease, [18] with non-classical monocytes being elevated in active TB and correlating with disease severity [19], and classical monocytes contributing to the anti-mycobacterial response and being increased in individuals with latent TB [19]. Circulating monocytes play a crucial role in M. tuberculosis infection by migrating to the lung early in TB infection and differentiating into macrophages for antigen presentation and secretion of cytokines. Therefore it is clear that monocyte subset alterations play a key role in the immune responses to TB. We previously demonstrated that pulmonary TB profoundly alters the frequencies of monocyte subsets and that DM results in significantly lower frequencies of classical and intermediate monocytes subsets in PTB, LTB and NTB individuals [4]. However, no longitudinal studies on the progression of the monocyte subsets in TB-DM co-morbidity have been reported
Our findings clearly reveal that at baseline (before treatment) and early following treatment (2nd month of anti-TB treatment), classical and intermediate monocytes are significantly decreased in percentage in PTB-DM compared to PTB-NDM individuals. Secondly, the diminished frequencies of monocyte subsets negatively correlated (although with borderline significance) with hyperglycemia in the presence of active TB but not with bacterial burden as estimated by sputum smear grade. Finally, the frequencies of monocyte subsets, significantly diminished in PTB-DM before treatment, are shown to undergo reversal upon completion of standard TB treatment. The importance of monocyte subsets in M.tuberculosis infection suggests that functional modifications in these cells in DM patients will contribute to their enhanced susceptibility to TB disease [3]. Previous studies have shown that association of M.tuberculosis with monocytes was significantly lower in diabetics than non-diabetics patients, and poorly-controlled DM were significantly associated with the lower interaction of M.tuberculosis with monocytes [20]. Other immunological studies have reported that monocytes from naïve TB patients with diabetes have a defect in the phagocytic pathways of these cells, which in turn contributing to the greater susceptibility of DM patients to pathogens like M. tuberculosis [21]. Thus, our data reveals that alterations in the monocyte subsets in the presence TB disease and the perturbations of these parameters in the presence of DM co-morbidity could potentially have important implications for the both host immunity and metabolic responses, which needs to be explored further.
Since this was a descriptive study, we are unable to draw any inferences on cause and effect. Our study suffers from the limitations of being descriptive study, having a limited sample size and DC and monocytes subsets also demonstrated only very minimal negative correlation with FBG and HbA1c. However, our results clearly delineate a profound impact of diabetes on the homeostatic DC and monocyte profiles in active TB individuals. Being follow-up study in design, our study also clearly describes the evolution of this phenotype with progression of treatment. Our study also attributes changes in DC and monocyte subsets to potentially contribute to the immune responses in PTB-DM co-morbidity and suggest that this diabetic complication is driven by chronic hyperglycemia.
Supplementary Material
(A) A representative flow cytometry plot from a PTB-DM individual showing the gating strategy for estimation of plasmacytoid and myeloid DCs. Plasmacytoid DC were classified as (Lin− HLA-DR+ CD123+) and myeloid DCs as (Lin− HLA-DR+ CD11c+). (B) A representative flow cytometry plot showing the gating strategy for estimation of monocyte subsets. Classical monocytes were classified as CD45+ HLA-DR+ CD14hiCD16−; intermediate monocytes as CD45+ HLA-DR+ CD14hi CD16dim and non-classical monocytes were classified as CD45+HLADR+ CD14dimCD16hi
Acknowledgments
We thank the staff of Department of Clinical Research and the Department of Bacteriology, NIRT for valuable assistance in bacterial cultures and radiology and the Staff of MVDRC for valuable assistance in recruiting the patients for this study, R. Anuradha, Prabha Chandran, Yukthi Bothra and Gokul Raj of the NIH-ICER for technical assistance. This work was jointly sponsored by the Indian Department of Biotechnology; the Indian Council of Medical Research; and the National Institute for Allergy and Infectious Diseases, National Institutes of Health, and administered by CRDF Global [grant USB1-31149-XX-13]. This work was also funded by the Division of Intramural Research, NIAID, NIH.
Footnotes
Publisher's Disclaimer: This is a PDF file of an unedited manuscript that has been accepted for publication. As a service to our customers we are providing this early version of the manuscript. The manuscript will undergo copyediting, typesetting, and review of the resulting proof before it is published in its final citable form. Please note that during the production process errors may be discovered which could affect the content, and all legal disclaimers that apply to the journal pertain.
Conflict of interest: None reported.
References
- 1.Jeon CY, Murray MB. Diabetes mellitus increases the risk of active tuberculosis: a systematic review of 13 observational studies. PLoS Med. 2008;5(7):e152. doi: 10.1371/journal.pmed.0050152. [DOI] [PMC free article] [PubMed] [Google Scholar]
- 2.Harries AD, Kumar AM, Satyanarayana S, Lin Y, Zachariah R, Lonnroth K, Kapur A. Addressing diabetes mellitus as part of the strategy for ending TB. Trans R Soc Trop Med Hyg. 110(3):173–179. doi: 10.1093/trstmh/trv111. [DOI] [PMC free article] [PubMed] [Google Scholar]
- 3.Baker MA, Harries AD, Jeon CY, et al. The impact of diabetes on tuberculosis treatment outcomes: a systematic review. BMC Med. 9:81. doi: 10.1186/1741-7015-9-81. [DOI] [PMC free article] [PubMed] [Google Scholar]
- 4.Kumar NP, Moideen K, Dhakshinraj SD, Banurekha VV, Nair D, Dolla C, Kumaran P, Babu S. Profiling leucocyte subsets in tuberculosis-diabetes co-morbidity. Immunology. 146(2):243–250. doi: 10.1111/imm.12496. [DOI] [PMC free article] [PubMed] [Google Scholar]
- 5.Kornfeld H, West K, Kane K, Kumpatla S, Zacharias RR, Martinez-Balzano C, Li W, Viswanathan V. High Prevalence and Heterogeneity of Diabetes in Patients With TB in South India: A Report from the Effects of Diabetes on Tuberculosis Severity (EDOTS) Study. Chest. 149(6):1501–1508. doi: 10.1016/j.chest.2016.02.675. [DOI] [PMC free article] [PubMed] [Google Scholar]
- 6.Deepa M, Pradeepa R, Rema M, Mohan A, Deepa R, Shanthirani S, Mohan V. The Chennai Urban Rural Epidemiology Study (CURES)--study design and methodology (urban component) (CURES-I) J Assoc Physicians India. 2003;51:863–870. [PubMed] [Google Scholar]
- 7.Maecker HT, McCoy JP, Nussenblatt R. Standardizing immunophenotyping for the Human Immunology Project. Nat Rev Immunol. 12(3):191–200. doi: 10.1038/nri3158. [DOI] [PMC free article] [PubMed] [Google Scholar]
- 8.Ronacher K, Joosten SA, van Crevel R, Dockrell HM, Walzl G, Ottenhoff TH. Acquired immunodeficiencies and tuberculosis: focus on HIV/AIDS and diabetes mellitus. Immunol Rev. 264(1):121–137. doi: 10.1111/imr.12257. [DOI] [PubMed] [Google Scholar]
- 9.Geerlings SE, Hoepelman AI. Immune dysfunction in patients with diabetes mellitus (DM) FEMS Immunol Med Microbiol. 1999;26(3–4):259–265. doi: 10.1111/j.1574-695X.1999.tb01397.x. [DOI] [PubMed] [Google Scholar]
- 10.Nikolajczyk BS, Jagannathan-Bogdan M, Shin H, Gyurko R. State of the union between metabolism and the immune system in type 2 diabetes. Genes Immun. 12(4):239–250. doi: 10.1038/gene.2011.14. [DOI] [PMC free article] [PubMed] [Google Scholar]
- 11.Pickup JC, Crook MA. Is type II diabetes mellitus a disease of the innate immune system? Diabetologia. 1998;41(10):1241–1248. doi: 10.1007/s001250051058. [DOI] [PubMed] [Google Scholar]
- 12.Khader SA, Partida-Sanchez S, Bell G, et al. Interleukin 12p40 is required for dendritic cell migration and T cell priming after Mycobacterium tuberculosis infection. J Exp Med. 2006;203(7):1805–1815. doi: 10.1084/jem.20052545. [DOI] [PMC free article] [PubMed] [Google Scholar]
- 13.Holt PG, Schon-Hegrad MA. Localization of T cells, macrophages and dendritic cells in rat respiratory tract tissue: implications for immune function studies. Immunology. 1987;62(3):349–356. [PMC free article] [PubMed] [Google Scholar]
- 14.Sertl K, Takemura T, Tschachler E, Ferrans VJ, Kaliner MA, Shevach EM. Dendritic cells with antigen-presenting capability reside in airway epithelium, lung parenchyma, and visceral pleura. J Exp Med. 1986;163(2):436–451. doi: 10.1084/jem.163.2.436. [DOI] [PMC free article] [PubMed] [Google Scholar]
- 15.Cella M, Jarrossay D, Facchetti F, Alebardi O, Nakajima H, Lanzavecchia A, Colonna M. Plasmacytoid monocytes migrate to inflamed lymph nodes and produce large amounts of type I interferon. Nat Med. 1999;5(8):919–923. doi: 10.1038/11360. [DOI] [PubMed] [Google Scholar]
- 16.Lozza L, Farinacci M, Fae K, et al. Crosstalk between human DC subsets promotes antibacterial activity and CD8+ T-cell stimulation in response to bacille Calmette-Guerin. Eur J Immunol. 44(1):80–92. doi: 10.1002/eji.201343797. [DOI] [PMC free article] [PubMed] [Google Scholar]
- 17.Wong KL, Yeap WH, Tai JJ, Ong SM, Dang TM, Wong SC. The three human monocyte subsets: implications for health and disease. Immunol Res. 53(1–3):41–57. doi: 10.1007/s12026-012-8297-3. [DOI] [PubMed] [Google Scholar]
- 18.Balboa L, Barrios-Payan J, Gonzalez-Dominguez E, et al. Diverging biological roles among human monocyte subsets in the context of tuberculosis infection. Clin Sci (Lond) 129(4):319–330. doi: 10.1042/CS20150021. [DOI] [PubMed] [Google Scholar]
- 19.Balboa L, Romero MM, Basile JI, et al. Paradoxical role of CD16+CCR2+CCR5+ monocytes in tuberculosis: efficient APC in pleural effusion but also mark disease severity in blood. J Leukoc Biol. 90(1):69–75. doi: 10.1189/jlb.1010577. [DOI] [PubMed] [Google Scholar]
- 20.Gomez DI, Twahirwa M, Schlesinger LS, Restrepo BI. Reduced Mycobacterium tuberculosis association with monocytes from diabetes patients that have poor glucose control. Tuberculosis (Edinb) 93(2):192–197. doi: 10.1016/j.tube.2012.10.003. [DOI] [PMC free article] [PubMed] [Google Scholar]
- 21.Restrepo BI, Twahirwa M, Rahbar MH, Schlesinger LS. Phagocytosis via complement or Fc-gamma receptors is compromised in monocytes from type 2 diabetes patients with chronic hyperglycemia. PLoS One. 9(3):e92977. doi: 10.1371/journal.pone.0092977. [DOI] [PMC free article] [PubMed] [Google Scholar]
- 22.IDF. IDF Diabetes Atlas, 5th edn. 2012 update. [accessed on 1 December 2012];2012 http://www.eatlasidforg/diabetesatlas/5e/update 2012. [Google Scholar]
- 23.IDF. IDF Diabetes Atlas, 5th Edition, 2012 update. wwweatlasidforg/diabetesatlas/5e/update2012 2012. [Google Scholar]
Associated Data
This section collects any data citations, data availability statements, or supplementary materials included in this article.
Supplementary Materials
(A) A representative flow cytometry plot from a PTB-DM individual showing the gating strategy for estimation of plasmacytoid and myeloid DCs. Plasmacytoid DC were classified as (Lin− HLA-DR+ CD123+) and myeloid DCs as (Lin− HLA-DR+ CD11c+). (B) A representative flow cytometry plot showing the gating strategy for estimation of monocyte subsets. Classical monocytes were classified as CD45+ HLA-DR+ CD14hiCD16−; intermediate monocytes as CD45+ HLA-DR+ CD14hi CD16dim and non-classical monocytes were classified as CD45+HLADR+ CD14dimCD16hi


