Significance
Racial inequality in America persists in part because of racial differences in exposure to adverse neighborhood environments. Blacks in particular are significantly more likely than other Americans to live in high-poverty neighborhoods—neighborhoods characterized by poor schools and limited access to healthcare, jobs, and beneficial social networks—resulting in inequality of opportunity, as life chances are diminished for residents of such neighborhoods. In addition, the greater exposure to crime, noise, and congestion implies a lower quality of life, on average, for black Americans. Because black neighborhood disadvantage results in inequality of life chances based on race, it is important to determine the direction, pace, and sources of change in black–nonblack differences in neighborhood poverty in America.
Keywords: neighborhood poverty, residential segregation, racial inequality, Gini index
Abstract
Black residential segregation has been declining in the United States. That accomplishment rings hollow, however, if blacks continue to live in much poorer neighborhoods than other Americans. This study uses census data for all US metropolitan areas in 1980 and 2010 to compare decline in the neighborhood poverty gap between blacks and other Americans with decline in the residential segregation of blacks. We find that both declines resulted primarily from narrowing differences between blacks and whites as opposed to narrowing differences between blacks and Hispanics or blacks and Asians. Because black–white differences in neighborhood poverty declined much faster than black–white segregation, the neighborhood poverty disadvantage of blacks declined faster than black segregation—a noteworthy finding because the narrowing of the racial gap in neighborhood poverty for blacks has gone largely unnoticed. Further analysis reveals that the narrowing of the gap was produced by change in both the medians and shapes of the distribution of poverty across the neighborhoods where blacks, whites, Hispanics, and Asians reside.
Non-Hispanic blacks (hereafter “blacks”) generally live in poorer neighborhoods than other Americans. In metropolitan areas in 2010, for example, blacks were nearly four times more likely than other residents to live in neighborhoods where the poverty rate was 40% or higher. The racial divide persists even when comparing households of the same income (1). One study finds that the average black household with annual earnings of $75,000 resides in a higher-poverty neighborhood than the average white household with annual earnings of less than $40,000 (2). However, racial differences in neighborhood environments were even greater in the past (3). In this article, we document a significant narrowing of the black–nonblack gap in neighborhood poverty levels since 1980 and compare that decline with the decline in black residential segregation over the same period.
The residential clustering of rich and poor in America is important because of the diminished life chances for residents of high-poverty neighborhoods (4, 5). In addition to more noise and congestion and the absence of green space, high-poverty neighborhoods in America often are characterized by poor schools, reduced access to healthy food, high crime rates, and weak social institutions. Sizable neighborhood inequality is particularly troubling when high neighborhood poverty is associated with race (6). If exposure to poverty adversely affects child development and educational attainment, as recent research suggests (7–11), then disparities in the neighborhood poverty environments of blacks versus more advantaged groups may be an important factor in the persistence of racial inequality across generations (12).
The term “black neighborhood disadvantage” is used in this article as shorthand for the difference in poverty rates of the neighborhoods where blacks and other Americans live. Although black neighborhood disadvantage requires black residential segregation—blacks and nonblacks cannot be unequally distributed across rich and poor neighborhoods unless they are unequally distributed across neighborhoods—the neighborhood disadvantage of blacks need not change at the same rate, or even in the same direction, as black residential segregation. This study compares the two trends and quantifies the contributions of black–white, black–Hispanic, and black–Asian neighborhood change to overall change in the segregation and neighborhood disadvantage of blacks in metropolitan America.
The findings advance our understanding of how racial neighborhood segregation and inequality have been changing in America. By using a common metric for neighborhood segregation and inequality, we show that the neighborhood disadvantage of blacks has declined faster than the neighborhood segregation of blacks, and by applying a decomposition method, we show that black disadvantage declined faster than black segregation primarily because of trends for blacks vis-à-vis whites, as opposed to blacks vis-à-vis Hispanics or Asians. Further analysis reveals that the decline in black neighborhood disadvantage was due to changes in the shapes as well as in the medians of the race-specific neighborhood poverty distributions.
Change in the Neighborhood Poverty Disadvantage of Blacks, 1980–2010
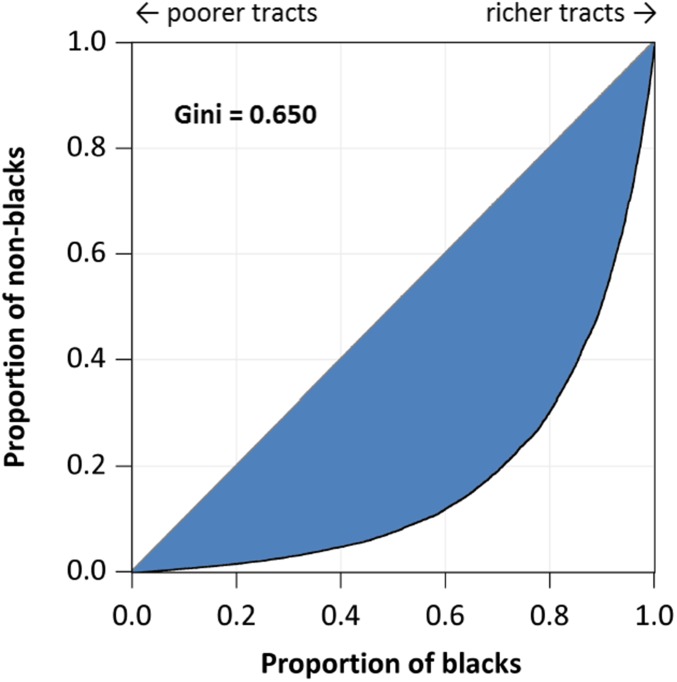
In America, neighborhoods are where the nation’s economic cleavages are most visibly “etched in place” (13). Neighborhood conditions historically have been particularly harsh for blacks, as depicted in Fig. 1. The Lorenz curve (14) in Fig. 1 is constructed by arranging the 57,370 US metropolitan neighborhoods (census tracts) from poorest (highest poverty rate) to least poor based on census data for 1980. The curve plots the cumulative proportion of blacks in the neighborhoods (x axis) by the cumulative proportion of nonblacks in the neighborhoods (y axis), where nonblacks consist of Hispanics, Asians, and non-Hispanic whites. If blacks and nonblacks were distributed equivalently over rich and poor neighborhoods, 10% of each group would reside in the poorest 10% of neighborhoods, 20% of each group in the poorest 20% of neighborhoods, and so on, coinciding with the diagonal line of equality in Fig. 1. Instead, the Lorenz curve lies well below the line, reflecting a high concentration of blacks in poorer-than-average neighborhoods.
Fig. 1.
Lorenz curve showing black neighborhood disadvantage in 1980.
The degree of black neighborhood disadvantage is quantified as the difference between the Lorenz curve and the line of equality. There are two standard ways to measure this difference. The first, the index of dissimilarity (D), measures the difference as the vertical distance between the curve and the line of equality at its greatest point. The second, the Gini coefficient (15), is the proportion of the area below the diagonal that falls within the curve (the shaded area in Fig. 1). Both indexes range in value from zero (no black disadvantage) to 1.0 (all blacks live in poorer neighborhoods than all nonblacks). We use the Gini in our analysis because it is based on information for the entire distribution and is decomposable (Table 1) whereas D is based on a single point on the Lorenz curve and is not decomposable.
Table 1.
Decomposition of decline in black neighborhood disadvantage, 1980–2010
| Component | Change in Gini | Contribution | |
| Additive | Interactive | ||
| Black–white inequality | −0.211 | −0.170 | −0.189 |
| Black–Hispanic inequality | −0.171 | −0.025 | −0.014 |
| Black–Asian inequality | −0.156 | −0.007 | −0.003 |
| Population composition | −0.062 | −0.066 | |
| Joint change | 0.008 | ||
| Total change | −0.264 | −0.264 | |
Note: from 1980 to 2010, the Hispanic share of the nonblack metropolitan population grew from 8.4 to 21.4%, and the Asian portion grew from 2.0 to 7.3%. The additive model weights by the simple average of the group’s share of the nonblack population in 1980 and 2010, whereas the interactive model weights by the group’s share of the nonblack population in 1980.
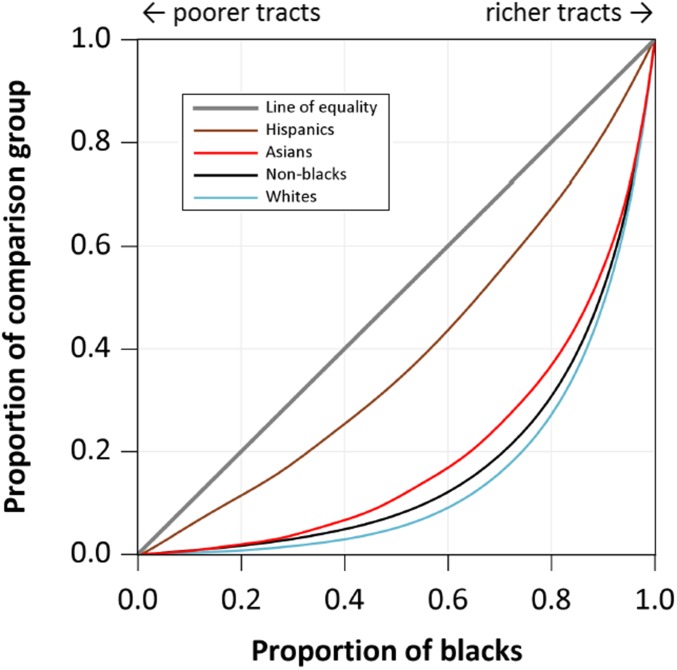
The Gini coefficient is 0.65 in Fig. 1 (D = 0.51), indicating large differences in the neighborhood poverty rates for blacks and other Americans in 1980. The curve includes the point (0.50, 0.077), for example, indicating that in 1980 only 7.7% of nonblacks lived in neighborhoods where the poverty rate was as high as or higher than where the typical (median) black lived. By 2010, this figure had increased from 7.7 to 22.5% and the Gini had declined to 0.39. To understand how this reduction in black neighborhood disadvantage came about, note that the Lorenz curve—and thus its associated Gini—is a population-weighted average of the black–white, black–Hispanic, and black–Asian Lorenz curves (for a figure showing the three Lorenz curves, see Fig. S1).
Fig. S1.
Components of black neighborhood disadvantage: Lorenz curves showing black disadvantage relative to whites, Hispanics, and Asians in 1980.
Hence change in the black–nonblack Gini from 1980 to 2010 derives from change in the three constituent Ginis plus change in the population composition of the nonblack population. Formally, let the black–nonblack Gini at a point in time be expressed as , where i indexes the nonblack group of interest, pi is the proportion of the nonblack population in that group, and Gi is the Gini value for that group vis-à-vis blacks. Then change in the black–nonblack Gini from time 1 to time 2 is
| [1] |
where , the average value of at times 1 and 2, and is the average proportion at times 1 and 2. Eq. 1 assumes additive effects. To separate out the interactive effect of change in G and change in p, we weight by the initial (instead of the average) values of G and p:
| [2] |
We are not aware of prior work that has decomposed change in inequality by partitioning the Gini in this manner.
Table 1 reports the additive and interactive components of the decline in black neighborhood disadvantage from 1980 to 2010. There are two critical findings. The first is that black–nonblack neighborhood inequality declined by 40% based on the Gini, from 0.65 in 1980 to 0.39 in 2010 (D declined by 43%, from 0.51 to 0.29). Although blacks today are still much more likely than other Americans to live in high-poverty neighborhoods, there has been a sizable narrowing of the black–nonblack neighborhood poverty gap since 1980. The second critical finding is that the reduction was driven primarily by the narrowing of neighborhood poverty rates between whites and blacks. Because whites constitute the majority of the nonblack population, the notable decline of 0.21 Gini units in black–white inequality (Table 1) had a large compressing effect on black–nonblack neighborhood inequality, accounting for the large majority of the overall decline. Change in the composition of the nonblack population was the next largest factor, accounting for about one-fourth of the decline. Change in black–Hispanic and in black–Asian inequality combined was responsible for only about 10% of the decline in black–nonblack neighborhood inequality.
Change in the Neighborhood Segregation of Blacks, 1980–2010
Residential segregation in America has been the subject of much research in the social sciences (6, 16–23). Black segregation has been a particular concern because of its magnitude and history. As recently as 1980 the Gini coefficient for black–nonblack residential segregation in metropolitan America was 0.89 (D = 0.75), far exceeding the degree of inequality in black–nonblack neighborhood poverty at that time (Gini = 0.65, D = 0.51).
The general consensus among researchers—that the segregation of blacks is high, and will remain so well into the future—was called into question in 2012 by a highly publicized report proclaiming the approaching end of the residential segregation of blacks in America (24). Critics of the report argued that it overstated the decline in black segregation by, among other things, failing to distinguish black Hispanics from African Americans (25). Most critics agree, however, that black residential segregation is declining. From Table 1 we know that black–nonblack differences in neighborhood poverty have diminished notably since 1980. Using data from the same neighborhoods and applying the same methods, do we arrive at the same conclusion about change in black segregation?
To address this question, we reanalyzed the 57,370 metropolitan neighborhoods, this time focusing on change in their racial composition. Because neighborhood segregation is a type of inequality—the unequal distribution of racial groups across neighborhoods—black segregation can be analyzed using the same metric (Gini units) and the same tool (Gini decomposition) that we used to analyze change in black neighborhood disadvantage. To directly compare black segregation with black disadvantage, we calculated segregation for the total US metropolitan population following the same procedure that we used to calculate black disadvantage, which is best measured at the national level. For metropolitan America as a whole, then, we compare the distribution of blacks and nonblacks across neighborhoods (segregation) with the distribution of blacks and nonblacks across rich and poor neighborhoods (disadvantage).
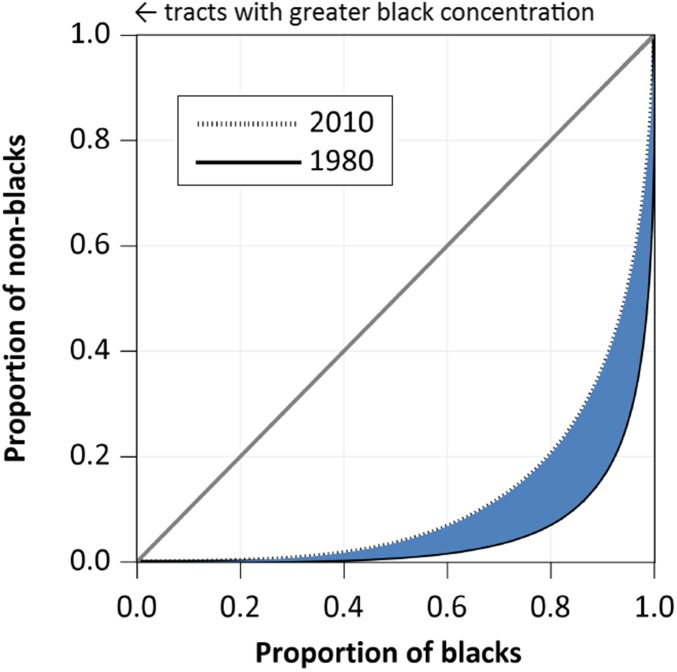
The Lorenz curve for segregation is formed by ordering neighborhoods based on the percentage of residents who are black, from highest to lowest, and plotting the cumulative proportion of blacks in the neighborhoods (x axis) by the cumulative proportion of nonblacks (y axis) (26). If every US neighborhood had the same proportion of blacks—complete black integration—the Lorenz curve would coincide with the diagonal line of equality. Fig. 2 displays the Lorenz segregation curves for US metropolitan areas in 1980 and 2010. Both curves lie well below the line, revealing very high levels of black residential segregation both years. For example, the curve for 1980 includes the point (0.50, 0.008), indicating that in 1980 half of the black population resided in neighborhoods that were home to less than 1% of the nonblack population.
Fig. 2.
Lorenz curves showing decline in black neighborhood segregation from 1980 to 2010.
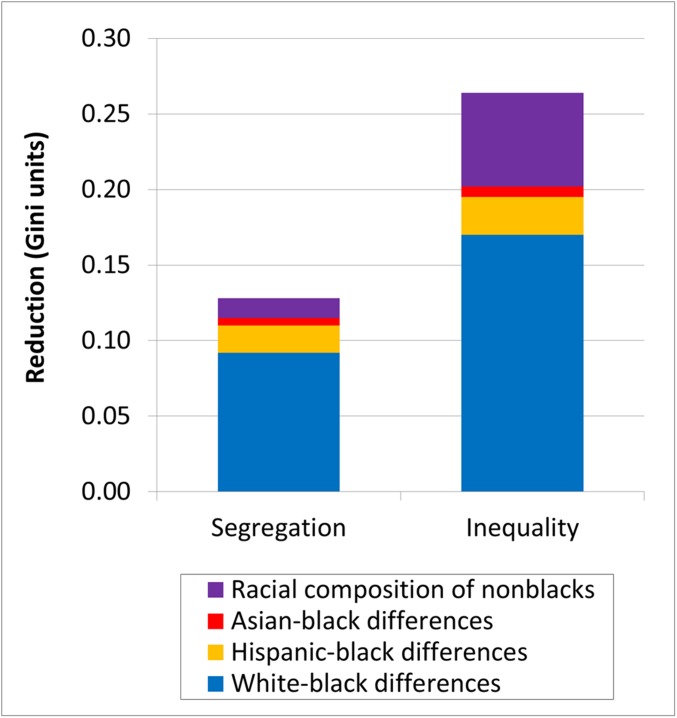
The Lorenz curve for 2010 is closer to the line of equality, indicating that black segregation has moderated somewhat since 1980. Black segregation nonetheless diminished by only 0.13 Gini units (from 0.89 to 0.76), as indicated by the shaded area in Fig. 2—well short of the 0.26 Gini unit decline in black–nonblack neighborhood inequality over the same period. Fig. 3 displays the sources of this difference by comparing the decomposition of the decline in black–nonblack segregation (Table 2) with the decomposition of the decline in black neighborhood disadvantage (Table 1). The critical finding is that black neighborhood disadvantage declined more than black segregation primarily because the decline in black–white disadvantage greatly outpaced the decline in black–white segregation and secondarily because change in the racial/ethnic composition of the nonblack population affected inequality more than it affected segregation. The changing residential circumstances of Asians and Hispanics relative to blacks, on the other hand, accounted for very little of the faster decline in black neighborhood disadvantage.
Fig. 3.
Decline in black segregation versus decline in black neighborhood disadvantage (that is, inequality) from 1980 to 2010.
Table 2.
Decomposition of decline in black segregation, 1980–2010
| Component | Change in Gini | Contribution | |
| Additive | Interactive | ||
| Black–white segregation | −0.114 | −0.092 | −0.102 |
| Black–Hispanic segregation | −0.122 | −0.018 | −0.010 |
| Black–Asian segregation | −0.118 | −0.005 | −0.002 |
| Population composition | −0.013 | −0.013 | |
| Joint change | −0.001 | ||
| Total change | −0.128 | −0.128 | |
See the note in the legend of Table 1.
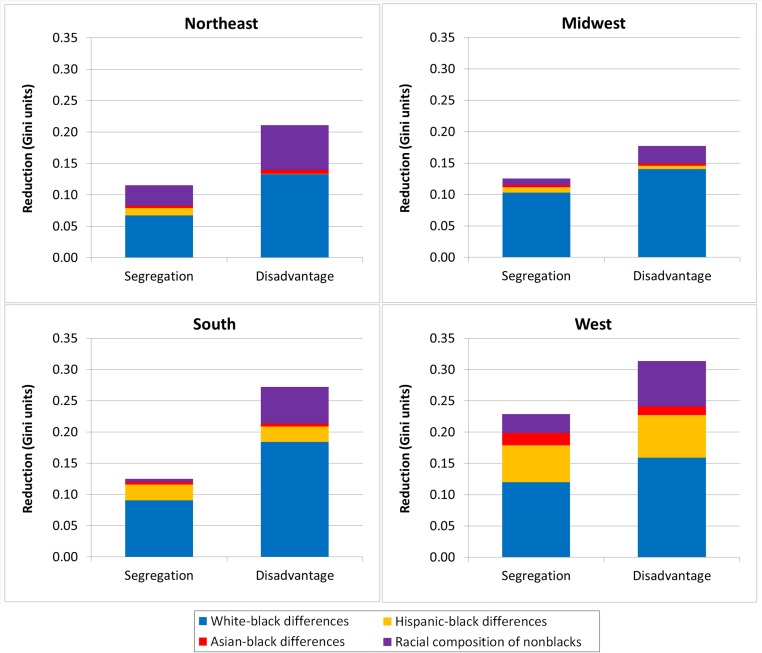
We also compared black segregation with black neighborhood disadvantage within each of the four major regions of the country to determine whether we would find the same pattern of results across regions with different population composition (blacks comprise about 20% of the population in the South, for instance, but only 6% in the West). Regional changes in fact mirrored changes at the national level. In every region, black disadvantage diminished faster than black segregation, and in every instance, this finding was largely due to changes in the poverty rates and racial compositions of the neighborhoods where blacks and whites (as opposed to Hispanics or Asians) lived. As one would expect, Hispanic–black change had a greater impact on change in black disadvantage and segregation in the West, where Hispanics constitute a larger share of the nonblack population. Hispanic–black change nonetheless accounted for very little of the faster decline in black disadvantage in the West because the decline in Hispanic–black segregation nearly kept pace with the decline in the neighborhood disadvantage of blacks relative to Hispanics (Fig. S2).
Fig. S2.
Decline in black segregation versus decline in black neighborhood disadvantage from 1980 to 2010, by region.
Changes in the Distribution of Neighborhood Poverty by Race: Median Shifts and Shape Shifts
Although blacks on average still live in the poorest neighborhoods, they live in relatively better neighborhoods vis-à-vis nonblacks in 2010 than in 1980. As shown in the Gini decompositions above, most of the relative gain of blacks from 1980 to 2010 was due to narrowing differences in the poverty rates of neighborhoods where blacks and whites live. In this section, we use relative distribution methods (27) to compare change in the distribution of neighborhood poverty directly for blacks versus whites, blacks versus Hispanics, and blacks versus Asians. We focus on change in the overlap of the distributions because increasing overlap means declining black disadvantage. Relative distribution methods account for change in the overlap of two distributions by separating the contributions of median shifts from the contributions of shape shifts. The method enables us to determine, for example, how much of the decline in black–white neighborhood disadvantage is due to convergence in the median neighborhood poverty rate for blacks and whites and how much is due to changes in the shapes of the two distributions.
From the declines in inequality observed in Table 1, we know that there is greater overlap in the black–white, black–Hispanic, and black–Asian distributions in 2010 than there was in 1980. Which distributions moved, and in what direction? Table 3 provides descriptive data. From 1980 to 2010, there was a leftward shift in the black distribution, toward lower poverty neighborhoods, and a rightward shift in the distribution for each of the other groups, toward poorer neighborhoods. Blacks, then, were the only major population group in metropolitan America who were living in lower-poverty neighborhoods in 2010 than in 1980. As a result, the difference in median neighborhood poverty rates declined by 4.6 percentage points for blacks and whites, by 5.0 percentage points for blacks and Hispanics, and by 4.4 percentage points for blacks and Asians. These median shifts are likely to account for much of the decline in the neighborhood disadvantage of blacks.
Table 3.
Median shift in neighborhood poverty from 1980 to 2010, by group
| Group | Proportion poor at median | ||
| 1980 | 2010 | Median shift | |
| Blacks | 0.218 | 0.189 | −0.029 |
| Whites | 0.069 | 0.086 | +0.017 |
| Hispanics | 0.157 | 0.178 | +0.021 |
| Asians | 0.073 | 0.088 | +0.015 |
Black neighborhood disadvantage might also have been diminished by shifts in the shapes of neighborhood poverty distributions. The effects of shape shifts depend on the location as well as the size of the shifts. Shape shifts are most consequential where the two distributions being compared overlap the most. For whites and blacks, for example, whites’ shape shifts have the greatest effect when they occur in the neighborhoods where poverty rates are above average for whites, where there is the greatest overlap with prevailing neighborhood poverty rates for blacks.
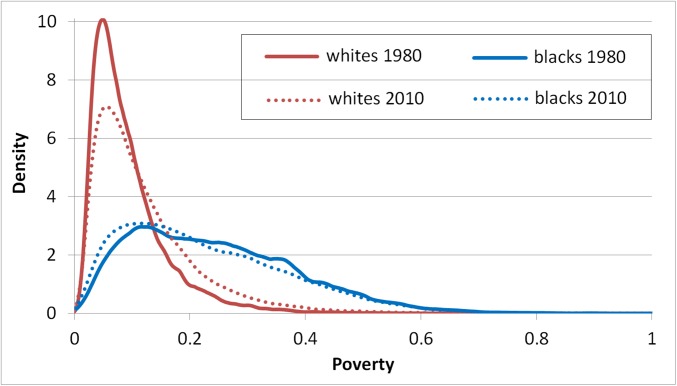
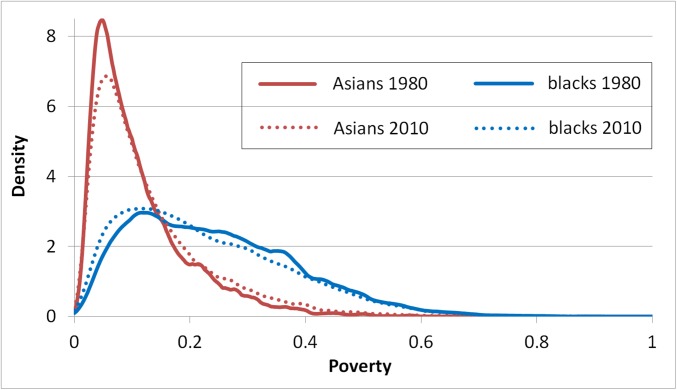
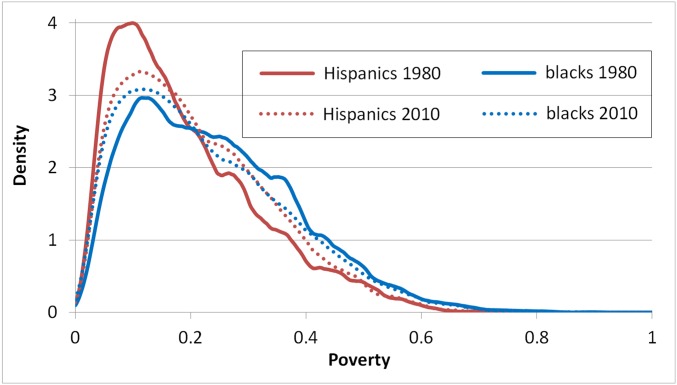
Figs. 4–6 show the neighborhood poverty distribution for blacks relative to the distributions for whites (Fig. 4), Hispanics (Fig. 5), and Asians (Fig. 6) in 1980 and 2010. The figures reveal narrowing of the black neighborhood disadvantage with respect to each of the other racial/ethnic groups. The convergence is particularly notable for blacks and Hispanics. If those trends continue, in the near future Hispanics will tend to live in poorer neighborhoods than blacks.
Fig. 4.
Distribution of neighborhood poverty rates in 1980 and 2010: blacks versus whites.
Fig. 6.
Distribution of neighborhood poverty rates in 1980 and 2010: blacks versus Asians.
Fig. 5.
Distribution of neighborhood poverty rates in 1980 and 2010: blacks versus Hispanics.
Close inspection of the figures reveals the median shifts reported in Table 3—the leftward shift of the black distribution and the rightward shift of the distributions for whites, Hispanics, and Asians. More obvious, however, is the “flattening” of the curves for whites, Hispanics, and Asians. For whites especially, the peak of the curve declined notably, and the right (higher poverty) tail enlarged. Because the distributions for whites, Hispanics, and Asians all thickened in the regions of the curve where a large share of blacks reside, we expect to find that white, Hispanic, and Asian shape shifts all contributed to the decline in black disadvantage, independent of median shifts. The shape of the black distribution in 2010 closely resembles its shape in 1980, so we anticipate that change in the shape of the black distribution contributed little to the decline in black disadvantage (except in the case of Hispanics, where a small shape shift for blacks is likely to be consequential due to the substantial overlap in the Hispanic and black distributions).
Table 4 reports results using relative distribution methods to isolate the contributions of median shifts and shape shifts. As expected, median shifts were responsible for much of the decline in black neighborhood disadvantage, accounting for about three-fourths of the black–white decline, half of the black–Hispanic decline, and two-thirds of the black–Asian decline. For black disadvantage vis-à-vis whites and Asians, the remainder of the decline was due to the shape shift for whites and Asians, respectively—none was due to shape shift in the poverty distribution for blacks themselves. Indeed, the shape shift effect for blacks is negative (but small) when blacks are compared with whites, indicating that black neighborhood disadvantage vis-à-vis whites would have increased, not declined, had the distributions for blacks and whites remained constant except for the shape of blacks’ neighborhood poverty distribution. The decline in black disadvantage vis-à-vis Hispanics was driven roughly equally by blacks’ shape shift (28%) and by Hispanics’ shape shift (25%). This finding is not surprising, given the considerable overlap in the neighborhood poverty distributions for blacks and Hispanics. Finally, there is a negative interaction effect for blacks and Asians, indicating that the joint effect of median shifts and shape shifts operated to reduce the magnitude of the decline in black neighborhood disadvantage vis-à-vis Asians.
Table 4.
Median and shape shift components of the decline in black neighborhood disadvantage, 1980–2010
| Relative distribution component | Comparison population | ||
| Whites, % | Hispanics, % | Asians, % | |
| Median shift | 73 | 50 | 67 |
| Shape shift for blacks | −11 | 28 | <0.5 |
| Shape shift for comparison population | 39 | 25 | 51 |
| Interaction | −1 | −2 | −18 |
Results are the average contributions to within-decile change, from the relative distribution analysis.
Conclusions About Neighborhood Change for Blacks: Upward Economic Mobility with Modest Racial Integration
Blacks have been achieving more equal economic residential footing with other Americans faster than they have been achieving residential integration with other Americans. This state of affairs raises the question of why, during a period of legal sanctions against housing discrimination on the basis of race, black neighborhood disadvantage has proved to be more tractable than black neighborhood segregation. As shown in this study, the principal source of the faster decline in black disadvantage than in black segregation is the greater black–white convergence in neighborhood poverty rates than in neighborhood coresidence. Blacks have become less residentially disadvantaged primarily because of their diminished neighborhood poverty differences with whites, the largest racial group in America. The narrowing of black–Hispanic and black–Asian differences matters much less for either black disadvantage or black segregation.
The findings of this study challenge three perceptions about the racial stratification of America’s neighborhoods. First, the end of black segregation is not at hand. As of 2010, the black–nonblack segregation Gini was 0.76, with half of the metropolitan black population living in neighborhoods that were home to only 3.6% of the nonblack population. Clearly, the residential segregation of blacks remains very high in America.
Second, in contrast to the view that blacks have become less segregated largely because Hispanics and Asians have served as a buffer between blacks and whites (28), we find that Hispanic–black and Asian–black integration collectively accounted for only about 18% of the decline in black segregation from 1980 to 2010. White–black integration, in contrast, accounted for about 72% of the decline. To be sure, white–black differences count more because whites outnumber Hispanics and Asians. However, that is the point: had white–black segregation not changed, the decline in the residential segregation of blacks between 1980 and 2010 would have been only about one-fourth as large. That fact is not easily deduced from patterns of mobility into or out of poor neighborhoods (29, 30) or from research on white flight from neighborhoods as blacks move in (31). It is difficult to infer aggregate neighborhood change from household migration (32), and only by directly decomposing the change in black–nonblack segregation do we discover that the decline in the residential segregation of blacks in America has been driven primarily by reduction in the residential separation of blacks and whites.
Third, the reduction in black segregation was not the most significant change in the racial stratification of America’s neighborhoods from 1980 to 2010. Over this period, there was a much greater—although less noticed—narrowing of neighborhood poverty differences between blacks and other Americans in general and between blacks and whites in particular.
Our analysis reveals the sources of the narrowing neighborhood poverty gap between blacks and other Americans. We now know that the decline in black disadvantage resulted primarily from the narrowing of the black–white gap in neighborhood poverty. We also know how distributional changes produced the decline in black disadvantage: shape shifts for whites, Hispanics, and Asians accounted for part of the decline in the relative disadvantage of blacks, but a larger portion of the decline was due to median shifts—lower neighborhood poverty rates for blacks and higher rates for whites, Hispanics, and Asians. The growth in neighborhood poverty rates for whites squares with census reports showing a sharp increase in the number of poor whites living in poor neighborhoods (33). The decline in neighborhood poverty for blacks is consistent with evidence of the movement of blacks into middle-income neighborhoods (18, 34, 35); when a growing middle class black population moves from low income to middle income neighborhoods that are predominantly black, black neighborhood disadvantage declines faster than black segregation, in line with the findings here. The reasons for these trends are only partly understood. It is likely that the gentrification of poor urban areas (36) and a softening of white aversion to black neighbors (figure 3.5 in ref. 37) are responsible for some of the reduction in black neighborhood disadvantage. The movement of immigrant populations to new destinations (38, 39) might have played a role as well.
In light of evidence that racial disparity in neighborhood economic conditions serves as a source of racial differences in life chances (8, 9), black neighborhood disadvantage undercuts the American ideal of equality of opportunity. The Gini value for black–white inequality in neighborhood poverty was 0.48 in 2010, indicating that on average blacks still reside in significantly poorer neighborhoods than whites. A serious concern is that black–white differences in wealth inequality (40)—inequality that itself is based to a large extent on racial differences in housing assets (41)—might slow or halt further narrowing of the black–white neighborhood poverty gap. With the high cost of housing, for example, intergenerational transfers are likely to become increasingly important, so black deficiencies in home wealth today might make it more difficult for the next generation of blacks to escape high-poverty neighborhoods. There is no guarantee, then, that the decline in black–white neighborhood inequality will continue. Although residential segregation dominates the headlines, the future direction and pace of change in racial neighborhood inequality is likely to have greater implications for American society.
Materials and Methods
Neighborhood Data.
When we ask whether blacks now live in neighborhoods that are more economically similar to the neighborhoods where other Americans live, we want to know about disparities in conditions for blacks and other Americans without regard to whether they live in Atlanta or Detroit or Los Angeles. By pooling the neighborhood data for all US metropolitan areas, we compare the poverty rates of neighborhoods without regard to their metropolitan location. In line with many prior studies, we use census-defined tracts to measure neighborhoods. Census tracts are designed to be relatively homogeneous units with an optimum size of about 4,000. We assembled racial composition at the tract level from the 1980 and 2010 decennial censuses. Neighborhood poverty rate is the percentage of individuals living below the poverty line, which we assembled from long-form census data for 1980 and from 5-y estimates centered on 2010 from the American Community Survey. To base findings on the same neighborhoods in 1980 and 2010, we used data where the 1980 census tracts were standardized to 2010 boundaries (42). We excluded tracts where more than 25% of residents live in group quarters (such as prisons), yielding a consistent set of 57,370 neighborhoods for both years. Using census data for all places designated as “metropolitan areas” by the US Census Bureau captures 77% of the total US population in 1980 and 84% in 2010. We begin with 1980 because it is the first year with adequate census data for Hispanics. The four major racial/ethnic groups in the analysis—Hispanics, non-Hispanic whites, non-Hispanic blacks, and Asians—comprise more than 97% of the US population.
Methods.
This study provides a design for revealing the loci of change in the relative gains or losses of population groups. The design combines Gini decomposition with relative distribution methods. Although there are various ways to decompose inequality and segregation (43), the decomposition method introduced here identifies the group comparisons that matter most for the relative gains or losses of one population (e.g., blacks) vis-à-vis another (e.g., nonblacks). Relative distribution analysis in turn identifies the distributional changes—median shifts versus shape shifts—that account for the change in a particular group comparison (e.g., blacks versus whites). Both methods deepen our understanding of change in inequality between groups by pinpointing where the change is coming from—which subpopulations, and which parts of the distribution, are driving the change. By combining the decomposition of Ginis with the decomposition of distributional change using relative distribution methods, the analysis here provides a template for future research investigating the relative gains and losses of groups.
Acknowledgments
Don Miller [Population Research Institute (PRI)] assisted with the figures. G.F. is the Roy C. Buck Professor of American Institutions, Sociology, and Demography. This study was supported by National Science Foundation Behavioral and Cognitive Sciences Grant 12-60632 (to G.F.), as well as by funding from Eunice Kennedy Shriver National Institute of Child Health and Human Development Grant R24HD041025 (to the PRI at the Pennsylvania State University).
Footnotes
The authors declare no conflict of interest.
An earlier version of this work was presented at Nuffield College, Oxford, January 27, 2016.
Data deposition: The dataset used in this analysis has been archived in the Interuniversity Consortium for Political and Social Research (ICPSR) at the University of Michigan. The deposit number is 36626.
This article is a PNAS Direct Submission.
This article contains supporting information online at www.pnas.org/lookup/suppl/doi:10.1073/pnas.1607220113/-/DCSupplemental.
References
- 1.Reardon SF, Fox L, Townsend J. Neighborhood income composition by household race and income, 1990-2009. Ann Am Acad Pol Soc Sci. 2015;660:78–97. [Google Scholar]
- 2.Logan JR. Separate and Unequal: The Neighborhood Gap for Blacks, Hispanics and Asians in Metropolitan America. Project U.S. 2010 Report. Russell Sage Foundation; New York: 2011. [Google Scholar]
- 3.Firebaugh G, Farrell CR. Still large, but narrowing: The sizable decline in racial neighborhood inequality in metropolitan America, 1980-2010. Demography. 2016;53(1):139–164. doi: 10.1007/s13524-015-0447-5. [DOI] [PMC free article] [PubMed] [Google Scholar]
- 4.Reardon SF, Bischoff K. Income inequality and income segregation. AJS. 2011;116(4):1092–1153. doi: 10.1086/657114. [DOI] [PubMed] [Google Scholar]
- 5.Jargowsky PA. Poverty and Place: Ghettos, Barrios, and the American City. Russell Sage Foundation; New York: 1997. [Google Scholar]
- 6.Massey DS, Denton N. American Apartheid: Segregation and the Making of the Underclass. Harvard Univ Press; Cambridge, MA: 1993. [Google Scholar]
- 7.Harding DJ. Counterfactual models of neighborhood effects: The effect of neighborhood poverty on dropping out and teenage pregnancy. Am J Sociol. 2003;109(3):676–719. [Google Scholar]
- 8.Sampson RJ, Sharkey P, Raudenbush SW. Durable effects of concentrated disadvantage on verbal ability among African-American children. Proc Natl Acad Sci USA. 2008;105(3):845–852. doi: 10.1073/pnas.0710189104. [DOI] [PMC free article] [PubMed] [Google Scholar]
- 9.Sharkey P, Elwert F. The legacy of disadvantage: Multigenerational neighborhood effects on cognitive ability. AJS. 2011;116(6):1934–1981. doi: 10.1086/660009. [DOI] [PMC free article] [PubMed] [Google Scholar]
- 10.Wodtke GT, Harding DJ, Elwert F. Neighborhood effect heterogeneity by family income and developmental period. AJS. 2016;121(4):1168–1222. doi: 10.1086/684137. [DOI] [PMC free article] [PubMed] [Google Scholar]
- 11.Chetty R, Hendren N, Katz L. The effects of exposure to better neighborhoods on children: New evidence from the moving to opportunity experiment. Am Econ Rev. 2016;106(4):855–902. doi: 10.1257/aer.20150572. [DOI] [PubMed] [Google Scholar]
- 12.Sharkey P. Stuck in Place: Urban Neighborhoods and the End of Progress Toward Racial Equality. Univ of Chicago Press; Chicago: 2013. [Google Scholar]
- 13.Sampson RJ. Great American City: Chicago and the Enduring Neighborhood Effect. Univ of Chicago Press; Chicago: 2012. [Google Scholar]
- 14.Lorenz MO. Methods of measuring the concentration of wealth. Publ Am Stat Assoc. 1905;9(70):209–219. [Google Scholar]
- 15.Gini C. Measurement of the inequality of incomes. Econ J. 1921;31(121):124–126. [Google Scholar]
- 16.Taeuber KE, Taeuber AF. Negroes in Cities: Residential Segregation and Neighborhood Change. Atheneum; West Hanover, MA: 1965. [Google Scholar]
- 17.Clark WAV. Residential segregation in America’s cities: A review and interpretation. Popul Res Policy Rev. 1986;5(2):95–127. [Google Scholar]
- 18.Wilson WJ. The Truly Disadvantaged: The Inner City, the Underclass, and Public Policy. Univ of Chicago Press; Chicago: 1987. [Google Scholar]
- 19.Cutler DM, Glazer EL. Are ghettos good or bad? Qrtly J Econ. 1997;112(3):827–872. [Google Scholar]
- 20.Ellen IG. Sharing America’s Neighborhoods: The Prospects for Stable Racial Integration. Harvard Univ Press; Cambridge, MA: 2000. [Google Scholar]
- 21.Charles CZ. The dynamics of racial residential segregation. Annu Rev Sociol. 2003;23(29):167–207. [Google Scholar]
- 22.Iceland J. Where We Live Now: Immigration and Race in America. Univ of California Press; Berkeley: 2009. [Google Scholar]
- 23.Xie Y, Zhou X. Modeling individual-level heterogeneity in racial residential segregation. Proc Natl Acad Sci USA. 2012;109(29):11646–11651. doi: 10.1073/pnas.1202218109. [DOI] [PMC free article] [PubMed] [Google Scholar]
- 24.Glaeser E, Vigdor J. 2012. The End of the Segregated Century: Racial Separation in America’s Neighborhoods, 1890-2010. Civic Report No. 66 (Manhattan Institute, New York)
- 25.Alba R, Romalewski S. The End of Segregation? Hardly. Center for Urban Research, City University of New York; New York: 2012. [Google Scholar]
- 26.Duncan OD, Duncan B. A methodological analysis of segregation measures. Am Sociol Rev. 1955;20(2):210–217. [Google Scholar]
- 27.Handcock MS, Morris M. Relative Distribution Methods in the Social Sciences. Springer; New York: 1999. [Google Scholar]
- 28.Logan JR, Zhang C. Global neighborhoods: New pathways to diversity and separation. AJS. 2010;115(4):1069–1109. doi: 10.1086/649498. [DOI] [PMC free article] [PubMed] [Google Scholar]
- 29.Crowder K, South SJ. Race, class, and changing patterns of migration between poor and nonpoor neighborhoods. Am J Sociol. 2005;110(6):1715–1763. [Google Scholar]
- 30.Briggs XDS, Keys BJ. Has exposure to poor neighborhoods changed in America? Race, risk and housing location in two decades. Urban Stud. 2009;46(2):429–458. [Google Scholar]
- 31.Krysan M. Whites who say they’d flee: Who are they, and why would they leave? Demography. 2002;39(4):675–696. doi: 10.1353/dem.2002.0037. [DOI] [PubMed] [Google Scholar]
- 32.Sampson RJ, Sharkey P. Neighborhood selection and the social reproduction of concentrated racial inequality. Demography. 2008;45(1):1–29. doi: 10.1353/dem.2008.0012. [DOI] [PMC free article] [PubMed] [Google Scholar]
- 33.Bishaw A. Changes in Areas with Concentrated Poverty: 2000 to 2010. US Census Bureau; Washington, DC: 2014. [Google Scholar]
- 34.Lacy K. Blue-Chip Black: Race, Class, and Status in the New Black Middle Class. Univ of California Press; Berkeley: 2007. [Google Scholar]
- 35.Sharkey P. Spatial segmentation and the black middle class. AJS. 2014;119(4):903–954. doi: 10.1086/674561. [DOI] [PubMed] [Google Scholar]
- 36.Freeman L, Cai T. White entry into black neighborhoods: Advent of a new era? ANNALS Am Academy Political & Social Science. 2015;660:302–318. [Google Scholar]
- 37.Bobo LD, Charles CZ, Krysan M, Simmons AD. The real record on racial attitudes. In: Marsden PM, editor. Social Trends in American Life. Harvard Univ Press; Cambridge, MA: 2012. pp. 38–83. [Google Scholar]
- 38.Massey D, editor. New Faces in New Places. Russell Sage Foundation; New York: 2008. [Google Scholar]
- 39.Hall M. Residential integration on the new frontier: immigrant segregation in established and new destinations. Demography. 2013;50(5):1873–1896. doi: 10.1007/s13524-012-0177-x. [DOI] [PMC free article] [PubMed] [Google Scholar]
- 40.Shapiro TM. The Hidden Cost of Being African-American: How Wealth Perpetuates Inequality. Oxford Univ Press; New York: 2004. [Google Scholar]
- 41.Krivo LJ, Kaufman RL. Housing and wealth inequality: Racial-ethnic differences in home equity in the United States. Demography. 2004;41(3):585–605. doi: 10.1353/dem.2004.0023. [DOI] [PubMed] [Google Scholar]
- 42.Logan JR, Xu Z, Stults B. Interpolating U.S. decennial census tract data from as early as 1970 to 2010: A longitudinal tract database. Prof Geogr. 2014;66(3):412–420. doi: 10.1080/00330124.2014.905156. [DOI] [PMC free article] [PubMed] [Google Scholar]
- 43.Firebaugh G. Seven Rules for Social Research. Princeton Univ Press; Princeton: 2008. pp. 220–226. [Google Scholar]


