Significance
A central question in systems neuroscience is how cognitive functions can arise from the interplay of many different brain areas. For example the cognitive act of forming a decision requires a concerted computation involving sensory, mnemonic, and executive information residing in neural circuits that have different anatomical locations, that operate on different temporal scales, and that extend over different spatial dimensions. We find that in a central cortical hub—the posterior parietal cortex—firing rate information about upcoming decisions is pulsed according to intrinsic temporal structure in the beta- and gamma-frequency ranges. The brain may use temporal structure at several time scales to support distributed computations that underlie reward-guided decisions.
Keywords: decision making, phase-of-firing, neural code, saccade, reach
Abstract
Making a decision involves computations across distributed cortical and subcortical networks. How such distributed processing is performed remains unclear. We test how the encoding of choice in a key decision-making node, the posterior parietal cortex (PPC), depends on the temporal structure of the surrounding population activity. We recorded spiking and local field potential (LFP) activity in the PPC while two rhesus macaques performed a decision-making task. We quantified the mutual information that neurons carried about an upcoming choice and its dependence on LFP activity. The spiking of PPC neurons was correlated with LFP phases at three distinct time scales in the theta, beta, and gamma frequency bands. Importantly, activity at these time scales encoded upcoming decisions differently. Choice information contained in neural firing varied with the phase of beta and gamma activity. For gamma activity, maximum choice information occurred at the same phase as the maximum spike count. However, for beta activity, choice information and spike count were greatest at different phases. In contrast, theta activity did not modulate the encoding properties of PPC units directly but was correlated with beta and gamma activity through cross-frequency coupling. We propose that the relative timing of local spiking and choice information reveals temporal reference frames for computations in either local or large-scale decision networks. Differences between the timing of task information and activity patterns may be a general signature of distributed processing across large-scale networks.
The posterior parietal cortex (PPC) integrates sensory signals for impending actions. Firing rates of neurons in the PPC encode movement intention and the temporal evolution of movement choices (1–13) as well as decision variables such as expected rewards, the subjective desirability during reward-guided decisions (14–18), and the certainty in perceptual decisions (19). Decisions are made within a network that extends across many regions of the brain (20–25), so efficient and flexible mechanisms are required to enable distributed computations. Dynamic and frequency-specific correlations in activity between brain areas are ubiquitous and offer potential physiological mechanisms supporting distributed computations in decision networks (13, 21, 26–34). We hypothesize that the encoding of decisions in the PPC should depend on the temporal structure present in neuronal activity. Previous studies have shown that coherently active ensembles of cells in the PPC predict reaction times (9) and movement choices (13, 21) better than neurons without coherent dynamics. However, whether and how the coding of decisions depends on the temporally structured firing of PPC neurons remains unknown. We examined temporal structure in the encoding of look-reach decisions by PPC neurons.
Results
We analyzed the activity of 149 units [97 units (31 single units and 66 multiunits) for monkey C and 52 units (14 single units and 38 multiunits) for monkey R] and 186 simultaneously recorded local field potentials (LFP) (116 LFPs in monkey C and 70 LFPs in monkey R, one or two LFP electrodes per unit) from nearby (within ∼2 mm) electrodes. We first established the presence of firing-rate encoding of choice and the temporal structure of the neuronal activity in the PPC (11, 32, 35) before testing whether and how decision coding varies with the temporal structure of neuronal activity.
PPC Neurons Encode Upcoming Movement Choices.
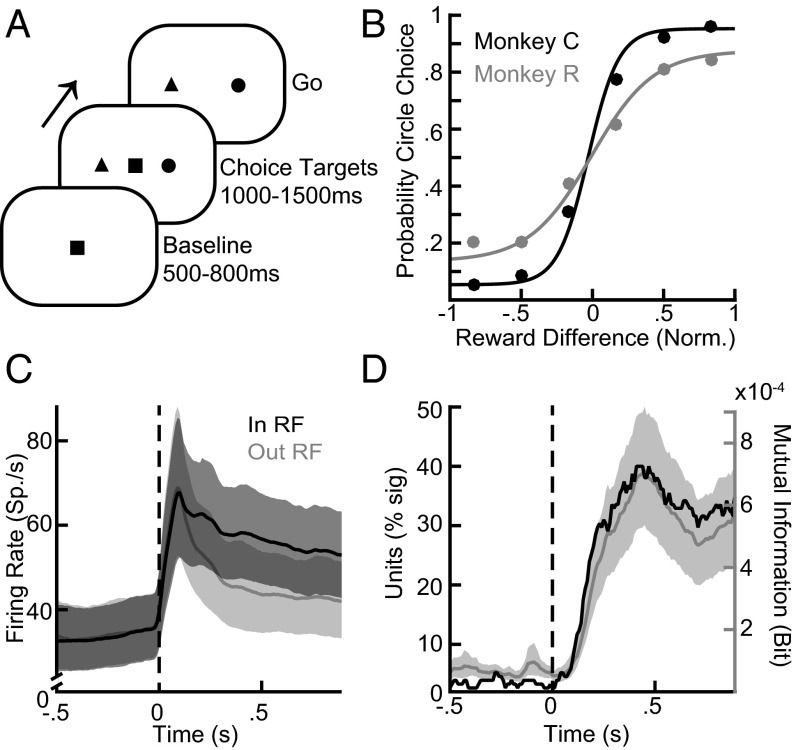
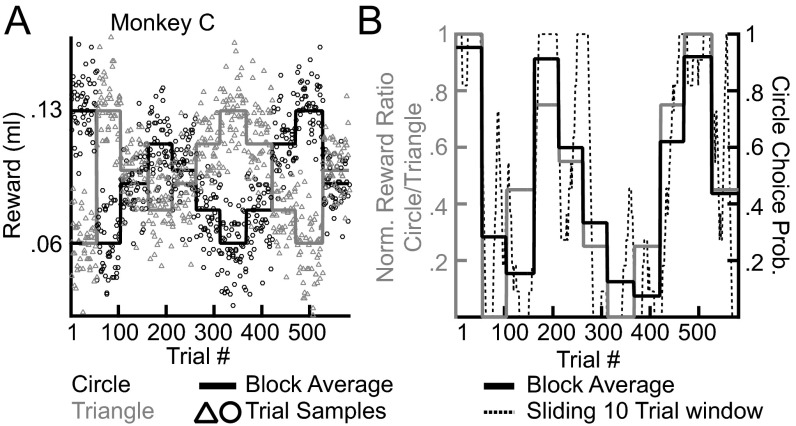
We recorded neuronal activity while monkeys performed reward-guided look-and-reach decisions. At the start of each trial, in the baseline epoch, the monkeys maintained touch and fixation on a central target. Then, in the choice epoch, they were presented with two alternatives, a circle and a triangle, and had to choose one with a combined look-and-reach movement (Fig. 1A). We presented targets in two locations, randomly interleaved trial by trial. Both shapes were associated with changing reward magnitudes that presented a dynamic and challenging reward environment for the animals (Fig. S1). Each monkey reliably allocated its choices according to the shapes’ relative reward magnitudes (Fig. 1B). As expected, the firing rate of PPC neurons robustly encoded the upcoming movement choice. After choice target onset, units exhibited a strong transient increase in the firing rate regardless of the upcoming movement choice (Fig. 1C). Firing rates separated depending on the movement choice. We quantified the information about upcoming movements in the firing rate by estimating the mutual information (MI) between the movement choice and the firing rate (Fig. 1D). A total of 101 units (68%; 68 units for monkey C and 33 units for monkey R) exhibited significant choice-MI in the choice epoch (200–1,000 ms after choice target onset) (permutation tests, P < 0.05).
Fig. 1.
Neurons in the PPC encode upcoming movement choices. (A) Events during the behavioral task. At the beginning of each trial the animals maintained central touch-and-fixation for 500–800 ms. Two choice targets (a diametrically opposed circle and triangle) appeared. Either shape could appear on either side and were informative about average reward magnitudes that remained stable for 50–60 trials before changing to new average magnitudes. After maintaining central touch-and-fixation for another 1,000–1,500 ms, the central stimuli turned off, instructing the animals to perform a combined reach-and-saccade movement to one shape. The animals were free to choose the target shape on each trial. (B) Fitted psychometric curves for monkey C and monkey R are shown in black and gray, respectively. (C) Firing rate dynamics for trials into (black) and out of (gray) the response field of units with significant choice-MI. Lines and shadings show the means and their 95% confidence interval, respectively. (D) MI time courses across all recorded units. The gray line and shading show the average raw MI and its 95% confidence interval. The black line shows the percent of units exhibiting significant MI in a sliding 100-ms window.
Fig. S1.
An example of reward drifts and choice behavior. (A) Drifting reward environment. Data for the circle target are shown in black, and data for the triangle shape are shown in gray. After 50–60 trials both shapes transitioned to one of six possible noisy average reward differences in an unsignaled fashion. (B) Choice probabilities match the ratio of rewards. The block average reward ratio (normalized to minimum–maximum) is shown in gray, and block average choice probabilities are shown in black. Choice probabilities in a sliding 10-trial window are shown as a dotted black line.
Decision-Related Activity Across Time Scales.
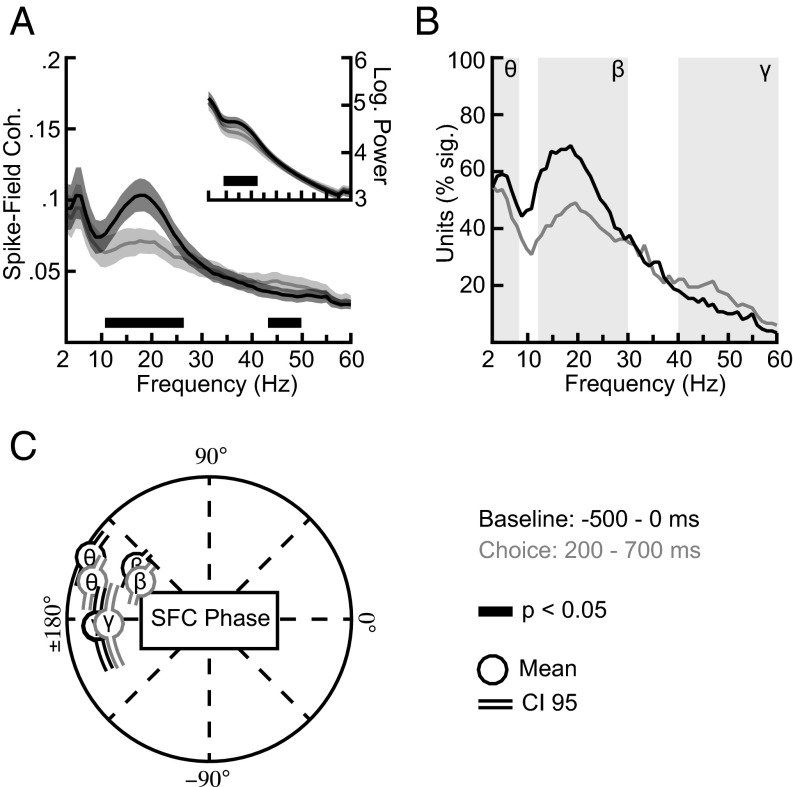
We next assessed the temporal structure of PPC activity by estimating the spike-field coherence (SFC) and LFP power spectra. Overall 127 units (85%; 84 units for monkey C and 43 units for monkey R) showed significant SFC with the nearby LFP during the baseline epoch (the 500 ms preceding the target onset), and 119 units (79%; 78 units for monkey C and 41 units for monkey R) showed significant SFC during the choice epoch (200–700 ms after target onset). We found prominent SFC with a peak in the beta-frequency range (12–30 Hz) [permutation tests, familywise error probability (PFWER) < 0.05] (Fig. 2 A and B). Beta activity varied with task epoch. SFC and power (Fig. 2A, Inset) decreased significantly during the choice epoch compared with the baseline epoch [permutation tests, false-discovery rate probability (PFDR) < 0.05] (Fig. 2A). In total 118 units [33 single units (73%) and 85 multiunits (82%)] were beta coherent during the baseline epoch, and 95 units [23 single units (51%) and 72 multiunits (85%)] were beta coherent during the choice epoch.
Fig. 2.
Temporal structure of activity in the PPC. (A) Spike-field coherence during the baseline (500 ms before target onset, gray) and choice (200–700 ms after target onset, black) trial epochs. For comparison we chose equal time windows for the two epochs and avoided the visual onset transients of PPC activity in the first 200 ms after target onset. (Inset) The signal power at the LFP-recording electrodes during the same trial epochs. Shadings show 95% confidence intervals. Black bars near the x axis mark significant differences between the two trial epochs (FDR corrected, q < 0.05). (B) Percent of coherent units across frequencies for the two trial epochs. Background shadings schematically depict theta- (2–8 Hz), beta- (12–30 Hz), and gamma- (40–60 Hz) frequency ranges of interest used to average frequency bins. For the preferred SFC phases, see C. (C) Beta- and gamma- frequency phases during the baseline epoch for all coherent units. Data depict the circular average across all significant frequency bins and units in the theta- (2–8 Hz), beta- (12–30 Hz), and gamma- (40–60 Hz) frequency ranges. Lines indicate the 95% confidence interval.
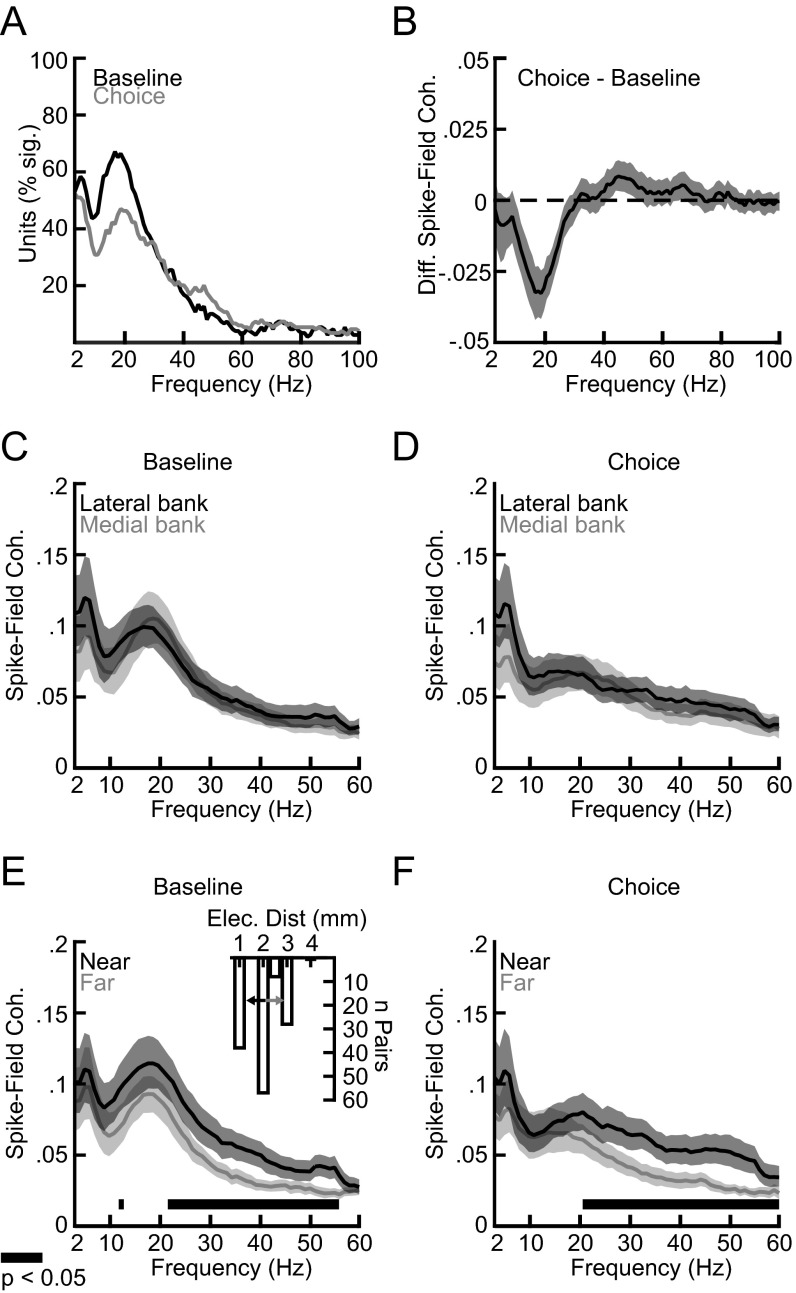
SFC also exhibited a peak in the theta-frequency range (2–8 Hz) (permutation tests, PFWER < 0.05) (Fig. 2 A and B). Theta SFC and LFP power did not differ between baseline and choice epochs (permutation tests, PFDR > 0.05) (Fig. 2A). We found that 102 units [22 single units (49%) and 80 multiunits (77%)] were theta coherent during the baseline epoch, and 98 units [20 single units (44%) and 78 multiunits (75%)] were theta coherent during the choice epoch. Last, the activity in the gamma range (40–60 Hz) varied after the onset of the choice targets. Gamma-band SFC, but, interestingly, not LFP power, increased significantly during the choice epoch (permutation tests, PFDR < 0.05) (Fig. 2A). Extending the analysis to higher frequencies revealed no additional effects (Fig. S2A). Overall 45 units [11 single units (24%) and 34 multiunits (33%)] were gamma coherent during the touch-and-fixation epoch, and 48 units [11 single units (24%) and 37 multiunits (36%)] were gamma coherent during the choice epoch.
Fig. S2.
Details of the SFC across the task epochs. (A) Percentage of units with significant SFC for the baseline and choice epochs. The data in Fig. 2B are shown for up to 100 Hz. (B) The difference in SFC between the baseline and choice epochs across all recorded units for up to 100 Hz. (C and D) SFC according to Fig. 2A but shown separately for a matched number of electrode pairs in the lateral and medial banks of the IPS (n = 69). (E and F) As in C and D but shown separately for the half of the recordings made from electrode pairs with tips near each other (median separation of 1.07 mm) and for the half of the recordings made from electrode pairs with tips further apart (median separation of 2.86 mm). The Inset in E shows a histogram of the electrode distances. The center of the two small arrows indicates the median distance between electrodes used to split the pairs into two groups. All shadings depict the 95% confidence interval.
Given the presence of activity at three distinct time scales, we wondered whether the activities co-occurred more often than would be expected by chance during the choice period. We found that 79 units [17 single units (38%) and 62 multiunits (60%)] were coherent both in the theta and beta ranges (Fisher’s exact test, PFWER = 2.27 × 10⁻⁸), 40 units [eight single units (18%), 32 multiunits (31%)] were coherent in the theta and gamma ranges (Fisher’s exact test, PFWER = 0.0052), and 42 units [10 single units (22%) and 32 multiunits (31%)] were coherent in the beta and gamma ranges (Fisher’s exact test, PFWER = 6.53 × 10⁻⁵). Thus, the units in the PPC often displayed temporal structure across multiple time scales.
We also examined whether the observed temporal structure differed between the lateral and medial banks of the intraparietal sulcus (IPS). We found no significant difference (PFDR > 0.05) (Fig. S2 C and D). However, the distance between the electrode tips of the recording pairs influenced the SFC. Electrodes usually were separated from each other by about 2 mm during the recordings. However, when comparing the SFC for the half of the recordings with electrode tips near each other (median separation of 1.07 mm) and the half of the recordings with far electrode tips farther apart (median separation of 2.86 mm), we found that higher-frequency SFC (>20 Hz), particularly including the gamma activity, was stronger for electrode tips that were closer to each other (PFDR < 0.05) (Fig. S2 E and F). Thus, gamma activity appeared to be more local than either theta or beta activity.
Examining the preferred phases of the SFC, we observed clustering around the downswing and trough of the LFP activity (Fig. 2C). We found significant phase concentrations (Rayleigh tests, all PFWER < 0.05), during the baseline epoch that remained stable during the choice epoch. Phase concentrations did not differ significantly between epochs for all frequency ranges (Watson–Williams tests between epochs for all units with significant SFC during both epochs, all P > 0.05). Thus, PPC spiking contains temporal structure at three time scales—theta, beta, and gamma—that respond differently to choice. During choice, theta activity remained constant, beta activity decreased, and gamma activity increased.
Choice Information Covaries with Beta and Gamma Activity.
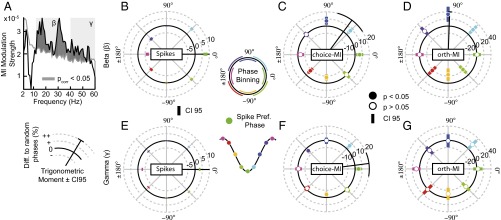
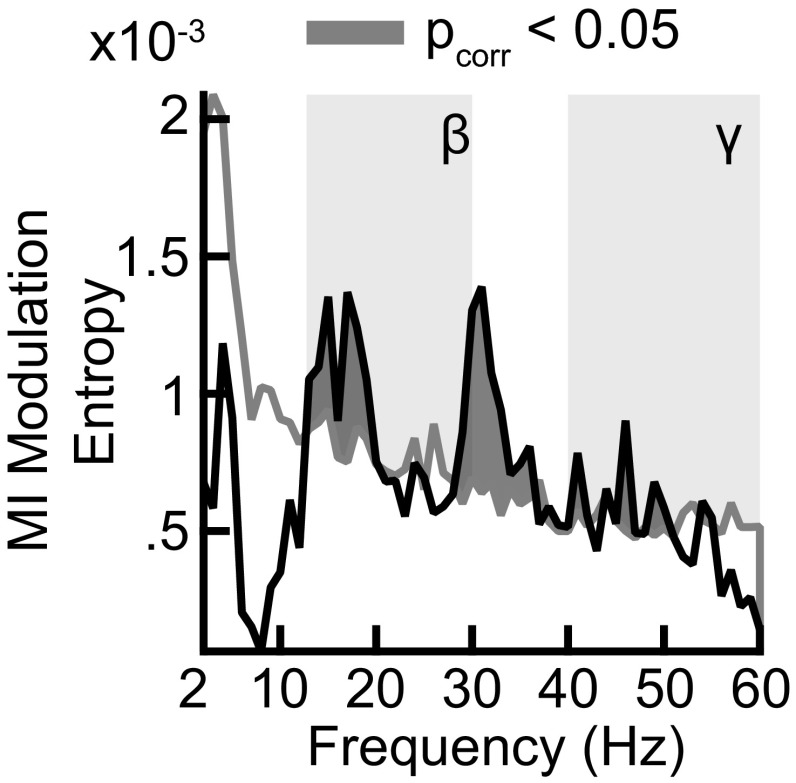
The temporal structure in PPC spiking suggests that neural encoding also may depend on the phase of the activity. We therefore tested whether choice-MI is modulated by LFP phase at each time scale. We defined eight different LFP phase bins and calculated how much choice-MI varies across the different bins (Fig. 3A). We analyzed the choice epoch 200–1,000 ms after choice target onset and included all units that exhibited significant SFC and significant choice-MI during the choice epoch [79 units (53%); 54 units for monkey C and 25 units for monkey R). The period of 200–1,000 ms covered the choice epoch, avoiding visual onset transients present in the first 200 ms of PPC activity. Choice-MI varied significantly with LFP phases in the beta- and gamma-frequency ranges (permutation tests, PFWER < 0.05) (Fig. 3A) but not with theta phases. Repeating the analysis based on modulation entropy, which makes fewer distributional assumptions, yielded similar results (SI Materials and Methods and Fig. S3B). The information that PPC units carried in their firing rates varied along phases in beta and gamma frequencies. To understand better how the beta and gamma phases affected spiking and choice-MI, we next examined the degree to which each measure depended on LFP phase.
Fig. 3.
Choice information depends on beta and gamma LFP phases. (A) Modulation strength (resultant length of the complex average across phase bins) of choice-MI across a range of frequencies. The gray line depicts the significance threshold controlling the FWE across frequency bins at P = 0.05. Dark-shaded regions depict significant modulation of choice-MI. Lighter shading in the background depicts the beta- (12–30 Hz) and gamma- (40–60 Hz) frequency ranges. (B) Average phase-dependent histogram of spike count for the beta-frequency range. Coloring of the phase bins in all histograms corresponds to the schematic phase binning shown in the center. The spike-preferred phase (dark green) is depicted as a trough in the schematic to capture the tendency of spiking to occur at or near the troughs of LFP activity. The green bin at 0 corresponds to the average spike-preferred phase in the 200–1,000 ms epoch after target onset. The radial distance for each phase bin indicates the difference in spike count to random phases. Error bars depict 95% confidence intervals. The radial black line depicts the trigonometric moment of the histogram; the 95% confidence interval is indicated at the end of the line. (C) The graphical depiction shown in B but for choice-MI. Data at each phase bin are as in B. Filled circles indicate choice-MI significantly different from the average choice-MI across all phase bins (permutation test, P < 0.05). (D) As in C but after the removal of the influence of spike count on choice-MI through regression, thus, termed orthogonal-MI. (E–G) As in B–D, respectively, for the gamma-frequency range.
Fig. S3.
MI modulation entropy across frequencies. The black line shows the modulation entropy obtained across phases at different frequencies. The significance threshold is shown as a gray line. Background shadings depict the two frequency ranges of interest (beta and gamma).
Beta Activity Modulates Information and Spiking Separately.
We compared the distributions of spike counts and choice-MI according to beta and gamma activity in greater detail. To do so, we averaged the phase histograms of spike counts and choice-MI across the frequency bins with significantly modulated choice-MI within each frequency range (Fig. 3 B–G). In the beta-frequency band, the peak-to-trough modulation of spike counts was 13.6%, corresponding to a modulation in firing rate by about 6.6 spikes/s (Fig. 3B). Spiking was distributed symmetrically about the spike-preferred beta-phase with no significant differences in the amount of spiking between the bins before and after the spike-preferred beta-phase (permutation test, P = 0.99). Measuring the spike counts for evenly spaced beta-activity phase bins allowed us to study the temporal concentration (trigonometric moment) of spiking in great detail (see radial black lines in Fig. 3 B–F). The moment of the beta spike-count histogram was indistinguishable from the average spike-preferred beta phase during the analysis epoch, further indicating the symmetry of the distribution of spikes with beta-frequency phase.
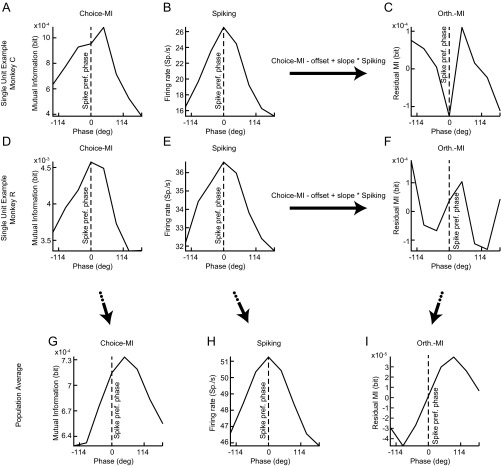
Choice-MI showed a peak-to-trough modulation by the beta activity of 15.3%. Unlike the spike counts, the choice-MI was asymmetric around the spike-preferred beta phase. The moment of the choice-MI histogram differed significantly from the moment of the beta spike-count histogram (permutation test, P < 10−4) with MI peaking during the downswing of the spiking cycle (Fig. 3C). In other words, spike count and choice-MI peaked at different times during the beta activity. In line with this asymmetry, choice-MI was significantly elevated above the average choice-MI for phase bins during the downswing of the beta activity and was significantly decreased for phase bins in the upswing of the beta activity (Fig. 3C, permutation tests, P < 0.05). To assess directly whether the beta activity varied with the spike counts and encoding properties of PPC neurons independently, we repeated the analysis after estimating an orthogonal-MI. To estimate the orthogonal-MI, we removed the spike-count histogram’s prediction about the shape of the choice-MI histogram for each unit through regression (Fig. 3D and Fig. S4). The orthogonal-MI histogram was significantly modulated (permutation test, P < 10−4). Thus, beta activity independently correlated with the spike counts and choice encoding of PPC units.
Fig. S4.
Single-unit examples of choice-MI, spiking, and the creation of the orthogonal MI histogram for the beta-frequency range. (A–C) Choice-MI, spiking, and orthogonal MI histograms for a single unit in monkey C. The orthogonal MI results from regressing out the shape of the spiking histogram from the choice-MI histogram on an individual spike–LFP pair basis. (D–F) As in A–C but for a single unit in monkey R. (G–I) Population average histograms of the measures. The selection of frequencies was according to the results presented in Fig. 3.
Information and Spike Counts Linked with Gamma Activity.
We repeated the above analyses for gamma activity (Fig. 3 E–G). The peak-to-trough modulation of spiking along the gamma phases was 6.2%, corresponding to a firing rate modulation of approximately three spikes/s. Similar to beta activity, the spike count was distributed symmetrically about the spike-preferred gamma phase (Fig. 3E). The moment of the spike-count histogram aligned with the average spike-preferred gamma phase. Peak-to-trough modulation of choice-MI by gamma activity was 12.3%. Choice-MI shared the same temporal concentration along gamma phases (Fig. 3F). We found no difference between the moments of choice-MI and spike count in the gamma activity (permutation test, P = 0.59). In line with this finding, the phase bin at the spike-preferred gamma phase exhibited significantly higher MI than the average histogram (permutation tests, P < 0.05). Choice-MI also was greater in the phase bin following the spike-preferred phase. The moment of choice-MI for gamma activity was significantly different from the moment of choice-MI for beta activity (permutation test, P = 10−4).
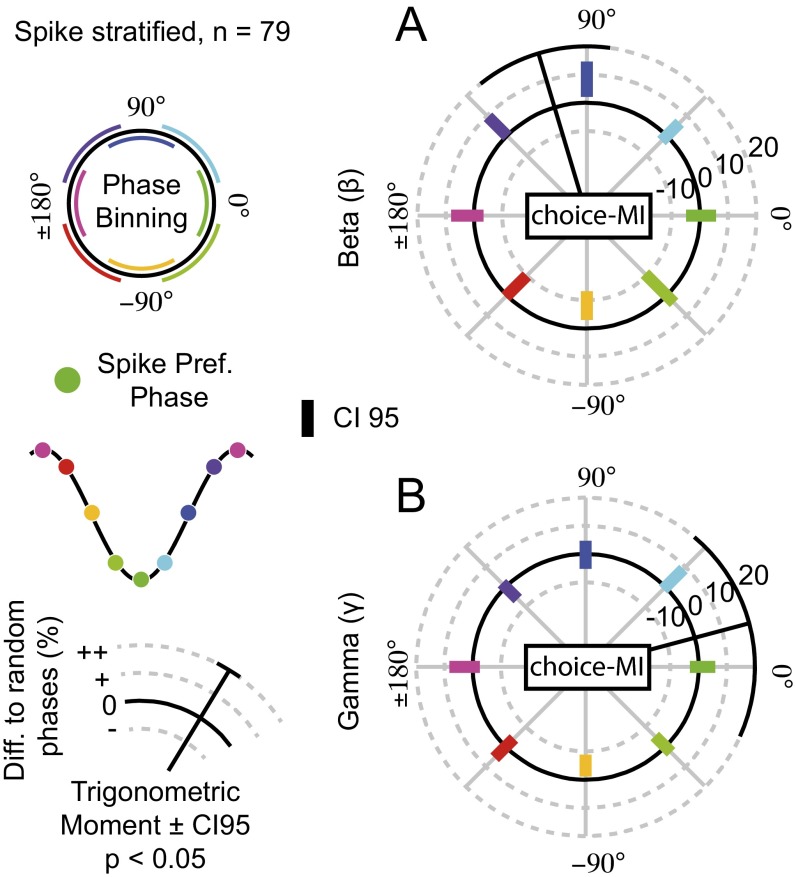
We then estimated the orthogonal-MI for gamma frequency activity (Fig. 3G). The orthogonal-MI for gamma activity was distributed uniformly across phase bins (permutation test, P = 0.30). No phase bin exhibited differences from the average orthogonal-MI across gamma-phase bins (permutation tests, all P > 0.05). Thus, correlations between gamma activity, choice-MI, and spike counts were not independent. MI estimation may have been biased by the differing spike counts at different phases of activity. MI is positively biased for smaller samples and is spuriously high for phase bins with few spikes. We reestimated MI while stratifying spike counts to be equal across phase bins (SI Materials and Methods). The pattern of modulated choice-MI by beta and gamma activity persisted (Fig. S5).
Fig. S5.
Spike-stratified phase-dependent choice-MI. (A and B) As in Fig. 3 C and F but for choice-MI that has been estimated with the same number of spikes at each phase bin. The selection of units and frequency bins for averaging are identical to those in Fig. 3 C and F. Black radial lines depict significant trigonometric moments of the histograms (permutation tests < 0.05) with the 95% confidence interval depicted at the end.
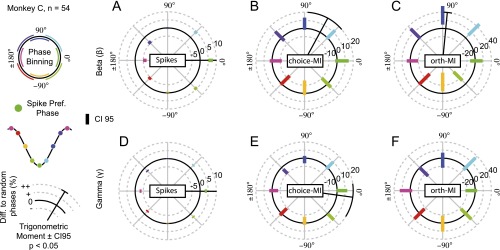
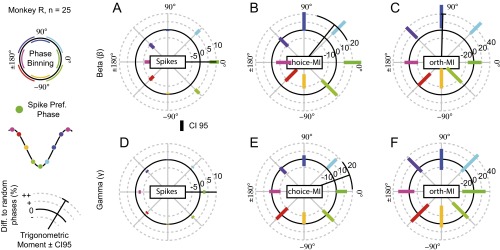
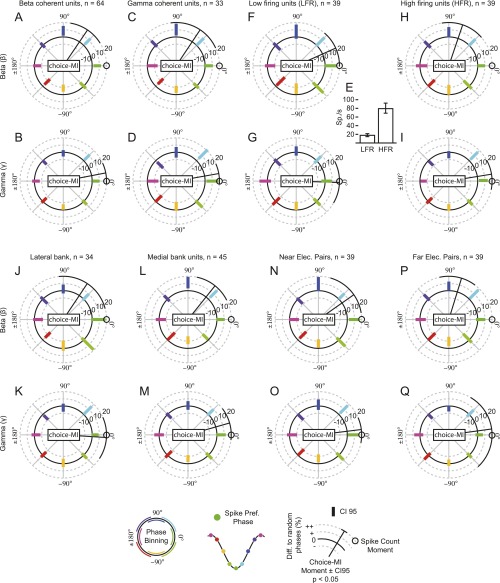
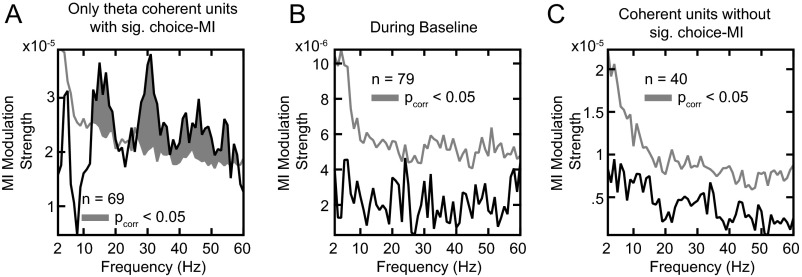
All results were consistent when the analyses were performed separately for each animal (Figs. S6 and S7). The pattern remained when selecting units based solely on beta or gamma coherence, low or high firing rates, the lateral and medial banks of the IPS, or near and far electrode pairs (Fig. S8). We found no significant relationship between theta LFP phases and choice-MI when repeating the analysis in Fig. 3A for units with significant theta-frequency SFC (Fig. S9A, permutation tests, PFWER > 0.05). Beta and gamma effects remained significant (permutation tests, PFWER < 0.05). The pulsed choice-MI was specific to the choice period as well as to units that encoded upcoming choices. It was absent during the baseline epoch and for coherent units without choice-MI (permutation tests, PFWER > 0.05) (Fig. S9 B and C). Overall, beta- and gamma-frequency activity modulated information about reward-guided decisions present in the firing rate. Although fluctuations in spike counts and information temporally coincided for the gamma activity, information peaked later than spiking for beta activity.
Fig. S6.
Phase-dependent spike counts and MI for monkey C. (A–F) As in Fig. 3 B–G but for all units of monkey C individually. Black radial lines depict significant trigonometric moments of the histograms (permutation tests < 0.05) with the 95% confidence interval depicted at the end.
Fig. S7.
Phase-dependent spike counts and MI for monkey R. (A–F) As in Fig. 3 B–G but for all units of monkey R individually. Black radial lines depict significant trigonometric moments of the histograms (permutation tests < 0.05) with the 95% confidence interval depicted at the end.
Fig. S8.
Phase-dependent MI histograms for subselections of units based on different properties. Phase-dependent choice-MI histograms are analogous to the analysis in Fig. 3 C and F but are for units selected solely based on beta coherence (A and B), gamma coherence (C and D), or a half split into low-firing rates (F and G) or high-firing rates (H and I), the lateral (J and K) and medial (L and M) banks of the IPS, or a half split into near (N and O) or far (P and Q) electrode tips. Black radial lines depict significant trigonometric moments of the histograms (permutation tests < 0.05) with the 95% confidence interval depicted at the end. For comparison we added the moment of the corresponding spike-count histograms as black circle. (E) Average firing rates of the two half-split groups of units in F–I. Error bars depict 95% confidence intervals.
Fig. S9.
MI modulation strength for other subsets of the data. (A) Results analogous to those presented in Fig. 3A but computed based on units selected for significant SFC in the theta range and significant choice-MI. (B) Results analogous to those presented in Fig. 3A but for the 500 ms before the onset of the choice targets. (C) An analysis analogous to that presented in Fig. 3A but for coherent units without significant choice-MI.
Beta Activity Couples Theta and Gamma Activity.
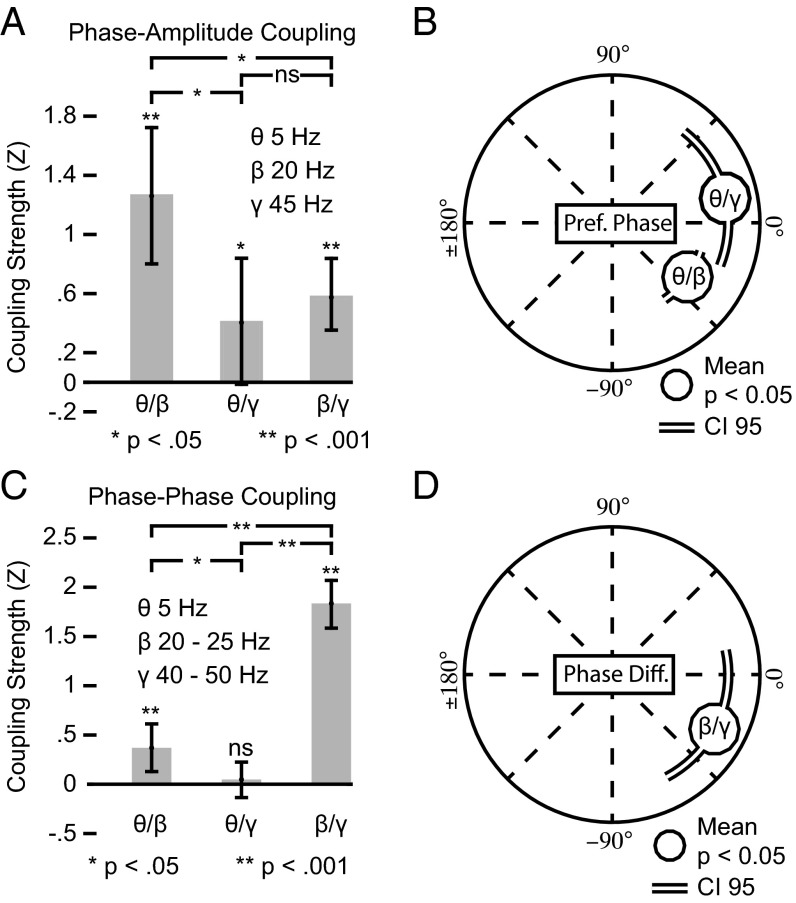
The coupling of PPC spiking to multiple time scales of activity suggested that the different frequency ranges might show consistent relationships among each other. To shed light on possible interactions between the different time scales, we quantified the cross-frequency phase–amplitude coupling (PAC) (36) and N:M phase–phase locking (NML) (37). We found that beta activity was strongly coupled to theta and gamma activity.
We analyzed the coupling strength and phase relationships for PAC and NML for all electrode pairs with significant SFC in the choice epoch (200–1,000 ms after target onset). We found significant PAC between theta phases and beta amplitudes (permutation test, P < 10−4) (Fig. 4A). PAC for theta phases and gamma amplitudes (permutation test, P = 0.031) and beta phases and gamma amplitudes (permutation test, P < 10−4) also was significant, albeit weaker (permutation tests, theta–beta vs. theta–gamma, P = 0.007; theta–beta vs. beta–gamma, P = 0.01; theta–gamma vs. beta–gamma, P = 0.48). In addition we found significant phase concentrations for the preferred PAC phases for the theta–beta and theta–gamma frequency combinations across the electrode pairs (Rayleigh tests: theta–beta, P < 10−5; theta–gamma, P = 0.007) (Fig. 4A). We found no significant concentration of the preferred PAC phase for the beta–gamma coupling (Rayleigh test, P = 0.22). Thus, the different time scales of PPC activity were nested with each other, with slower phases predicting faster amplitudes. The theta–beta PAC displayed the most pronounced interaction.
Fig. 4.
Cross-frequency relationships between theta, beta, and gamma activity. (A) Coupling strengths of PAC between frequencies. Asterisks above bars mark the levels of significance for the difference from zero. Comparisons between bars are indicated above brackets. (B) Preferred phases for the PAC. Circles represent significant mean concentrations (Rayleigh test, P < 0.05) across all electrode pairs, and lines depict their 95% confidence interval. (C) As in A for N:M phase–phase coupling. (D) As in B for the generalized phase difference of the N:M phase–phase coupling.
We further investigated whether the frequency ranges exhibited a consistent phase relationships among each other. Phases at different frequencies can be coupled when the frequencies are integer multiples of each other with several cycles of a faster time scale consistently occurring at the same times within one cycle of a slower time scale (37–39). Again we found pronounced cross-frequency interaction involving the beta activity (Fig. 4C). The strongest phase–phase coupling was between the beta and gamma phases (permutation test, P < 10−4) followed by significant but weaker coupling between theta and beta phases (permutation test, P < 10−4; beta–gamma vs. theta–beta, P < 10−4; beta–gamma vs. theta–gamma, P < 10−4; theta–beta vs. theta–gamma, P = 0.038). Theta phases were not significantly coupled with gamma phases (permutation test, P = 0.27). The beta–gamma phase coupling had a consistent phase difference across electrode pairs with beta phases slightly leading gamma phases (Rayleigh test, P = 0.008) (Fig. 4D). The beta–gamma phase difference seemed to match roughly the dissociation of the moment of the choice-MI from spiking for beta activity. Beta–gamma phase–phase coupling could contribute to the temporal localization of the choice-MI with respect to the beta activity. However, we observed no correlation between the beta–gamma phase difference and the moment of the beta choice-MI phase histogram on a single-spike LFP level (circular correlation, same electrode pairs from Fig. 3; n = 79, r = −0.063, P = 0.55). We found no consistent phase difference for the theta–beta phase–phase coupling across electrode pairs (Rayleigh test, P = 0.93). The different time scales also displayed significant phase relationships, with the most pronounced coupling between gamma and beta activity.
Overall, we identified three interrelated temporal modes of neuronal activity in the PPC. Beta activity took a central role and was most prominently coupled to slower theta activity through PAC and to faster gamma activity through phase–phase coupling.
SI Materials and Methods
Processing of Neural Data.
All off-line analyses were performed in MATLAB (MathWorks). Broadband (0.01–11 kHz) neural signals were acquired at 30 kHz. Following acquisition the raw signal was filtered into LFP (low-pass 400 Hz) and high-frequency (bandpass 300–6,600 Hz) components. After filtering, the LFP signal was down-sampled to 1 kHz. We extracted spike waveforms and multiunit activity from the high-frequency signal by extracting sections of the filtered signal (1.6 ms in duration) around times when the signal crossed a threshold set at 3.5 SDs below the mean filtered signal. We used a robust estimate of the SD. To isolate single-unit activity, we projected spike waveforms into a 3D principal component feature space on a moving 100-s time window. We used the unsupervised clustering algorithm k-means to over-cluster the spike waveforms. We then manually merged clusters that displayed clear separation from the multiunit cloud. Only time periods during the recording in which the single-unit cluster was clearly isolated from the multiunit cloud over the entire 100-s time window were accepted as single units. All clusters were verified by visual inspection off-line. For all analyses spikes and phases of the LFP were obtained from separate electrodes within the same area.
Behavioral Task.
We trained animals to perform movement tasks for fluid rewards. During each experimental session, monkeys first performed a center-out task and then a two-arm-bandit choice task. All analyses reported here are restricted to the choice task. To start a trial, the animals placed their hands on two proximity sensors placed at waist height. Central touch and fixation targets were displayed (red and green squares side-by-side, 2° visual angle on a side, green on left) at which the animals had to assume and maintain touch and fixation for 500–800 ms (uniform distribution). In the choice task a yellow triangle and a diametrically opposed yellow circle were displayed at an eccentricity of 10° visual angle. One target position corresponded to the direction of the response field of a recorded neuron, and shapes were placed randomly into either target position at each trial. The yellow color cued the animal to perform a combined reach-and-saccade movement to a target after an instructed delay period of 1,000–1,500 ms (uniform distribution). At the end of the delay period the central stimuli were extinguished, signaling the animal to execute the movement. All analyses reported here are limited to the touch-and-fixation and delay period described above. The animals performed an additional delay period in subsets of the data as described elsewhere (13). The target shapes cued noisy reward magnitudes, and the animals were free to choose to move toward either shape on every trial. The mean reward magnitudes for each shape remained constant for 50–60 trials and then transitioned to a new mean magnitude in an unsignaled fashion (Fig. S1). The mean magnitudes for the two shapes could assume one of the following three constellations with each shape possibly assuming either value: 0.067 mL vs. 0.137 mL, 0.085 mL vs. 0.120 mL, and 0.099 mL vs. 0.106 mL. On each trial a Gaussian-distributed variability (mean 0, SD 0.014 mL) was added to the magnitude associated with both targets trial by trial. The data analyzed here encompassed 16,123 trials (monkey C) and 11,440 trials (monkey R) that the animals performed on the choice task. To reveal the lawful relation between reward magnitudes and choice behavior, we binned the single-trial reward differences between the shapes into six bins (after normalizing the rewards within each day to range from 0 to 1) and fit a psychometric function to the choice probabilities across bins
where Pcircle is the probability of the animal choosing the circle shape and R is the magnitude of the difference in the reward between the circle and triangle shape. We obtained maximum likelihood estimates of the four parameters a, b, c, and d that characterized the horizontal offset (d), the vertical offset (a), the slope (c), and the amplitude (d).
Spectral Analyses.
We estimated spectral densities, oscillatory phases, and SFC throughout all analyses using multitaper methods (time/bandwidth parameters: 500 ms and 5 Hz) (66, 67). To estimate the oscillatory amplitudes for the PAC analysis, we used different time/bandwidth parameters (250 ms and 10 Hz). For the baseline epoch we used the 500 ms immediately preceding the onset of the choice targets. For the choice epoch we analyzed the period from 200–700 ms after target presentation. To determine which spike-field pairs had significant SFC, we used a random permutation test to compare the magnitude of the SFC within a frequency range of 2–60 Hz (59 frequency bins) against an empirical null distribution obtained by separately permuting spike trials and LFP trials (10,000 permutations). We controlled the FWE rate across all frequency bins and LFP recordings (maximum 2) for each spike recording by comparing the SFC against the 95th percentile of the rank-based maximum statistical resample distribution (68, 69). The resample distribution at each frequency was obtained by first establishing the maximum rank occurring at each resample across all frequencies and LFP electrodes. The rank of a resample was the position in a sorted version of the resamples within each frequency. We then selected the actual resamples for each frequency according to this maximum rank distribution. In other words, we went through the list of maximum ranks occurring at each resample and for each frequency selected the frequency-specific resample corresponding to this rank. This procedure ensures that the maximum resample distribution is not biased by largely different distributions across frequencies. For example, if particular frequencies exhibited very large effects compared with others, these frequencies would dominate the maximum resample distribution because they would be selected as maximum resamples more often, effectively lowering the degrees of freedom of the resample distribution.
Based on these tests, we labeled a unit as coherent if at least one frequency bin exhibited significant SFC. Where we recorded LFP activity on multiple electrodes, we chose the LFP recording with the maximum number of significant SFC frequency bins for further analyses.
We tested for differences in SFC and signal power between the baseline and choice epochs using a random permutation test (10,000 permutations). We controlled the FDR at P < 0.05 for the tests between the two intervals (70).
We chose eight evenly spaced phase bins to assess the phase-dependence of MI. Phase bins were centered at zero and every π/4 steps with a width of π/3. For subsequent analysis, estimated phases were rotated so that zero corresponded to the average spike-preferring phase Ψ across all n spike-associated phases ψ within the analysis window
MI.
We studied the encoding properties of neurons’ firing rates by quantifying the MI between the spiking of a neuron S and the movement condition C (in or out of response field)
To derive the marginal and conditional probabilities of spiking and movement condition, we created two binary matrices that represented the presence of a spike and the movement condition, respectively, for each time point and trial at 1-kHz sampling. We resolved MI in time by computing the respective probabilities across trials within a sliding 100-ms window and a step size of 10 ms. We labeled a unit as informative about choice by comparing the MI 200–1,000 ms after target onset against an empirical resample distribution obtained by permuting the association between spike trains and movement conditions across trials (10,000 permutations).
To study the phase-dependence of MI, we analyzed the activity units that exhibited coherent activity during the choice interval and were informative about choice (see above) in the interval 200–1,000 ms after target onset.
To estimate phase-dependent MI, we estimated the marginal and conditional probabilities for times when the phase of the LFP recording fell within each phase bin. To achieve even sampling across all phase bins, the estimation of the probabilities for each phase bin was restricted to occur over the lowest number of samples across all phase bins (nmin). We then used a bootstrapping procedure to estimate the average amount of MI for each phase bin. We randomly drew nmin samples from all samples at a given phase bin 1,000 times to create MI resamples and averaged across all resamples to obtain the average MI at a phase bin.
We tested whether the MI is modulated by oscillatory phases using permutation statistics based on the resultant length R, also called “modulation strength,” across the n bins of the phase histograms at different frequencies f within 2–60 Hz (59 frequency bins)
where the complex number I represents the quantity Q (average MI across units) as well as the center phase φ of phase bin k for frequency f
To test for significant modulation strength we compared Rf against an empirical resample distribution obtained by randomly shuffling the association between the quantities Q and phases φ for each unit before averaging the quantities within phase bins across units (10,000 permutations). We controlled the FWE across frequencies using rank-based maximum resample statistics (68, 69).
We further assessed the distribution of MI and spike counts across the phase bins for two frequency ranges, beta and gamma, in greater detail. To do so, we first obtained a frequency-averaged phase histogram for each unit by averaging the quantities Q within each phase bin across frequency bins that exhibited significant MI modulation strength (see above) and fell into the frequency ranges of interest (beta, 12–30 Hz; gamma, 40–60 Hz). To test whether the trigonometric moment of the MI phase-dependent histogram is different from the trigonometric moment of the spike count phase-dependent histogram, we obtained the trigonometric moment M of a histogram by averaging across its n bins
The difference in moments between the histogram of the spike count MSC and the MI MMI then was given by
To test for a difference in the trigonometric moments between MI and spike count, we compared the actual difference in moments to an empirical resample distribution of differences in moments. We obtained the resample distribution by randomly exchanging the quantities Q between phase bins of the two histograms before calculating the moments. To account for the differences in the distributions of quantities between MI and spike count, we normalized all quantities such that the integral of each histogram equaled 1 before performing the above analyses.
Because the mean resultant length R assumes a unimodal concentration of quantities across phase bins, it is insensitive to more complex forms of modulation such as multimodal modulations. Thus we repeated the analysis of modulation strength across frequencies using permutation statistics based on the entropy (nonuniformity) H of the phase-dependent histogram (71)
Here p represents the relative MI at each phase bin k across all n phase bins for frequency f obtained by dividing the MI at each phase bin by the sum across phase bins. We subsequently normalized Hf by the maximum entropy to obtain the modulation entropy (Fig. S3)
where the maximum entropy reflects the entropy under the uniform distribution. We derived the significance threshold for the modulation entropy using the same permutation procedures as for the modulation strength described above.
To control for confounding associations between the amount of spiking and MI, we also performed the above analysis while stratifying the number of spikes at each phase bin. To do so, we randomly deleted spikes in excess of the minimum observed spike count across phase bins and then computed the MI at a given phase bin. We repeated this procedure 1,000 times and averaged the observed MI at each phase bin. In addition we studied energy in the histograms unrelated to the spike count by removing the linear prediction of the MI by the spike count through linear regression (see Fig. 3, choice-MI and orthogonal-MI, and Fig. S4 for an example).
Cross-Frequency Coupling.
To study the interaction between theta, beta, and gamma activities, we quantified the cross-frequency PAC (36, 56) and NML (37) between LFP activity in the theta (5 Hz), beta (20–25 Hz), and gamma (40–50 Hz) frequency ranges. Both types of coupling were estimated across different electrodes. For each frequency pairing we estimated the lower frequency at the LFP-delivering electrode and the higher frequency at the spiking electrode. We filtered the LFP signals (time/bandwidth parameters: 500 ms and 5 Hz for phases and 250 ms and 10 Hz for amplitudes) in the epoch 200–1,000 ms after target onset into the frequency components.
To quantify PAC, we constructed a complex signal for each frequency pair Sf1,f2 consisting of the combined instantaneous amplitude A at frequency f1 and phase estimates P at frequency f2 at each time point (1,000-Hz sampling), trial, and electrode pair
We then obtained the coupling strength CSPAC and preferred coupling phase PPPAC for each frequency and electrode pair as the resultant length and argument of the average across all samples T of Sf1,f2, respectively
To test for significance of the strength of the PAC, we first converted the coupling strength nonparametrically to z-scores for each electrode pair using permutation statistics. We shuffled the trials of the amplitude and phase signals randomly before constructing Sf1,f2 (10,000 permutations) and computed the coupling strength. We then converted the raw coupling strength to a z-score according to its rank within this resample distribution, giving a normalized coupling strength with an expected value of 0 under the null hypothesis. To test for significant cross-frequency coupling, we tested whether the normalized coupling strength across electrode pairs was significantly greater than zero with a permutation test.
To quantify cross-frequency phase–phase coupling, we used a phase-locking statistic for the generalized phase difference between the different frequency bands (37). Two oscillations at the different frequencies f1 and f2 where n*f1 = m*f2 for integers n and m are phase coupled if the distribution of their generalized phase differences n*θ1 – m*θ2 is nonuniform. We quantified the average phase–phase coupling between theta (5 Hz) and beta [20, 25 Hz, n = (4 5)], theta (5 Hz) and gamma [40, 50 Hz, n = (8 10)], and beta (20, 25 Hz) and gamma (40, 50, n = 2) frequencies.
As with the PAC, we first constructed a time-resolved signal of the phase differences PD for each frequency and electrode pair
where
We then obtained the coupling strength CSNML and the preferred phase difference PPNML for the phase–phase coupling as the resultant length and argument of the complex average of the phase differences
We used the procedures described for CSPAC to test for significantly nonzero phase–phase coupling strength CSNML between oscillations. The normalized CSNML and the phase differences PPNML were averaged across frequency pairs within frequency ranges of interest (e.g., 5–20 Hz, 5–25 Hz) for each electrode pair before performing group statistics across electrode pairs.
Discussion
Our findings demonstrate a potential role for temporal coding in the PPC during the formation of decisions and add to a growing body of evidence linking firing rate information to ongoing population dynamics in cortex (35, 40–48). Theta-, beta-, and gamma-band LFP phases patterned spiking activity but had different relations to decision information. Gamma activity encoded task information at phases with the greatest spike rate. In contrast, beta activity encoded task information at phases when local populations were not the most active. Theta-band activity appeared as a relatively nonspecific influence on PPC spiking. We propose that differences in the timing of task information and activity patterns may be a general signature of distributed computations across decision networks.
Beta and gamma activity showed a direct relation to the decision process and were modulated by the onset of decisions. The phases across both frequency regimes were coherent with each other and provided a meaningful temporal reference for decoding decision information contained in PPC neurons’ firing rates. These observations generally agree with recent findings positing that beta and gamma activity reflect different network-level processes. Specifically, gamma activity may reflect bottom-up–driven local processing, and beta activity may reflect top-down–driven processes that link local information to processing on a larger cortical scale (31, 49–52). The coherent relationship we observe between the gamma and beta activity suggests that decision signals in the PPC arise in the interaction between these two types of influences. An intriguing possibility is that PPC spiking may multiplex decision signals into beta and gamma channels (53).
Consistent with the view that beta and gamma activity reflect two different network-level processes, we found that both choice information and spike counts were temporally aligned with gamma activity but choice information peaked later than the spike counts for the beta activity. These observations may reflect the more local nature of the gamma activity operating on faster, more immediate scales. In contrast, beta activity may be tuned to larger network scales, leading to a separation between choice information and excitability.
Theta activity was present throughout the trial and at comparable levels before and after choice target onset. Theta phases did exhibit a weak relationship to the encoding properties of PPC firing rates. However, theta phases predicted beta and gamma frequency amplitudes during the choice epoch. These observations are in line with the view that theta-band activity may regulate activity on faster time scales (54, 55), potentially to subserve functions (e.g., mnemonic functions) in the interaction with subcortical or allocortical brain structures with prominent theta activity (56–58).
Our observations agree well with previous reports on the impact of temporal structure on firing rate encoding in the primate cortex. During visual stimulation in primate primary visual cortex (48), the gamma activity enhances selectivity, primarily at around peak excitability. However, during working memory demands in primate prefrontal cortex (47), information about sequentially presented objects occurs at different times with respect to the beta activity.
The dissociation that we observe between spike counts and choice information for beta activity raises questions about how the activity can be generated and how other neuronal populations can decode such activity efficiently. Specific spike times within temporally structured activity patterns can result from the interplay between excitatory drive and inhibition (40–42, 59, 60). Our results thus suggest that beta spiking in the PPC results from an asymmetric interaction between excitation and inhibition, producing a relatively less informative upswing and a more informative downswing of activity with similar activity magnitudes.
The transmission of activity between neuronal ensembles may benefit from the alignment of excitability phases in downstream neurons with barrages of synchronized upstream activity (30, 31, 61–65). Our findings are consistent with this view and suggest that beta and gamma activity may differ in the window of integration by downstream ensembles. Although the gamma activity may be most informative when spiking is greatest, the integration period for the beta activity may extend past the time of greatest synchronous activity to include a later period of peak information. In this way, the computations in the PPC may be functionally linked to the distributed ensembles underlying the formation of decisions (9, 13). In summary, we propose that the relative timing of local spiking and choice information reveals a temporal reference for computations across local and large-scale decision networks.
Materials and Methods
Please see SI Materials and Methods for a detailed description of the experimental setup and analytic methods. The experimental setup has been reported previously (13). Two adult male rhesus macaques (Macaca mulatta), monkey C (7.5 kg) and monkey R (6 kg), participated in this study. All surgical and animal care procedures were approved by the New York University Animal Care and Use Committee and were performed in accordance with the National Institutes of Health guidelines for the care and use of laboratory animals. Neuronal activity was recorded from the medial and lateral banks of the IPS up to ∼1 cm anterior to the lunate and parietal occipital sulci and ∼5–10 mm below the cortical surface (13). We targeted a square 16 × 16 mm recording chamber over the right IPS in monkey C [MRI-guided stereotaxic (Brainsight; Rogue Research)] and over the left IPS in monkey R (stereotactic coordinates: 7 P, 13 L). Electrodes were spaced at least 1 mm (median, 2.09 mm) apart. Recordings were referenced to the metal guide tube on the dura touching the cortical surface above the recording sites. Spectral estimates were derived using multitaper methods (time/bandwidth parameters, 500 ms and 5 Hz) (66, 67). Amplitudes for the PAC were estimated at 20 Hz and 45 Hz with time/bandwidth parameters of 250 ms and 10 Hz. We removed the influence of trial-locked evoked potentials through regression from each trial before further analysis. For phase-dependent estimates we used eight phase bins centered at 0 and every π/4 steps with a width of π/3. We controlled the PFWER or the PFDR when multiple testing. For permutation tests the PFWER was controlled using rank-based maximum resample statistics (68, 69).
Acknowledgments
We thank Jorge Jaramillo and Timo van Kerkoele for helpful comments on the manuscript. This work was supported by the Leopoldina Fellowship Programme Grant (LPDS/LPDR 2012-09), NIH Grant R01 EY024067, National Science Foundation CAREER Award BCS-0955701, an award from the Simons Collaboration for the Global Brain, and the Defense Advanced Research Projects Agency Systems-Based Neurotechnology for Emerging Therapies Program.
Footnotes
The authors declare no conflict of interest.
This article is a PNAS Direct Submission.
This article contains supporting information online at www.pnas.org/lookup/suppl/doi:10.1073/pnas.1606479113/-/DCSupplemental.
References
- 1.Snyder LH, Batista AP, Andersen RA. Coding of intention in the posterior parietal cortex. Nature. 1997;386(6621):167–170. doi: 10.1038/386167a0. [DOI] [PubMed] [Google Scholar]
- 2.Batista a. P, Buneo CA, Snyder LH, Andersen RA. Reach plans in eye-centered coordinates. Science. 1999;285(5425):257–260. doi: 10.1126/science.285.5425.257. [DOI] [PubMed] [Google Scholar]
- 3.Shadlen MN, Newsome WT. Neural basis of a perceptual decision in the parietal cortex (area LIP) of the rhesus monkey. J Neurophysiol. 2001;86(4):1916–1936. doi: 10.1152/jn.2001.86.4.1916. [DOI] [PubMed] [Google Scholar]
- 4.Huk AC, Shadlen MN. Neural activity in macaque parietal cortex reflects temporal integration of visual motion signals during perceptual decision making. J Neurosci. 2005;25(45):10420–10436. doi: 10.1523/JNEUROSCI.4684-04.2005. [DOI] [PMC free article] [PubMed] [Google Scholar]
- 5.Cui H, Andersen RA. Posterior parietal cortex encodes autonomously selected motor plans. Neuron. 2007;56(3):552–559. doi: 10.1016/j.neuron.2007.09.031. [DOI] [PMC free article] [PubMed] [Google Scholar]
- 6.Gold JI, Shadlen MN. The neural basis of decision making. Annu Rev Neurosci. 2007;30:535–574. doi: 10.1146/annurev.neuro.29.051605.113038. [DOI] [PubMed] [Google Scholar]
- 7.Scherberger H, Andersen RA. Target selection signals for arm reaching in the posterior parietal cortex. J Neurosci. 2007;27(8):2001–2012. doi: 10.1523/JNEUROSCI.4274-06.2007. [DOI] [PMC free article] [PubMed] [Google Scholar]
- 8.Bisley JW, Goldberg ME. Attention, intention, and priority in the parietal lobe. Annu Rev Neurosci. 2010;33:1–21. doi: 10.1146/annurev-neuro-060909-152823. [DOI] [PMC free article] [PubMed] [Google Scholar]
- 9.Dean HL, Hagan MA, Pesaran B. Only coherent spiking in posterior parietal cortex coordinates looking and reaching. Neuron. 2012;73(4):829–841. doi: 10.1016/j.neuron.2011.12.035. [DOI] [PMC free article] [PubMed] [Google Scholar]
- 10.Hagan MA, Dean HL, Pesaran B. Spike-field activity in parietal area LIP during coordinated reach and saccade movements. J Neurophysiol. 2012;107(5):1275–1290. doi: 10.1152/jn.00867.2011. [DOI] [PMC free article] [PubMed] [Google Scholar]
- 11.de Lafuente V, Jazayeri M, Shadlen MN. Representation of accumulating evidence for a decision in two parietal areas. J Neurosci. 2015;35(10):4306–4318. doi: 10.1523/JNEUROSCI.2451-14.2015. [DOI] [PMC free article] [PubMed] [Google Scholar]
- 12.Latimer KW, Yates JL, Meister MLR, Huk AC, Pillow JW. Single-trial spike trains in parietal cortex reveal discrete steps during decision-making. Science. 2015;349(6244):184–187. doi: 10.1126/science.aaa4056. [DOI] [PMC free article] [PubMed] [Google Scholar]
- 13.Wong YT, Fabiszak MM, Novikov Y, Daw ND, Pesaran B. Coherent neuronal ensembles are rapidly recruited when making a look-reach decision. Nat Neurosci. 2016;19(2):327–334. doi: 10.1038/nn.4210. [DOI] [PMC free article] [PubMed] [Google Scholar]
- 14.Platt ML, Glimcher PW. Neural correlates of decision variables in parietal cortex. Nature. 1999;400(6741):233–238. doi: 10.1038/22268. [DOI] [PubMed] [Google Scholar]
- 15.Dorris MC, Glimcher PW. Activity in posterior parietal cortex is correlated with the relative subjective desirability of action. Neuron. 2004;44(2):365–378. doi: 10.1016/j.neuron.2004.09.009. [DOI] [PubMed] [Google Scholar]
- 16.Sugrue LP, Corrado GS, Newsome WT. Matching behavior and the representation of value in the parietal cortex. Science. 2004;304(5678):1782–1787. doi: 10.1126/science.1094765. [DOI] [PubMed] [Google Scholar]
- 17.Seo H, Barraclough DJ, Lee D. Lateral intraparietal cortex and reinforcement learning during a mixed-strategy game. J Neurosci. 2009;29(22):7278–7289. doi: 10.1523/JNEUROSCI.1479-09.2009. [DOI] [PMC free article] [PubMed] [Google Scholar]
- 18.Louie K, Glimcher PW. Separating value from choice: Delay discounting activity in the lateral intraparietal area. J Neurosci. 2010;30(16):5498–5507. doi: 10.1523/JNEUROSCI.5742-09.2010. [DOI] [PMC free article] [PubMed] [Google Scholar]
- 19.Kiani R, Shadlen MN. Representation of confidence associated with a decision by neurons in the parietal cortex. Science. 2009;324(5928):759–764. doi: 10.1126/science.1169405. [DOI] [PMC free article] [PubMed] [Google Scholar]
- 20.Samejima K, Ueda Y, Doya K, Kimura M. Representation of action-specific reward values in the striatum. Science. 2005;310(5752):1337–1340. doi: 10.1126/science.1115270. [DOI] [PubMed] [Google Scholar]
- 21.Pesaran B, Nelson MJ, Andersen RA. Free choice activates a decision circuit between frontal and parietal cortex. Nature. 2008;453(7193):406–409. doi: 10.1038/nature06849. [DOI] [PMC free article] [PubMed] [Google Scholar]
- 22.Kable JW, Glimcher PW. The neurobiology of decision: Consensus and controversy. Neuron. 2009;63(6):733–745. doi: 10.1016/j.neuron.2009.09.003. [DOI] [PMC free article] [PubMed] [Google Scholar]
- 23.Cisek P, Kalaska JF. Neural mechanisms for interacting with a world full of action choices. Annu Rev Neurosci. 2010;33:269–298. doi: 10.1146/annurev.neuro.051508.135409. [DOI] [PubMed] [Google Scholar]
- 24.Siegel M, Buschman TJ, Miller EK. Cortical information flow during flexible sensorimotor decisions. Science. 2015;348(6241):1352–1355. doi: 10.1126/science.aab0551. [DOI] [PMC free article] [PubMed] [Google Scholar]
- 25.Katz LN, Yates JL, Pillow JW, Huk AC. Dissociated functional significance of decision-related activity in the primate dorsal stream. Nature. 2016;535(7611):285–288. doi: 10.1038/nature18617. [DOI] [PMC free article] [PubMed] [Google Scholar]
- 26.Bressler SL, Menon V. Large-scale brain networks in cognition: Emerging methods and principles. Trends Cogn Sci. 2010;14(6):277–290. doi: 10.1016/j.tics.2010.04.004. [DOI] [PubMed] [Google Scholar]
- 27.Buzsáki G, Chrobak JJ. Temporal structure in spatially organized neuronal ensembles: A role for interneuronal networks. Curr Opin Neurobiol. 1995;5(4):504–510. doi: 10.1016/0959-4388(95)80012-3. [DOI] [PubMed] [Google Scholar]
- 28.Buzsáki G, Draguhn A. Neuronal oscillations in cortical networks. Science. 2004;304(5679):1926–1929. doi: 10.1126/science.1099745. [DOI] [PubMed] [Google Scholar]
- 29.Engel AK, Fries P, Singer W. Dynamic predictions: Oscillations and synchrony in top-down processing. Nat Rev Neurosci. 2001;2(10):704–716. doi: 10.1038/35094565. [DOI] [PubMed] [Google Scholar]
- 30.Fries P. A mechanism for cognitive dynamics: Neuronal communication through neuronal coherence. Trends Cogn Sci. 2005;9(10):474–480. doi: 10.1016/j.tics.2005.08.011. [DOI] [PubMed] [Google Scholar]
- 31.Fries P. Rhythms for Cognition: Communication through coherence. Neuron. 2015;88(1):220–235. doi: 10.1016/j.neuron.2015.09.034. [DOI] [PMC free article] [PubMed] [Google Scholar]
- 32.Salinas E, Sejnowski TJ. Correlated neuronal activity and the flow of neural information. Nat Rev Neurosci. 2001;2(8):539–550. doi: 10.1038/35086012. [DOI] [PMC free article] [PubMed] [Google Scholar]
- 33.Varela F, Lachaux JP, Rodriguez E, Martinerie J. The brainweb: Phase synchronization and large-scale integration. Nat Rev Neurosci. 2001;2(4):229–239. doi: 10.1038/35067550. [DOI] [PubMed] [Google Scholar]
- 34.Womelsdorf T, Fries P. Neuronal coherence during selective attentional processing and sensory-motor integration. J Physiol Paris. 2006;100(4):182–193. doi: 10.1016/j.jphysparis.2007.01.005. [DOI] [PubMed] [Google Scholar]
- 35.O’Keefe J, Recce ML. Phase relationship between hippocampal place units and the EEG theta rhythm. Hippocampus. 1993;3(3):317–330. doi: 10.1002/hipo.450030307. [DOI] [PubMed] [Google Scholar]
- 36.Canolty RT, et al. High gamma power is phase-locked to theta oscillations in human neocortex. Science. 2006;313(5793):1626–1628. doi: 10.1126/science.1128115. [DOI] [PMC free article] [PubMed] [Google Scholar]
- 37.Tass P, et al. Detection of n:m phase locking from noisy data: Application to magnetoencephalography. Phys Rev Lett. 1998;81(15):3291–3294. [Google Scholar]
- 38.Palva JM, Palva S, Kaila K. Phase synchrony among neuronal oscillations in the human cortex. J Neurosci. 2005;25(15):3962–3972. doi: 10.1523/JNEUROSCI.4250-04.2005. [DOI] [PMC free article] [PubMed] [Google Scholar]
- 39.Belluscio MA, Mizuseki K, Schmidt R, Kempter R, Buzsáki G. Cross-frequency phase-phase coupling between θ and γ oscillations in the hippocampus. J Neurosci. 2012;32(2):423–435. doi: 10.1523/JNEUROSCI.4122-11.2012. [DOI] [PMC free article] [PubMed] [Google Scholar]
- 40.König P, Engel AK, Roelfsema PR, Singer W. How precise is neuronal synchronization? Neural Comput. 1995;7(3):469–485. doi: 10.1162/neco.1995.7.3.469. [DOI] [PubMed] [Google Scholar]
- 41.Mehta MR, Lee AK, Wilson MA. Role of experience and oscillations in transforming a rate code into a temporal code. Nature. 2002;417(6890):741–746. doi: 10.1038/nature00807. [DOI] [PubMed] [Google Scholar]
- 42.Brody CD, Hopfield JJ. Simple networks for spike-timing-based computation, with application to olfactory processing. Neuron. 2003;37(5):843–852. doi: 10.1016/s0896-6273(03)00120-x. [DOI] [PubMed] [Google Scholar]
- 43.Lee H, Simpson GV, Logothetis NK, Rainer G. Phase locking of single neuron activity to theta oscillations during working memory in monkey extrastriate visual cortex. Neuron. 2005;45(1):147–156. doi: 10.1016/j.neuron.2004.12.025. [DOI] [PubMed] [Google Scholar]
- 44.Montemurro MA, Rasch MJ, Murayama Y, Logothetis NK, Panzeri S. Phase-of-firing coding of natural visual stimuli in primary visual cortex. Curr Biol. 2008;18(5):375–380. doi: 10.1016/j.cub.2008.02.023. [DOI] [PubMed] [Google Scholar]
- 45.Kayser C, Montemurro MA, Logothetis NK, Panzeri S. Spike-phase coding boosts and stabilizes information carried by spatial and temporal spike patterns. Neuron. 2009;61(4):597–608. doi: 10.1016/j.neuron.2009.01.008. [DOI] [PubMed] [Google Scholar]
- 46.Kayser C, Ince RAA, Panzeri S. Analysis of slow (theta) oscillations as a potential temporal reference frame for information coding in sensory cortices. PLOS Comput Biol. 2012;8(10):e1002717. doi: 10.1371/journal.pcbi.1002717. [DOI] [PMC free article] [PubMed] [Google Scholar]
- 47.Siegel M, Warden MR, Miller EKE. Phase-dependent neuronal coding of objects in short-term memory. Proc Natl Acad Sci USA. 2009;106(50):21341–21346. doi: 10.1073/pnas.0908193106. [DOI] [PMC free article] [PubMed] [Google Scholar]
- 48.Womelsdorf T, et al. Orientation selectivity and noise correlation in awake monkey area V1 are modulated by the gamma cycle. Proc Natl Acad Sci USA. 2012;109(11):4302–4307. doi: 10.1073/pnas.1114223109. [DOI] [PMC free article] [PubMed] [Google Scholar]
- 49.Donner TH, Siegel M. A framework for local cortical oscillation patterns. Trends Cogn Sci. 2011;15(5):191–199. doi: 10.1016/j.tics.2011.03.007. [DOI] [PubMed] [Google Scholar]
- 50.Hipp JF, Engel AK, Siegel M. Oscillatory synchronization in large-scale cortical networks predicts perception. Neuron. 2011;69(2):387–396. doi: 10.1016/j.neuron.2010.12.027. [DOI] [PubMed] [Google Scholar]
- 51.van Kerkoerle T, et al. Alpha and gamma oscillations characterize feedback and feedforward processing in monkey visual cortex. Proc Natl Acad Sci USA. 2014;111(40):14332–14341. doi: 10.1073/pnas.1402773111. [DOI] [PMC free article] [PubMed] [Google Scholar]
- 52.Bastos AM, et al. Visual areas exert feedforward and feedback influences through distinct frequency channels. Neuron. 2015;85(2):390–401. doi: 10.1016/j.neuron.2014.12.018. [DOI] [PubMed] [Google Scholar]
- 53.Akam T, Kullmann DM. Oscillatory multiplexing of population codes for selective communication in the mammalian brain. Nat Rev Neurosci. 2014;15(2):111–122. doi: 10.1038/nrn3668. [DOI] [PMC free article] [PubMed] [Google Scholar]
- 54.Lakatos P, et al. An oscillatory hierarchy controlling neuronal excitability and stimulus processing in the auditory cortex. J Neurophysiol. 2005;94(3):1904–1911. doi: 10.1152/jn.00263.2005. [DOI] [PubMed] [Google Scholar]
- 55.Canolty RT, Knight RT. The functional role of cross-frequency coupling. Trends Cogn Sci. 2010;14(11):506–515. doi: 10.1016/j.tics.2010.09.001. [DOI] [PMC free article] [PubMed] [Google Scholar]
- 56.Bragin A, et al. Gamma (40-100 Hz) oscillation in the hippocampus of the behaving rat. J Neurosci. 1995;15(1 Pt 1):47–60. doi: 10.1523/JNEUROSCI.15-01-00047.1995. [DOI] [PMC free article] [PubMed] [Google Scholar]
- 57.Sirota A, et al. Entrainment of neocortical neurons and gamma oscillations by the hippocampal theta rhythm. Neuron. 2008;60(4):683–697. doi: 10.1016/j.neuron.2008.09.014. [DOI] [PMC free article] [PubMed] [Google Scholar]
- 58.Lisman JE, Jensen O. The θ-γ neural code. Neuron. 2013;77(6):1002–1016. doi: 10.1016/j.neuron.2013.03.007. [DOI] [PMC free article] [PubMed] [Google Scholar]
- 59.Fries P, Nikolić D, Singer W. The gamma cycle. Trends Neurosci. 2007;30(7):309–316. doi: 10.1016/j.tins.2007.05.005. [DOI] [PubMed] [Google Scholar]
- 60.Wang X-J. Neurophysiological and computational principles of cortical rhythms in cognition. Physiol Rev. 2010;90(3):1195–1268. doi: 10.1152/physrev.00035.2008. [DOI] [PMC free article] [PubMed] [Google Scholar]
- 61.König P, Engel AK, Singer W. Integrator or coincidence detector? The role of the cortical neuron revisited. Trends Neurosci. 1996;19(4):130–137. doi: 10.1016/s0166-2236(96)80019-1. [DOI] [PubMed] [Google Scholar]
- 62.Azouz R, Gray CM. Adaptive coincidence detection and dynamic gain control in visual cortical neurons in vivo. Neuron. 2003;37(3):513–523. doi: 10.1016/s0896-6273(02)01186-8. [DOI] [PubMed] [Google Scholar]
- 63.Bruno RM, Sakmann B. Cortex is driven by weak but synchronously active thalamocortical synapses. Science. 2006;312(5780):1622–1627. doi: 10.1126/science.1124593. [DOI] [PubMed] [Google Scholar]
- 64.Nadasdy Z. Information encoding and reconstruction from the phase of action potentials. Front Syst Neurosci. 2009;3:6. doi: 10.3389/neuro.06.006.2009. [DOI] [PMC free article] [PubMed] [Google Scholar]
- 65.Zandvakili A, Kohn A. Coordinated neuronal activity enhances corticocortical communication. Neuron. 2015;87(4):827–839. doi: 10.1016/j.neuron.2015.07.026. [DOI] [PMC free article] [PubMed] [Google Scholar]
- 66.Mitra PP, Pesaran B. Analysis of dynamic brain imaging data. Biophys J. 1999;76(2):691–708. doi: 10.1016/S0006-3495(99)77236-X. [DOI] [PMC free article] [PubMed] [Google Scholar]
- 67.Jarvis MR, Mitra PP. Sampling properties of the spectrum and coherency of sequences of action potentials. Neural Comput. 2001;13(4):717–749. doi: 10.1162/089976601300014312. [DOI] [PubMed] [Google Scholar]
- 68.Nichols TE, Holmes AP. Nonparametric permutation tests for functional neuroimaging: A primer with examples. Hum Brain Mapp. 2002;15(1):1–25. doi: 10.1002/hbm.1058. [DOI] [PMC free article] [PubMed] [Google Scholar]
- 69.Hawellek DJ, et al. Altered intrinsic neuronal interactions in the visual cortex of the blind. J Neurosci. 2013;33(43):17072–17080. doi: 10.1523/JNEUROSCI.1625-13.2013. [DOI] [PMC free article] [PubMed] [Google Scholar]
- 70.Benjamini Y, Hochberg Y. Controlling the false discovery rate: A practical and powerful approach to multiple testing. J R Stat Soc B. 1995;57(1):289–300. [Google Scholar]
- 71.Hurtado JM, Rubchinsky LL, Sigvardt KA. Statistical method for detection of phase-locking episodes in neural oscillations. J Neurophysiol. 2004;91(4):1883–1898. doi: 10.1152/jn.00853.2003. [DOI] [PubMed] [Google Scholar]


