Significance
Flexible materials are ubiquitous in everyday life and technology; however, their effect on wetting dynamics is not well understood. We explore the related physics and whether substrate flexibility can be made to work synergistically with surface microtexturing and nanotexturing to enhance superhydrophobicity. Remarkably, we show that, depending on substrate areal density, stiffness, and damping, a tunable collaborative effect of elasticity and superhydrophobicity can be realized. We identify the mechanism responsible for this enhancement with a simple collision model, and we propose design criteria for promoting this behavior. We exemplify the above discoveries, with materials ranging from man-made (thin steel or polymer sheets) to nature-made (butterfly wings).
Keywords: droplet impact, superhydrophobicity, flexible, wetting transition, biomimicry
Abstract
Inspired by manifestations in nature, microengineering and nanoengineering of synthetic materials to achieve superhydrophobicity has been the focus of much work. Generally, hydrophobicity is enhanced through the combined effects of surface texturing and chemistry; being durable, rigid materials are the norm. However, many natural and technical surfaces are flexible, and the resulting effect on hydrophobicity has been largely ignored. Here, we show that the rational tuning of flexibility can work synergistically with the surface microtexture or nanotexture to enhance liquid repellency performance, characterized by impalement and breakup resistance, contact time reduction, and restitution coefficient increase. Reduction in substrate areal density and stiffness imparts immediate acceleration and intrinsic responsiveness to impacting droplets (∼350 × g), mitigating the collision and lowering the impalement probability by ∼60% without the need for active actuation. Furthermore, we exemplify the above discoveries with materials ranging from man-made (thin steel or polymer sheets) to nature-made (butterfly wings).
Hydrophobic surfaces have gained much attention in recent years (1) for their unique attributes, such as self-cleaning behavior (2), extreme repellency to liquids (3, 4), and resistance to surface icing (5). For practical applications, repellency to impacting liquid droplets is of great importance, and numerous studies have investigated the physics of droplet impact on rigid surfaces and the diverse outcome of such events for a broad range of liquid properties and impact conditions [liquid viscosity (6, 7), surface tension (3), environmental pressure (8, 9), etc.]. Additionally, extensive work has been done on the role surface morphology plays in determining the outcome of such events—with the goal being full rebound of an impacting droplet from the surface (10–17). In these studies, the emphasis was on texturing rigid materials to impart enhanced properties. On the other hand, there is a broad palette of surfaces in nature and technology that is characterized by some degree of flexibility [leaves (18), construction materials, textiles (19), etc.]. Studies have been reported with respect to dynamic wetting on hydrophilic, flexible materials (20–23); however, little work has addressed the interweaving effects of wetting behavior and material flexibility. In addition, the work that has been reported (24) did not focus on the role of surface compliance or flexibility in influencing the physics of the droplet collision process.
Here, we investigate the effect of substrate flexibility on superhydrophobicity through the outcome of droplet impact events with respect to impalement resistance, droplet−substrate contact time, maximum droplet deformation, and restitution coefficient. We demonstrate, through appropriate modeling and experiments, that, by rational tuning of the substrate stiffness and areal density, flexibility can actually work collaboratively with superhydrophobicity to significantly extend the range of performance in terms of droplet impalement resistance, breakup inhibition, contact time reduction, and restitution coefficient enhancement. Moreover, we show the manifestation of extended water repellency due to substrate flexibility in natural surfaces, specifically on butterfly wings. In general, this work shows and explains the important role that the (routinely) overlooked effect of substrate flexibility can play in setting the dynamic wetting behavior of superhydrophobic surfaces with practical consequences for diverse applications.
Results
Impalement Resistance.
As a flexible hydrophobic substrate, we used a low-density polyethylene (LDPE) film treated with a hydrophobic nanocomposite (nC1) coating. The selected coating exhibits low-impalement resistance, facilitating a clear comparison between the rigid and the flexible cases without introducing complications arising from high droplet impact velocities (e.g., splash). [For complete information regarding the coatings (nC1 and nC2), see Wettability Characterization, Fig. S1, Table S1, and Coating Preparation.] To assess the role of substrate compliance () on the dynamic wetting behavior of the surfaces, we sectioned films into 30 mm × 10 mm pieces, clamped them at both ends along their long side without introducing any pretension, and impacted water droplets of diameter 2.35 mm on them. The droplet impact velocity (; direction normal to the surface) and Weber number, , were kept constant during the experiments ( 50), where is the density and is the surface tension of the liquid droplet.
Fig. S1.
Characterization of spray-coated surfaces. Micrographs of surface coated with (A) nC1 and (B) nC2. (Scale bar, 50 μm.) (C) Typical profile measurement of nC1 texture heights. The average height of the surface features, , is 58 μm.
Table S1.
Compositions of the hydrophobic coatings
| Ingredient | nC1 concentration, wt% | nC2 concentration, wt% |
| PVDF | 0.5 | 0.6 |
| PMMA | 0.3 | 0.6 |
| HFS | 0.6 | 6.1 |
| nCl | 4.5 | 0.0 |
| Acetone | 89.8 | 87.2 |
| NMP | 4.3 | 5.5 |
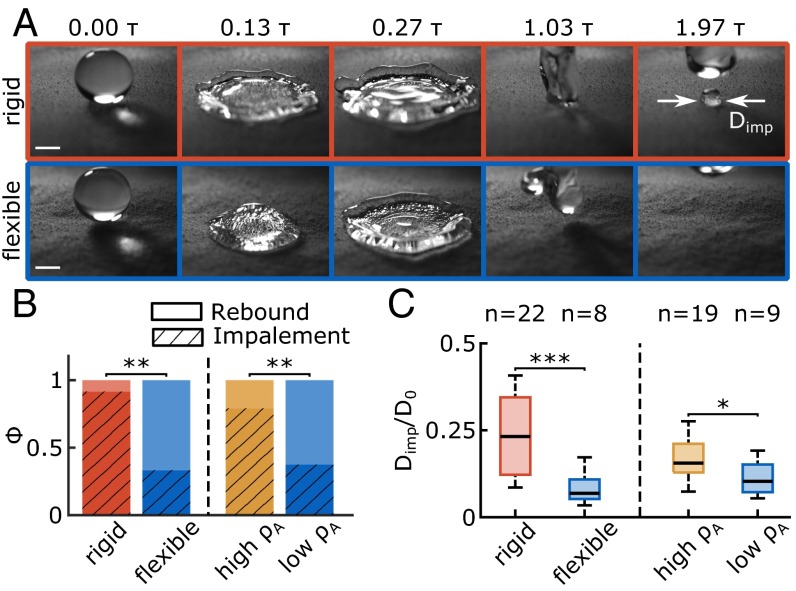
For a better comparison between the rigid and flexible substrates, we used a paired experimental design; the same surfaces and impact locations were used for both cases. To attain substrate rigidity we used a glass backing under the sample. Image sequences of a droplet impacting on an LDPE film for both the flexible (suspended) and rigid (backed) cases are shown in Fig. 1A (see also Movie S1), as a function of the inertial capillary time, ; is the natural oscillation period of a vibrating droplet (25). For the flexible substrate, when the droplet rebounds, no impalement into the texture is detected, whereas, in the rigid case, partial rebound left a pinned droplet on the surface. This signifies the displacement of the air layer out of the surface asperities by the penetrating liquid meniscus, the so-called Cassie−Baxter to Wenzel wetting transition (16), resulting in loss of droplet mobility. Two quantities were measured from the videos and are shown on the left side of Fig. 1 B and C, respectively: the presence of remaining liquid adhering to the surface (probability of observing the Cassie−Baxter to Wenzel wetting transition, ; see Impalement Probability Measurement) and the impalement parameter, , where is the impaled droplet−substrate diameter. To elucidate the postimpalement dynamics, Fig. 1C reports only for cases where impalement did occur (). Overall, for the flexible substrate, compared with the rigid case, a 58% reduction in is estimated, and, when droplet impalement does occur, is significantly reduced. Both these results support a marked effect of substrate flexibility on enhancing impalement resistance.
Fig. 1.
Comparison of impalement resistance between rigid and flexible/high areal density substrates. (A) Image sequence showing a droplet ( 2.35 mm, 50) impacting on rigid (Upper) and flexible (Lower) superhydrophobic surfaces (nC1 coating). (Scale bar, 1 mm.) (B) Probability of impalement (, hatched) and full rebound (, filled) for droplet impacts on the rigid and flexible substrates (left, 2.35 mm, 50, 24) and flexible substrates with low and high areal density (right, 2.35 mm, 69, 24). (C) Relative diameter of impalement zone () in the case where impalement did occur during the droplet impact event. Data correspond to the impalement events depicted on B. Box spans from the first to third quartile with Tukey style whiskers, and bold lines indicate population medians. Sample size () is indicated above each box. Significant differences are indicated by asterisks (*P < 0.05; **P < 0.01; ***P < 0.001).
Although flexibility has a positive effect on superhydrophobicity, we hypothesized that the substrate mass per unit area (areal density, ) should also play a critical role in the process. We repeated the above experiments with high and low , flexible substrates keeping all other parameters constant (e.g., 2.35 mm, 69). For the low- case, we used the same coated LDPE film as before; to increase for such a surface, ceteris paribus, we simply placed a liquid droplet—∼10 times larger mass than the impacting droplet—on the uncoated, wetting backside of the LDPE film. Both and are plotted on the right side of Fig. 1 B and C. Similarly, we observed a decrease in both (∼40% reduction) and (∼34% reduction) for the low- substrates in comparison with the high- ones. The behavior of the latter tends toward that of the rigid superhydrophobic surface.
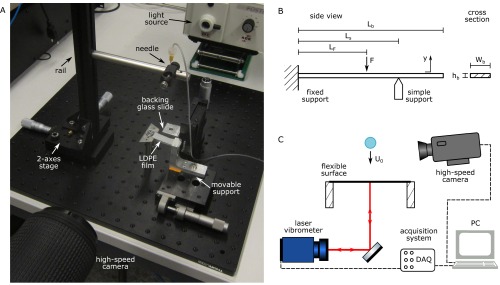
We conjecture that the mechanism behind the improved water repellency in the high and low case is related to the relative movement between the surface and the droplet in the early stages of impact that are critical to the impalement process (14). This effect can be quantified by measuring the substrate velocity, . We impacted droplets with 2.35 mm and 50, and we measured using a laser vibrometer. Moreover, we recorded video sequences in sync with acquisition. Adding a droplet to the backside of the film would hinder the vibrometer reading; therefore, we used a steel substrate of thickness 10 µm. We formed a beam with width 8 mm and length 62.5 mm, and we treated it with the same hydrophobic coating (nC1). We fixed it on one end and simply supported it at a distance of 30 mm (Fig. S2B). During our experiments, for droplet impact events on the metal beam, we found ; for the LDPE film, , which matches the result reported earlier (Fig. 1B).
Fig. S2.
Droplet impact setups. (A) Photograph of the droplet impact setup, where the important components are pointed out. (B) Support system and the relevant variables for the stainless steel beams. represents the total beam distance, is the distance between the fixed and the simple support, is the beam width. and is the beam thickness. indicates the impact force, and is the impact point. The beam displacement, , is measured from its equilibrium point. (C) Schematic of the setup for measuring the substrate velocity. The flexible surface is mounted on the elevated support, and the laser is pointed to its backside. The droplet impact with velocity is recorded by a high-speed camera while the vibrometer signal is sampled by an analog-to-digital converter. A computer is synchronizing the image sequence with the vibrometer reading.
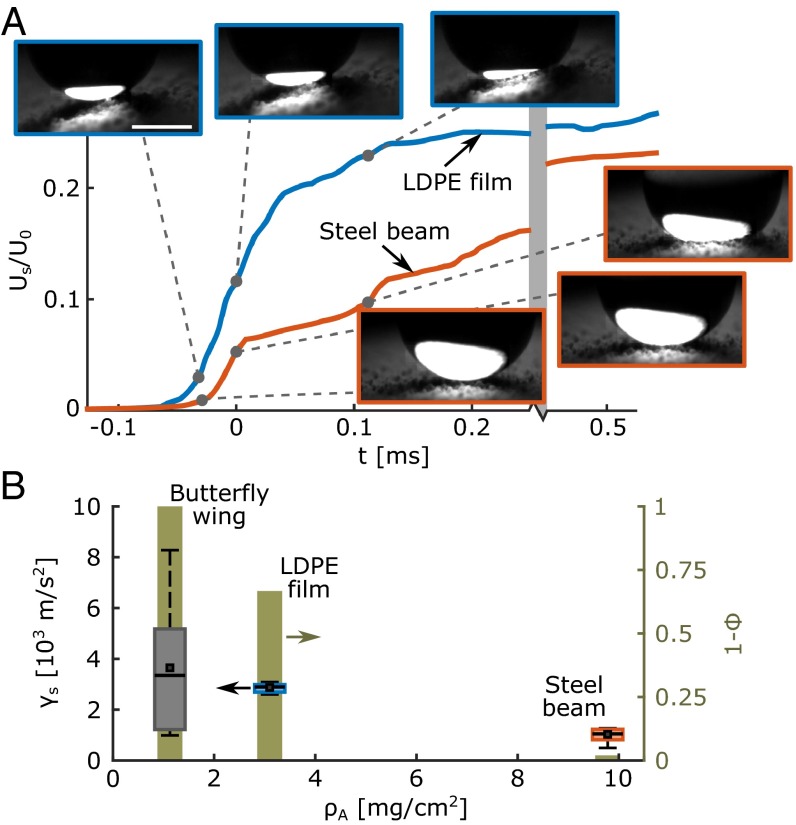
Fig. 2A shows a plot of the normalized substrate velocity vs. time, t, where 0 signifies the moment of droplet−substrate contact (see also Movie S2). For the LDPE film, is always higher than the steel beam at this initial impact stage. The time needed for the LDPE film to go from 10% to 90% of its plateau value is approximately one-third of the one for the steel beam. The LDPE film accelerates faster and reaches just before impact, reducing the apparent impact velocity. Specifically, we detected motion of the substrates even before contact with the droplet, likely due to the compression of the air layer above the surface. Such compressed air layers have been demonstrated for droplet impact on rigid surfaces (26, 27). Therefore, we assume that, just before contact, action−reaction forces, which are mediated by the intervening air layer, are exerted between the substrate and the droplet. From this, should be inversely proportional to the substrate downward acceleration () and therefore proportional to .
Fig. 2.
Substrate velocity and acceleration during impact. (A) Normalized substrate velocity profile () versus time as recorded by the laser vibrometer at the early stages of the impact event ( 2.35 mm, 50) for the LDPE film (blue) and steel beam (red). Time zero is set to the instance of contact. Both surfaces are treated with coating nC1. (Insets) Snapshots for three time instances, just before contact, at 0, and at 112 µs. (Scale bar, 1 mm.) (B) Mean substrate acceleration (, box plot corresponding to the left axis) just before the moment of impact and probability of total rebound (, bar plot corresponding to right axis) versus substrate areal density (), for the same impact conditions as in A. Box spans from the first to third quartile with Tukey style whiskers, bold lines indicate population medians, and square markers denote the population means. Sample size () is 5 repetitions per substrate for estimating and 24 repetitions per substrate for estimating .
We estimated the mean just before contact for three substrates with varying . This was achieved by using different materials, namely, butterfly wings (∼1 mg⋅cm−2), LDPE (∼3 mg⋅cm−2), and stainless steel (∼10 mg⋅cm−2). The results are shown in Fig. 2B alongside with the probability of rebound, ; we used instead of to facilitate inspection. Indeed, we discovered that and ; the surface with the smallest demonstrated , whereas the highest value of led to . To further elucidate the mechanism responsible for accelerating the substrate, we estimated the pressure exerted on the substrate at 0 as . We scaled with the Laplace pressure of the droplet, , and it yielded a range of values of from 0.33 to 0.79 with increasing from left to right. We see that the overpressure in the intervening air layer is of the same scale as . In this region, one would expect minimal deformation of the droplet-free surface and efficient energy conversion from droplet kinetic energy to substrate kinetic and strain energy. Physically, this makes sense due to the low areal density () and low stiffness () of the substrate compared with the droplet (e.g., droplet with mm impacting on an LDPE film). Regarding , for a given applied force, comparable substrate and droplet deformation is expected when . The estimated values for the steel beam and LDPE film were found to be ∼0.5 N⋅m−1 and ∼0.042 N⋅m−1, respectively (see LDPE Film Modeling, Beam Modeling, and Fig. S3), supporting that for improved impalement resistance. Finally, to achieve a high value of , one should also consider the damping ratio of the substrate, , with the goal being to minimize it, where is the natural frequency of oscillation of the substrate and is the damping coefficient. It has been shown that the main contribution to comes from air (24), indicating that the effects associated with the substrate are at a minimal state. Stated succinctly, to maximize , one should maximize , which can be achieved by satisfying the following conditions: , , and .
Fig. S3.
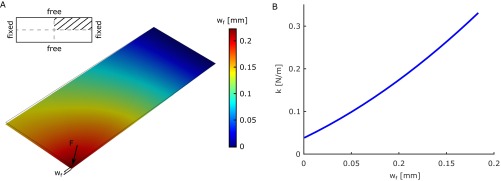
Numerical simulations of the deflection and the stiffness of the LDPE film. (A) Map of the film deflection () for a point load ( 12.8 μN) at its center. Only a quarter of the film domain has been modeled, due to the symmetry of the problem. (Inset) The modeled domain in relation to the total film area, along with the prescribed boundary conditions (hatched region). For the interior edges (dashed lines in Inset), symmetry boundary conditions were used. (B) LDPE film stiffness () vs. at the point where is applied (see A); is defined as zero when the film is in its equilibrium position while under the influence of the gravitational field.
Spreading Parameter.
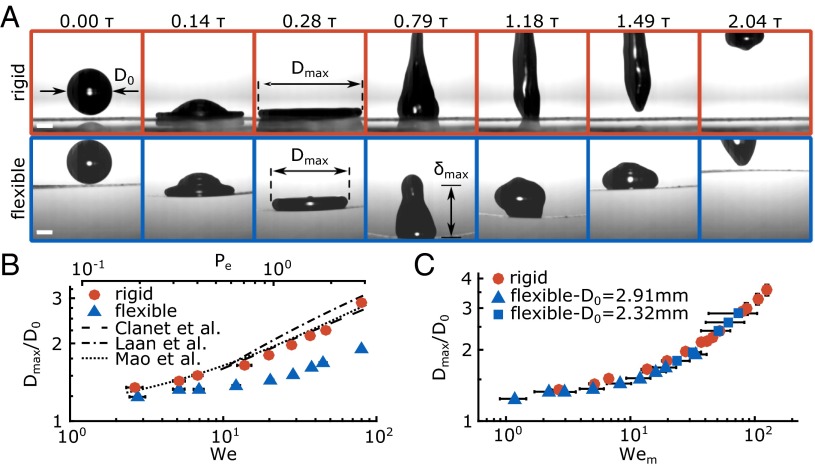
We quantified the effect of on the droplet spreading parameter, defined as the ratio of the maximum and initial droplet diameters (), using a steel beam treated with the hydrophobic coating nC2. The coating nC2 exhibits high impalement resistance, allowing one to study the effect of substrate flexibility on droplet impact dynamics (e.g., spreading parameter) for a wide-range of . The dimensions of the beam were = 10 µm, 8 mm, 62.5 mm, and 30 mm. We characterized the beam using its natural frequency of oscillation, , the flexural rigidity, , and its effective mass, (see Beam Modeling). This configuration resulted in a beam with 36 Hz and 9.5 mg. We impacted droplets with a fixed diameter ( 2.91 mm). To vary , we changed the release height of the droplet. Fig. 3A shows an image sequence of impacts onto a rigid and flexible substrate; substantial reduction in was observed for the latter case (see also Movie S3). Although was achieved in both cases at the same time instance after droplet−substrate contact, the downward movement of the flexible substrate decreases the relative impact velocity—reducing the crashing force—resulting in a smaller . Fig. 3B presents a plot of versus . For the rigid case, our results are in good agreement with three theoretical models for their validity range (see Model for Maximum Spreading). In Fig. 3B, we show the impact number (28) in a second axis, where is the Reynolds number and is the dynamic viscosity of the fluid. Note that, for a given , the relation between and is one to one (surjective).
Fig. 3.
Droplet spreading on flexible substrates. (A) Image sequences of droplet ( 2.91 mm) impacting on flexible and rigid hydrophobic substrates (steel beam treated with nC2). The maximum spreading diameter is indicated on the images as . (Scale bar, 1 mm.) (B) Spreading parameter () for different values of . Lines indicate the predicted values for using three theoretical models for their validity range: Clanet et al. (6) (dashed line), Laan et al. (28) (dash-dotted line), and Mao et al. (40) (dotted line). of the impacts is indicated by the second horizontal axis. (C) plotted vs. for the rigid (circle) and flexible cases for two droplet sizes (triangle, 2.91 mm; square, 2.32 mm). Sample size () for B and C is five repetitions per point. Error bars represent ±99% confidence interval of the mean. Nonvisible error bars are smaller than the marker size.
For the flexible case, the reduction in is evident for the whole range of , and it resembles a shift toward the right (higher ). We postulate that the droplet perceives the downward movement of the flexible substrate as a reduction in the apparent . This reduction in can be quantified by calculating the mean acceleration experienced by the droplet during spreading, , as has been demonstrated previously by Clanet et al. (6) for a rigid surface. Following the same analysis, we calculated experienced by the droplet in the reference frame moving with the surface. For < , the substrate velocity just after impact, , scales as the one for a perfectly inelastic collision (23, 24), , where is the mass of the droplet. The droplet experiences a deceleration from to 0; when is achieved, the droplet is immobile with respect to the substrate. The spreading takes place in the crashing time, which is of the order of (6), independent of the presence of compliance or not, resulting in . For the spreading dynamics, the droplet impact can be described by a modified number, defined as
| [1] |
We see from Eq. 1 that, for substrates with , the difference between and diminishes, and it is eliminated in the rigid case. By using to plot , all data collapse onto a single curve as shown in Fig. 3C. For the sake of completeness, in Fig. 3C, we report results for a smaller droplet size ( 2.35 mm) using the same flexible surface.
Collision Outcome.
Using steel beams, we varied by changing and , and we measured the collision outcome, namely the remaining droplet kinetic energy after recoil, . During the experiments, we set 2.23 mm and 78.8, and we kept them constant throughout, resulting in 106 Hz. Three beams were used with equal to 0.27, 1.17, and 2.85 times . We set 3 to 6 times higher than , so as to keep the effect on frequency shift due to the additional droplet mass minimum. We treated the beams with a hydrophobic coating nC2, and we fixed them on one side and simply supported the other, with no overhanging segment. The beam dimensions and characteristics are reported in Table 1.
Table 1.
Beam dimensions for collision outcome experiment
| Beam | , mm | , mm | , µm | , Hz | , N/m | , mg |
| 1 | 50 | 10 | 20 | 29 | 1.0 | 33.7 |
| 2 | 24 | 10 | 20 | 124 | 9.8 | 16.2 |
| 3 | 19 | 10 | 30 | 297 | 66.9 | 19.2 |
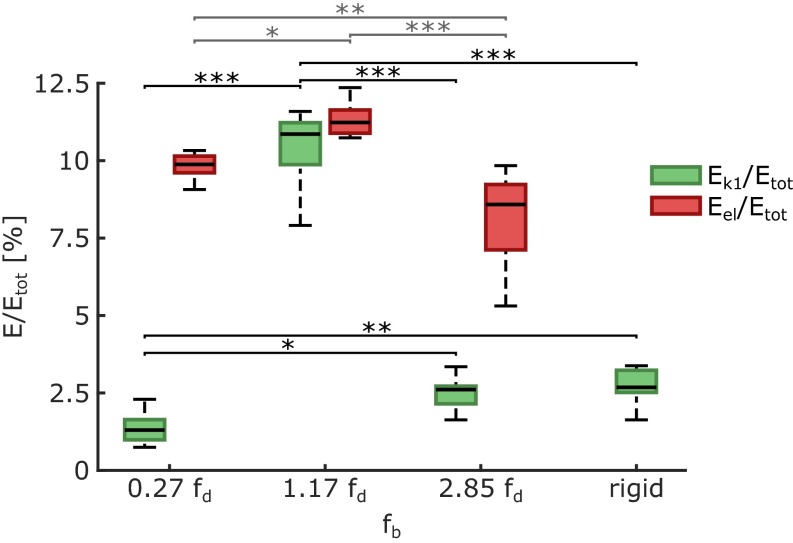
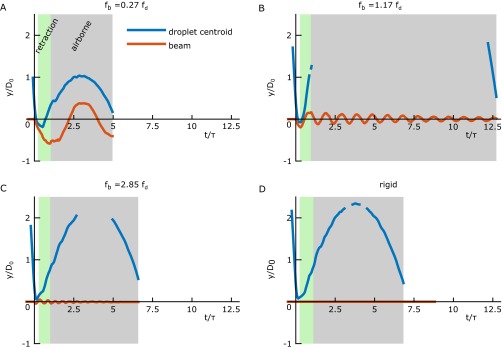
We estimated by tracking its centroid. The elastic strain energy stored in the beam, , was calculated by measuring its maximum deflection at the point of impact, , and substituting into , where the second term accounts for the potential energy due to sagging; is the gravitational acceleration, and the coefficient corrects for the mass being distributed over the beam (see Beam Modeling). Moreover, we calculated the total amount of energy available to the droplet, , as the kinetic energy just before impact plus the excess gravitational energy from the impact point to the point of maximum deflection, . Fig. 4 shows a plot of and normalized by vs. . Depending on the relation between and , and and , the substrate movement can act synergistically, passively, or destructively on (see Table 1 for and ); may return to the droplet or be dissipated by the beam oscillation. For beams with , droplet recoil occurs during the downward motion of beam, decreasing . Alternatively, if , the droplet recoils at the point of maximum velocity, recuperating (see Movie S4). For beams with , the dynamics resemble the rigid substrate case. Representative trajectories of the droplet centroid and beam impact point are shown in Fig. S4.
Fig. 4.
Outcome of a droplet impact event for different beam resonance frequencies. Shown are residual kinetic energy of the droplet after rebound (, green) and strain energy of the beam at maximum deflection (, red) normalized by the total available energy of the droplet before impact () vs. . The impact parameters are the same for all experiments ( 2.23 mm, 78.8). Box spans from the first to third quartile with Tukey style whiskers, and bold lines indicate population medians. Sample size () is eight repetitions per case. Significant differences are indicated by asterisks (black for , gray for ; *P < 0.05; **P < 0.01; ***P < 0.001).
Fig. S4.
Droplet and beam trajectories for different beam frequencies. (A−C) The normalized displacement (; see Fig. S2B for definition of ) of the beam impact point (red line) and the trajectory of the droplet centroid (blue line) vs. dimensionless time () as exported from the image sequence recorded by the high-speed camera. Time zero is defined as the moment when the droplet and substrate first make contact. The droplet retraction and airborne phases are indicated by the highlighted areas, green and gray, respectively. The natural frequency of the beam () is (A) 0.27 , (B) 1.17 , and (C) 2.85 . (D) Droplet trajectory for the rigid case. Impact parameters are identical for all panels ( 2.23 mm, 78.8).
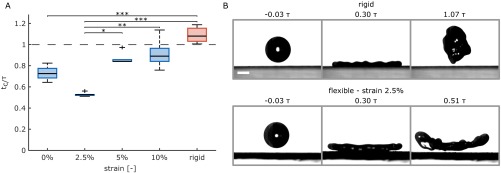
Interestingly, when , is maximized and the repellency of the surface is enhanced, as more energy is available to the droplet for rebounding and recovering from possible partial impalement into the surface texture. Furthermore, for the same synchronized case, we observed a slight decrease in contact time, . This reduction in was found to be more pronounced for LDPE films under tension. By increasing the film strain, we detected jump of the droplets in a so-called “pancake” bouncing (11) (Fig. S5).
Fig. S5.
Contact time dependence on LDPE film strain. (A) Normalized contact time () vs. film strain; the rigid case is included for reference. The impact parameters are the same for all cases ( 2.19 mm, 80). Dashed line indicates the shortest theoretical limit for the rigid case (10). Box spans from the first to third quartile with Tukey-style whiskers, and bold lines indicate population medians. Outliers greater than 1.5× interquartile range are marked with a cross. Sample size () is eight repetitions per case. Significant differences are indicated by asterisks (*P < 0.05; **P < 0.01; ***P < 0.001). (B) Comparison of the spreading and retraction dynamics for the rigid and the flexible substrate cases. For the flexible case, the droplet is airborne in a “pancake” shape. Impact conditions are as in A. (Scale bar, 1 mm.)
Butterfly Wing.
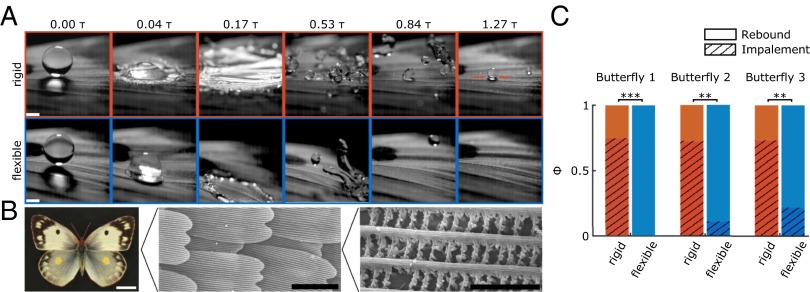
An example from nature for the manifestation of enhanced hydrophobicity through high-, low- substrates was found in butterfly wings (Lepidoptera). We impacted water droplets onto the wings of three butterflies of different species (Colias hyale, Callithea sapphire, and Inachis io). See Butterfly Wing for their wetting properties.
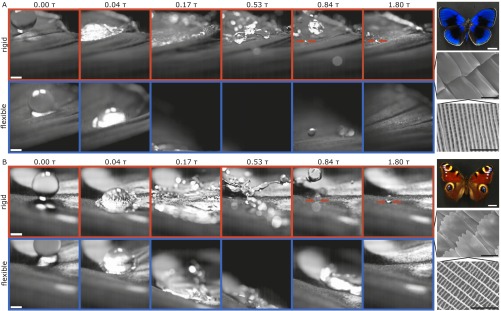
The water droplet impact behavior on such wings, along with their surface micrographs, is shown in Fig. 5 A and B and Fig. S6. We supported the insect samples by a pin passing through their thorax, allowing their wings to deform freely under load. By adding a rigid glass support under the sample and filling the intermediate gap with water, we were able to reduce the flexibility of the wing and restrict its range of motion at will. For each butterfly species, we impacted droplets with 2.35 mm at constant , and we compared the effect of flexibility on the impalement resistance (see Movie S5). Fig. 5C shows for the rigid and flexible cases. In the flexible case, was 51 to 71% less compared with the rigid case, depending on the specimen.
Fig. 5.
Impact on butterfly wings. (A) Image sequences of a droplet ( 2.35 mm, 389) impacting on a supported and an unsupported butterfly wing of a specimen from the species C. hyale. Arrows indicate location of impalement. (Scale bar, 1 mm.) (B) Image of the butterfly and micrographs of the wings used for the droplet impact experiment in A. (Scale bar, left to right, 10 mm, 50 μm, and 5 μm.) (C) for a droplet ( 2.35 mm) impacting on butterfly wings of the three tested species in supported (rigid) and unsupported (flexible) cases: Butterfly 1, C. hyale, 389; Butterfly 2, C. sapphire, 568; and Butterfly 3, I. io, 401. The sample size was 9. Significant differences are indicated by asterisks (**P < 0.01; ***P < 0.001).
Fig. S6.
Impact on butterfly wings, two further specimens. (A) Image sequences of droplet ( 2.35 mm, 568) impacting on supported and unsupported butterfly wing of a specimen from the species C. sapphire (Left) together with images of the butterfly and SEM micrographs of the wings (Right). (B) Image sequences of droplet ( 2.35 mm, 401) impacting on supported and unsupported butterfly wing of a specimen form the species I. io (Left) together with images of the butterfly and SEM micrographs of the wings (Right). Arrows indicate location of impalement. See also Movie S5. (Scale bar, 1 mm for drop impact snapshots, 10 mm for butterfly image, and 50 μm and 5 µm for the SEM micrographs at top to bottom, respectively.)
Coating Preparation
We used the following materials in this study, which were all obtained from Sigma Aldrich: N-methyl-2-pyrrolidone (NMP, 99.5 wt%), poly(methyl methacrylate) powder (PMMA, crystalline, Mw ∼996,000 Da), poly(vinylidene fluoride) pellets (PVDF, Mw ∼71,000 Da), and surface modified nanoclay (nCl, 0.5 wt% to 5 wt% aminopropyltriethoxysilane, 15 wt% to 35 wt% octadecylamine). We obtained hydrophobic fumed silica (HFS, Aerosil R 8200) from Evonik and obtained acetone (≥99.5 wt%) from Thommen-Furler AG. We obtained the precision stainless steel tapes (EN 1.4310) of 10-, 20-, and 30-µm thickness from H+S PraezisionsFolie GmbH and obtained LDPE food packing film of 12.5 μm thickness from a local supplier.
We used two hydrophobic coatings in this study, and we refer to them as nC1 and nC2. In general, the coatings consisted of a fluorinated polymer, which lowers the surface energy, and functionalized nanoparticles, which increase surface roughness. We report the individual material concentrations in Table S1 and give the dispersion preparation in the following.
We produced separate stock solutions of 10 wt% PVDF in NMP and PMMA in acetone by dissolving the polymers under slow mechanical mixing overnight at 50 °C and at room temperature, respectively. To create a coating with low impalement resistance (nC1), we formed a particle suspension by mixing 410 mg of nanoclay platelets, 60 mg of HFS particles, and 8,000 mg of acetone in a 10-mL vial and then treated the mixture with probe sonication (130 W, 3 mm probe, 60% amplitude, 20-kHz frequency, Sonics Vibracell VCX-130) for 30 s. Once we formed a stable suspension, 440 mg of 10 wt% PVDF and 250 mg of 10 wt% PMMA were added, and the dispersion was mechanically stirred at room temperature.
To produce a more robust coating (41) (nC2), we formed an HFS suspension by mixing 500 mg of particles and 6,700 mg acetone in a 10-mL vial and treating it with a probe sonication for 30 s. Likewise, after forming a stable suspension, 500 mg of 10 wt% PVDF and 500 mg of 10 wt% PMMA were added to it, and the dispersion was mechanically stirred at room temperature.
We deposited the dispersions onto the flexible substrates (stainless steel, LDPE) with an airbrush (Paasche VL, 0.73-mm head) using compressed air at ∼2 bar at a fixed nozzle-to-substrate distance of ∼10 cm. Then, we dried the coatings on a hotplate at 90 °C for 30 min to remove any remaining solvent. Micrographs of the coating are shown in Fig. S1. For the impalement resistance experiments, we used surfaces coated with the nC1. For the spreading parameter and collision outcome experiments, we treated the surfaces using nC2.
The micrographs of the three butterfly specimens and the hydrophobic coatings were obtained with a Hitachi SEM SU8200 at 1.5 kV to 20 kV. Before SEM, the specimens were sputter-coated with Au/Pd with a thickness of ∼10 nm.
For nC1, we acquired the surface profile using a stylus profilometer (Dektak 6M; Veeco Instruments Inc.) with a 5-µm stylus radius, similar to the one shown in Fig. S1D. We removed the linear trend from the profile, and we calculated the root-mean-square value of the roughness . We estimated the mean height of the surface features as the peak-to-peak amplitude of a sine profile with the same value as the one measured for our surfaces,
| [S1] |
Impalement Probability Measurement
For rational surface texture designs, such as micropillar arrays, the Cassie−Baxter to Wenzel wetting transition occurs at well-defined conditions (critical droplet radius, velocity, etc.) (16, 42); for surfaces with random, hierarchical texture, like the ones used in this study, the transition may occur over a range of impacting velocities. The probabilistic character of the wetting transition is attributed to the stochastic nature of the surface texture, which is giving rise to multiple transitioning states (43) (micro-Cassie and nano-Cassie states) and the fluctuations of the contact angle hysteresis (44). To study these cases, it is more appropriate to study the probability of observing the Cassie−Baxter to Wenzel wetting transition () for a given set of conditions (e.g., impact velocity).
In our experiments, we measured by repeatedly impacting water droplets of the same and onto a number of different spots having the same surface texturing, for both the rigid and the flexible cases. The same set of spots was used between the rigid and the flexible cases. After each impact, we recorded the presence of adhering liquid on the surface. was calculated as the number of impacts leading to impalement divided by the total number of impacts.
LDPE Film Modeling
To estimate the flexural rigidity, , of the LDPE film, we used two approaches. Firstly, a simple analytical approximation of can be found from the Euler−Bernoulli beam theory (45). The relation describing the deflection of the beam (perpendicular to the beam axis, subscript denotes LDPE film), , under the application of a distributed load, , for beams of uniform material and constant cross-section, is
| [S2] |
where is the coordinate along the length of the beam, is the Young’s modulus of the material of the beam, is the beam mass per unit length, is the distributed load on the beam, and is the second moment of inertia of the beam. For a beam with a rectangular cross-section of width and thickness , . The film is modeled as a fixed-fixed supported beam with a point load at its middle; with this, the flexural rigidity can be defined as 0.0028 N⋅m s−11, where is the length of the film [ 0.24 GPa (46), 1.63·10−18 m4, 30 mm]. In the case of thin structures under bending with constrained axial displacement, the beam deflection predicted by the Euler−Bernoulli theory is greatly overestimated due to a lack of coupling between vertical loading and axial action (47); this would result in an underestimation of , so we took the calculated value as the lower but relevant boundary.
A remedy to the above mentioned considerations is the inclusion of geometric nonlinearity when solving for . Analytical solutions are not applicable for this problem; therefore, we resorted to the numerical simulation using the finite element method software COMSOL Multiphysics 5.2. Furthermore, is not independent of , and we expect material stiffening with increasing . To account for nonuniform deformation at the plane of the film, we used the Mindlin plate theory (48). The films that were used in our experiments had thickness much smaller than their planar dimensions, allowing them to be modeled as two-dimensional structures. Furthermore, during clamping, we took special care so as to avoid introducing any prestress; this allowed us to assume that bending stiffness is the main component resisting the film deflection for the small values of . We assumed fixed boundary conditions along the short edges of the film and free boundary conditions along the long edge (Fig. S3A). The loading of the film was fixed on its center perpendicular to its plane. Additionally, the gravitational field was taken into account as a distributed load. We only modeled one-quarter of the film domain due to the symmetry of the problem. We simulated the film deflection for point loads varying from 0 μN to 30 μN, which results in maximum in the range of 200 µm; differentiation of the resulting vs. curve results in an estimation of , which is shown in Fig. S3B. As expected, the resulting is greater than the one predicted by the Euler−Bernoulli theory. For the droplet impact experiments, we estimated the just before contact by integrating and found it to be ∼5 µm. For this range of , the mean value of is ∼0.042 N⋅m−1.
Beam Modeling
For the stainless steel beams, we estimated the flexural rigidity and the natural frequency of the beam using the Euler−Bernoulli beam theory (45). For beams with cross-section thickness small in comparison with the beam length, like the ones used in this study, the assumptions related to this theory are well met. In our case, , which is due to gravitational field and is assumed constant along the beam. The boundary conditions completing the differential equation are set by the support type and the point loads.
For calculating , we assumed equilibrium conditions; thus, the dependence of on time is dropped. We further assumed a point load at the droplet impact point and integrated Eq. S2 to acquire the relation between point load and deflection. For a beam having a fixed and a simple support without any overhanging part, the analytic solution for stiffness is . The presence of an overhanging part makes the analytic solution more complicated, and we resorted to solving the equations numerically. In addition, we measured, experimentally, the beam deflection using calibrated weights, and we calculated by a linear least square fitting. The relative error between the two values was found to be less than 15%.
From the equilibrium shape of the beam, we also calculated its potential energy due to gravity, , as
| [S3] |
For fixed-simply supported beams, integration of Eq. S3 results in , assuming zero potential energy at the point of equilibrium.
We integrated Eq. S2 using the separation of variables method to determine . The oscillating modes can be determined by the eigenvalues of the resulting system of equations. For fixed-simply supported beams with no overhanging segment, the first resonance mode is calculated as . In the case of an overhanging part being present, we solve the equations numerically. So as to estimate experimentally, we measured the time the beam needed to reach its maximum deflection, , and we estimated the natural frequency of oscillation for the droplet−beam system as . We compared these values with the theoretical value of , taking into account the correction for excess mass for the droplet as . We found the values to be in good agreement, with maximum relative error less than 9%.
Model for Maximum Spreading
After the surface contact, the droplet starts to expand into a flattened pancake shape until it reaches its maximum spreading diameter, . The theoretical prediction of is based mainly on a momentum or energy balance between the instances just before impact and at maximum spreading (32). We compared our results for the rigid substrate case against those obtained from three theoretical models: (i) a momentum conservation model from Clanet et al. (6), (ii) a fitted model based on energy conservation considerations from Laan et al. (28), and (iii) a semiempirical energy conservation model by Mao et al. (40). The validity range of these models is restricted to 10, and no alternative theoretical treatment was found in literature for the low range on superhydrophobic surfaces. For this reason, we propose a modification to the Mao et al. model to extend its predictive validity for the whole range of our experimental data.
Mao et al. (40) derived their model using a first-principle energy approach. During the droplet spreading, the initial kinetic energy and surface energy are converted to surface energy at maximum spreading while a part is dissipated by the viscous forces, as
| [S4] |
By assuming spherical shape for the droplet before impact and normalizing by , we end up with the dimensionless form for Eq. S4 (49),
| [S5] |
where is the normalized dissipative term and is the normalized surface energy. Mao et al. proposed the relation for dissipation as , which is derived as a semiempirical law applying to both low- and high-viscosity liquids. For the surface term, assuming that, at maximum extension, the droplet resembles a cylinder with constant volume results in . For low , this expression can produce physically unreasonable results (e.g., 1). In reality, the shape of the droplet is better approximated as an oblate spheroid (50). If we assume constant volume and that the surface is completely nonwetting ( −1; Wettability Characterization), the resulting expression for is
| [S6] |
The resulting theoretical curve is shown in Fig. 3C. Good agreement with our results is achieved for the whole range of .
Discussion
We have demonstrated that the flexibility of the substrate—controlled by , , and —can enhance the superhydrophobic behavior of the surface. To enhance impalement resistance, the design rules were found to be , , and . Satisfying these criteria facilitates the fast acceleration of the substrate to an incoming droplet during the early stage of the impact process. For minimizing droplet spreading and breakup, which occurs during the later stage of droplet−substrate impact, the above design rules also applied, with the added constraint that . Separately, the criterion to maximize the kinetic energy of the droplet as it rebounds from the surface (important for liquid repellency) is then .
The mechanism behind this enhancement of hydrophobicity (minimizing ) through high-, low- substrates is connected to the momentum transfer during the droplet−substrate collision—from the droplet to the surface—quantified by the relative impact velocity. By measuring the on impact, we showed that only substrates able to reach sufficient velocity at the initial moments after the collision can impede the impalement process. Because we detected motion even before contact, we speculate that the pressure of the air layer under the droplet is able to deform the substrate. Such intervening layers have been shown to affect the splashing dynamics (17, 29) and promote the droplet mobility in liquid films (30–32). Flexible films have been proposed to positively affect the dynamics of the air layer—by either reducing the maximum air pressure, reducing the relative impact velocity, or extracting kinetic energy from the droplet—and suppress splash (22). Due to the dual role that these intervening layers play in both splashing (17, 29) and impalement dynamics (14), one could expect flexible films to alter meniscus impregnation behavior through a complex mechanism—based on compressibility effects (14), water hammer (13, 33), etc.—rather than a simple reduction of the dynamic pressure due to relative substrate motion (see Dynamic Pressure). However, balancing with local capillarity can perhaps be used for an order of magnitude first estimate; this is an important aspect for future investigations.
Returning to splash suppression, because smaller droplets are harder to remove from the surface than larger ones (16), sustaining the droplet integrity can be advantageous for liquid repellency. For hydrophobic surfaces, splashing can also occur during the retraction phase, a pure wetting phenomenon provoked by the decrease in the dynamic contact angle, known as receding splashing (34). Reducing for a given restricts the minimum lamella height and therefore the probability of droplet separation during the receding phase. For substrates with , reduction in can be achieved. In such cases, the downward movement of the flexible substrate should persist across the entire spreading phase. If the is achieved before , returns to the droplet and participates in the spreading dynamics. This effect has been reported previously (21, 22), where, although the flexible substrates were able to absorb a considerable amount of , no difference on the was detected in comparison with the rigid case. Reduction in has, so far, only been reported on soft materials (35), and it is attributed to viscoelastic breaking, namely dissipation of energy in the contact line because of local deformation of the substrate, a mechanism different from the one proposed by the present study.
Furthermore, by tuning , we can alter the droplet rebound dynamics. We have demonstrated that can be maximized by setting , where is an integer constant that, in this case, was set to unity. In this case, the droplet recoils from the surface while it is moving upward with its maximum velocity. The same cooperative effect is anticipated when and ; however, should be reduced with successive substrate oscillations due to viscous losses and may therefore be undesirable. Additionally, for , reduction in can be achieved as shown by the LDPE films under strain (Fig. S5). The mechanism for this “spring-boarding” effect has recently been explained (36).
On the other hand, if the goal is minimization of , we showed that this can be achieved by setting and . The underlying mechanism is that the droplet recoils upward while the surface is still moving downward; therefore, a considerable amount of energy is removed from the droplet, resulting in a reduced (see Movie S4). Additionally, when , the droplet may not recoil from the surface after one droplet oscillation, because the surface is no longer sufficiently rigid to “break the symmetry.” Rather, the droplet continues to oscillate on the moving surface and recoils as the substrate is moving upward—as shown by the steel beam case (see Movie S3). In this instance, is minimized through prolonged droplet−substrate contact (). Here, and results in energy being dissipated by both the droplet and the beam. In the end, by either of the abovementioned mechanisms, what results is droplet “interception,” an effect that has been observed for rain in the tree canopy (37).
Improved hydrophobicity, by making use of flexible surfaces, does apparently also come into play in nature; we observed this mechanism on butterflies. Our experiments show that flexibility reduces the probability of droplet impalement. Even though thermoregulated butterflies are rarely expected to fly during rainfall due to low sunlight conditions—because they can only reach the necessary body temperature for flight through solar irradiation (38, 39)—if a raindrop hit them, this might have disastrous effects on the filigree wing structure. Furthermore, flexibility prevents the raindrop from penetrating into the wing structure. In nature, a pinned raindrop on the butterfly wing could hinder flight or even cause wing scale delamination.
Dynamic Pressure
Impalement into the surface texture is believed to occur when the dynamic pressure of the droplet due to the impact, , is larger than the antiwetting pressure (, capillary) that is resisting the penetration into the texture (16). Between the rigid and the flexible cases, remains the same, because it is a function of the surface texture and chemistry. The radius of curvature during bending of the flexible substrates is orders of magnitude higher than the highest texture feature, so no change in the spacing of the features is to be expected. The impalement condition can then be written as . We can calculate for the rigid substrate case as , where is the droplet velocity just before rigid substrate contact. In the flexible substrate case, due to the fact that the substrate is already moving with a velocity before droplet contact, the dynamic pressure at impact is defined as , where is the droplet impact velocity at the flexible case. Because is constant for both cases, one can conclude that , for the same level.
We have determined experimentally the value of —the point where impalement occurs with similar —for droplets impacting on superhydrophobic rigid () and flexible () substrates. The expected substrate velocity can be estimated as . For a fixed probability of impalement (0.33), we determined that 18 and 50. This would result in 0.4, almost 2 to 3 times bigger than the one we measured in our experiments. Stated differently, the expected value of from the above calculation should be 50% lower than the experimental value. Moreover, the high substrate (steel beam in Fig. 2A) showed some movement during the initial impact stages, but we were unable to detect any difference in and , i.e., no impalement resistance enhancement.
Balancing with , although good for an order of magnitude estimate, cannot satisfactorily describe the impalement process here. This deficiency has been previously reported for rigid substrates, where other effects have been proposed to be important, like the hammer pressure (13, 33) or air layer drainage (14). Our results support these theories.
Materials and Methods
Droplet Impact Experimental Setup.
See Fig. S2 A and B for a description of the droplet impact setup. For the experiments, we supported the surfaces by either fixing (clamping) both ends or fixing one and simply supporting the other. One of the supports was mounted on a linear stage, allowing us to vary . For producing accurate droplet sizes, we used calibrated needles with repeatability error less than 5%. The needle was mounted on a vertical rail, which could be moved with a two-axis linear stage, to control the impact point. For steel beams, we always performed the impact at a distance from the fixed support; this was the position for maximum theoretical deformation. For the LDPE films, impact points were random but near the middle area. A high-speed camera (Phantom V9.1; Vision Research) recorded the events (5,000 s−1 to 6,700 s−1) in a backlit configuration.
Laser Doppler Vibrometry.
We used a laser Doppler vibrometer (CLV-2534; Polytec) to measure the substrate velocity (Fig. S2C). A high-speed camera (FastCam SA1.1; Photron) recorded the impact event. Data acquisition of the vibrometer signal was carried out by an analog-to-digital converter (data acquisition; National Instruments) connected to a PC. Dedicated software (PFV Ver.351; Photron) acquired both the impact image sequence and the velocity measurement in sync.
Wettability Characterization.
To assess the wettability of the coatings, we measured the apparent advancing () and receding () water contact angles by the stationary droplet method, whereby 5 µL to 10 µL of liquid was inflated (advancing) and deflated (receding) through a plastic, flat-tipped needle (GELoader Tips; Eppendorf) using a syringe pump. We made contact angle measurements with images captured with a detector (DCC1645C; Thorlabs) affixed with a standard zoom lens (MVL7000; Thorlabs) in a backlit-imaging configuration.
The measured values for the hydrophobic coatings are nC1 coating 152° ± 3° and 145° ± 5° and nC2 coating 161° ± 4° and 158° ± 4°.
Butterfly Wing.
The butterfly specimens were acquired from the entomological collection of Eidgenössische Technische Hochschule (ETH) Zürich, where they have been conserved in a dry state. For surface characterization, contact angles were measured on the butterfly wings, giving values of 160°±6° and 155°±6° for C. hyale, 153°±5° and 149°±6° for C. sapphire, and 168°±3° and 163°±3° for I. io.
Statistical Analysis.
Statistical testing of the hypothesis that impalement resistance is affected by the flexibility of the substrate (LDPE film) was performed by the two-sided sign test. Statistical significance for the impalement resistance of butterfly wings in association with flexibility was tested using the Fisher’s exact test. For comparing the population means between two groups, we used the two-sampled two-sided Student’s t test. For comparing the population means among multiple groups, we used the one-way analysis of variance (ANOVA). Each group population that participated in either a Student’s t test or an ANOVA was moreover tested for normality using the Anderson−Darling test. For comparison where we detected departures from normality ( vs. LDPE strain), we used nonparametric Kruskal−Wallis ANOVA. All statistical tests were performed at a significance level of α = 0.05. All quantitative measurements reported are expressed as average values ±99% confidence intervals of the mean. The sample size is reported either in the legend or on the plot area of the presented graphs.
Supplementary Material
Acknowledgments
We thank Tanmoy Maitra for his spadework, Gustav Graeber for doing surface morphology characterization, and Julian Marschewski for doing thickness measurements. We acknowledge the entomological collection of ETH Zurich (Rodney Eastwood) for donating the insect samples. Partial support of the Swiss National Science Foundation under Grant 162565 and the European Research Council under Advanced Grant 669908 (INTICE) is acknowledged. This study was also supported by ETH Zurich Postdoctoral Fellowship Program and the Marie Curie Actions for People COFUND Programme FEL-14 13-1 (to T.M.S.).
Footnotes
The authors declare no conflict of interest.
This article is a PNAS Direct Submission.
This article contains supporting information online at www.pnas.org/lookup/suppl/doi:10.1073/pnas.1611631113/-/DCSupplemental.
References
- 1.Quéré D. Non-sticking drops. Rep Prog Phys. 2005;68(11):2495–2532. [Google Scholar]
- 2.Barthlott W, Neinhuis C. Purity of the sacred lotus, or escape from contamination in biological surfaces. Planta. 1997;202(1):1–8. [Google Scholar]
- 3.Liu TL, Kim CJ. Repellent surfaces. Turning a surface superrepellent even to completely wetting liquids. Science. 2014;346(6213):1096–1100. doi: 10.1126/science.1254787. [DOI] [PubMed] [Google Scholar]
- 4.Tuteja A, et al. Designing superoleophobic surfaces. Science. 2007;318(5856):1618–1622. doi: 10.1126/science.1148326. [DOI] [PubMed] [Google Scholar]
- 5.Schutzius TM, et al. Physics of icing and rational design of surfaces with extraordinary icephobicity. Langmuir. 2015;31(17):4807–4821. doi: 10.1021/la502586a. [DOI] [PubMed] [Google Scholar]
- 6.Clanet C, Beguin C, Richard D, Quéré D. Maximal deformation of an impacting drop. J Fluid Mech. 2004;517:199–208. [Google Scholar]
- 7.Maitra T, et al. Supercooled water drops impacting superhydrophobic textures. Langmuir. 2014;30(36):10855–10861. doi: 10.1021/la502675a. [DOI] [PubMed] [Google Scholar]
- 8.Latka A, Strandburg-Peshkin A, Driscoll MM, Stevens CS, Nagel SR. Creation of prompt and thin-sheet splashing by varying surface roughness or increasing air pressure. Phys Rev Lett. 2012;109(5):054501. doi: 10.1103/PhysRevLett.109.054501. [DOI] [PubMed] [Google Scholar]
- 9.Schutzius TM, et al. Spontaneous droplet trampolining on rigid superhydrophobic surfaces. Nature. 2015;527(7576):82–85. doi: 10.1038/nature15738. [DOI] [PubMed] [Google Scholar]
- 10.Bird JC, Dhiman R, Kwon HM, Varanasi KK. Reducing the contact time of a bouncing drop. Nature. 2013;503(7476):385–388. doi: 10.1038/nature12740. [DOI] [PubMed] [Google Scholar]
- 11.Liu YH, et al. Pancake bouncing on superhydrophobic surfaces. Nat Phys. 2014;10(7):515–519. doi: 10.1038/nphys2980. [DOI] [PMC free article] [PubMed] [Google Scholar]
- 12.Gauthier A, Symon S, Clanet C, Quéré D. Water impacting on superhydrophobic macrotextures. Nat Commun. 2015;6:8001. doi: 10.1038/ncomms9001. [DOI] [PMC free article] [PubMed] [Google Scholar]
- 13.Deng T, et al. Nonwetting of impinging droplets on textured surfaces. Appl Phys Lett. 2009;94(13):133109. [Google Scholar]
- 14.Maitra T, et al. On the nanoengineering of superhydrophobic and impalement resistant surface textures below the freezing temperature. Nano Lett. 2014;14(1):172–182. doi: 10.1021/nl4037092. [DOI] [PubMed] [Google Scholar]
- 15.Bartolo D, Josserand C, Bonn D. Retraction dynamics of aqueous drops upon impact on non-wetting surfaces. J Fluid Mech. 2005;545:329–338. [Google Scholar]
- 16.Bartolo D, et al. Bouncing or sticky droplets: Impalement transitions on superhydrophobic micropatterned surfaces. Europhys Lett. 2006;74(2):299–305. [Google Scholar]
- 17.Liu Y, Tan P, Xu L. Kelvin−Helmholtz instability in an ultrathin air film causes drop splashing on smooth surfaces. Proc Natl Acad Sci USA. 2015;112(11):3280–3284. doi: 10.1073/pnas.1417718112. [DOI] [PMC free article] [PubMed] [Google Scholar]
- 18.Gilet T, Bourouiba L. Fluid fragmentation shapes rain-induced foliar disease transmission. J R Soc Interface. 2015;12(104):1092. doi: 10.1098/rsif.2014.1092. [DOI] [PMC free article] [PubMed] [Google Scholar]
- 19.Zimmermann J, Reifler FA, Fortunato G, Gerhardt LC, Seeger S. A simple, one-step approach to durable and robust superhydrophobic textiles. Adv Funct Mater. 2008;18(22):3662–3669. [Google Scholar]
- 20.Gilet T, Bush JWM. The fluid trampoline: Droplets bouncing on a soap film. J Fluid Mech. 2009;625:167–203. [Google Scholar]
- 21.Mangili S, Antonini C, Marengo M, Amirfazli A. Understanding the drop impact phenomenon on soft PDMS substrates. Soft Matter. 2012;8(39):10045–10054. [Google Scholar]
- 22.Pepper RE, Courbin L, Stone HA. Splashing on elastic membranes: The importance of early-time dynamics. Phys Fluids. 2008;20(8):082103. [Google Scholar]
- 23.Soto D, De Larivière AB, Boutillon X, Clanet C, Quéré D. The force of impacting rain. Soft Matter. 2014;10(27):4929–4934. doi: 10.1039/c4sm00513a. [DOI] [PubMed] [Google Scholar]
- 24.Gart S, Mates JE, Megaridis CM, Jung S. Droplet impacting a cantilever: A leaf-raindrop system. Phys Rev Appl. 2015;3(4):044019. [Google Scholar]
- 25.Lamb H. Hydrodynamics. Cambridge Univ Press; Cambridge, UK: 1895. Surface waves; pp. 351–469. [Google Scholar]
- 26.Kolinski JM, et al. Skating on a film of air: Drops impacting on a surface. Phys Rev Lett. 2012;108(7):074503. doi: 10.1103/PhysRevLett.108.074503. [DOI] [PubMed] [Google Scholar]
- 27.Li EQ, Thoroddsen ST. Time-resolved imaging of a compressible air disc under a drop impacting on a solid surface. J Fluid Mech. 2015;780:636–648. [Google Scholar]
- 28.Laan N, de Bruin KG, Bartolo D, Josserand C, Bonn D. Maximum diameter of impacting liquid droplets. Phys Rev Appl. 2014;2(4):044018. [Google Scholar]
- 29.Xu L, Zhang WW, Nagel SR. Drop splashing on a dry smooth surface. Phys Rev Lett. 2005;94(18):184505. doi: 10.1103/PhysRevLett.94.184505. [DOI] [PubMed] [Google Scholar]
- 30.Gilet T, Bush JWM. Droplets bouncing on a wet, inclined surface. Phys Fluids. 2012;24(12):122103. [Google Scholar]
- 31.Hao C, et al. Superhydrophobic-like tunable droplet bouncing on slippery liquid interfaces. Nat Commun. 2015;6:7986. doi: 10.1038/ncomms8986. [DOI] [PMC free article] [PubMed] [Google Scholar]
- 32.Hao C, et al. Bioinspired interfacial materials with enhanced drop mobility: From fundamentals to multifunctional applications. Small. 2016;12(14):1825–1839. doi: 10.1002/smll.201503060. [DOI] [PubMed] [Google Scholar]
- 33.Kwon HM, Paxson AT, Varanasi KK, Patankar NA. Rapid deceleration-driven wetting transition during pendant drop deposition on superhydrophobic surfaces. Phys Rev Lett. 2011;106(3):036102. doi: 10.1103/PhysRevLett.106.036102. [DOI] [PubMed] [Google Scholar]
- 34.Rioboo R, Tropea C, Marengo M. Outcomes from a drop impact on solid surfaces. At Sprays. 2001;11(2):155–165. [Google Scholar]
- 35.Rioboo R, et al. Drop impact on soft surfaces: Beyond the static contact angles. Langmuir. 2010;26(7):4873–4879. doi: 10.1021/la9036953. [DOI] [PubMed] [Google Scholar]
- 36.Weisensee PB, Tian J, Miljkovic N, King WP. Water droplet impact on elastic superhydrophobic surfaces. Sci Rep. 2016;6:30328. doi: 10.1038/srep30328. [DOI] [PMC free article] [PubMed] [Google Scholar]
- 37.Livesley SJ, Baudinette B, Glover D. Rainfall interception and stem flow by eucalypt street trees—The impacts of canopy density and bark type. Urban For Urban Green. 2014;13(1):192–197. [Google Scholar]
- 38.Kingsolver JG. Thermoregulation and flight in Colias butterflies—Elevational patterns and mechanistic limitations. Ecology. 1983;64(3):534–545. [Google Scholar]
- 39.Wickman PO. Thermoregulation and habitat use in butterflies. In: Settele J, Shreeve T, Konvička M, van Dyck H, editors. Ecology of Butterflies in Europe. Cambridge Univ Press; Cambridge, UK: 2009. pp. 55–61. [Google Scholar]
- 40.Mao T, Kuhn DCS, Tran H. Spread and rebound of liquid droplets upon impact on flat surfaces. AIChE J. 1997;43(9):2169–2179. [Google Scholar]
- 41.Tiwari MK, Bayer IS, Jursich GM, Schutzius TM, Megaridis CM. Highly liquid-repellent, large-area, nanostructured poly(vinylidene fluoride)/poly(ethyl 2-cyanoacrylate) composite coatings: Particle filler effects. ACS Appl Mater Interfaces. 2010;2(4):1114–1119. doi: 10.1021/am900894n. [DOI] [PubMed] [Google Scholar]
- 42.Antonini C, et al. Unraveling wetting transition through surface textures with X-rays: Liquid meniscus penetration phenomena. Sci Rep. 2014;4:4055. doi: 10.1038/srep04055. [DOI] [PMC free article] [PubMed] [Google Scholar]
- 43.Verho T, et al. Reversible switching between superhydrophobic states on a hierarchically structured surface. Proc Natl Acad Sci USA. 2012;109(26):10210–10213. doi: 10.1073/pnas.1204328109. [DOI] [PMC free article] [PubMed] [Google Scholar]
- 44.Rioboo R, Voué M, Vaillant A, De Coninck J. Drop impact on porous superhydrophobic polymer surfaces. Langmuir. 2008;24(24):14074–14077. doi: 10.1021/la802897g. [DOI] [PubMed] [Google Scholar]
- 45.Timoshenko S, Gere JM. Theory of Elastic Stability. Dover; Mineola, NY: 2009. Beam-columns; pp. 1–45. [Google Scholar]
- 46.Barentse Wm, Heikens D. Mechanical properties of polystyrene low density polyethylene blends. Polymer. 1973;14(11):579–583. [Google Scholar]
- 47.Bathe KJ, Bolourchi S. Large displacement analysis of 3-dimensional beam structures. Int J Numer Methods Eng. 1979;14(7):961–986. [Google Scholar]
- 48.Pica A, Wood RD, Hinton E. Finite-element analysis of geometrically nonlinear plate behaviour using a Mindlin formulation. Comput Struc. 1980;11(3):203–215. [Google Scholar]
- 49.Attane P, Girard F, Morin V. An energy balance approach of the dynamics of drop impact on a solid surface. Phys Fluids. 2007;19(1):012101. [Google Scholar]
- 50.Richard D, Quéré D. Bouncing water drops. Europhys Lett. 2000;50(6):769–775. [Google Scholar]
Associated Data
This section collects any data citations, data availability statements, or supplementary materials included in this article.


