Significance
Targeting specific genomic loci with synthetic molecules remains a major goal in chemistry, biology, and precision medicine. Identifying how synthetic genome readers bind the chromatinized genome in cells would facilitate their development, but doing so remains a formidable challenge. We map the genome-wide binding patterns for two structurally distinct synthetic molecules. To achieve this goal, we couple our cross-linking of small molecules to isolate chromatin approach to next-generation sequencing. In addition to binding high-affinity sites, these molecules, surprisingly, bind clustered low-affinity sites. The data also show that these genome readers target sites in both open and closed chromatin. Our findings highlight the importance of genome-guided design for molecules that will serve as precision-targeted therapeutics.
Keywords: genome targeting, COSMIC, molecular recognition, polyamide, chemical genomics
Abstract
Targeting the genome with sequence-specific DNA-binding molecules is a major goal at the interface of chemistry, biology, and precision medicine. Polyamides, composed of N-methylpyrrole and N-methylimidazole monomers, are a class of synthetic molecules that can be rationally designed to “read” specific DNA sequences. However, the impact of different chromatin states on polyamide binding in live cells remains an unresolved question that impedes their deployment in vivo. Here, we use cross-linking of small molecules to isolate chromatin coupled to sequencing to map the binding of two bioactive and structurally distinct polyamides to genomes directly within live H1 human embryonic stem cells. This genome-wide view from live cells reveals that polyamide-based synthetic genome readers bind cognate sites that span a range of binding affinities. Polyamides can access cognate sites within repressive heterochromatin. The occupancy patterns suggest that polyamides could be harnessed to target loci within regions of the genome that are inaccessible to other DNA-targeting molecules.
Some of the most effective therapeutic agents target the genome and disrupt DNA-templated processes such as DNA repair, replication, and transcription (1–3). These chemotherapeutic agents generally lack sequence specificity, resulting in dose-limiting toxicity and adverse side effects (1, 2). Targeting desired genomic loci with rationally designed, sequence-specific small molecules is an important goal at the interface of chemistry, biology, and precision medicine.
Polyamides composed of N-methylpyrrole and N-methylimidazole monomers can be rationally designed to target specific DNA sequences in vitro and in vivo (4). Polyamides have potent biological properties, ranging from selective targeting of viral DNA (5–7), derepression of developmental and disease-causing genes (8, 9), and inhibition of tumor growth in vivo (10–12), to rational design of synthetic transcription factors (13–18). Remarkably, rationally designed polyamides fed to Drosophila larvae induced classic homeotic patterns of developmental reprogramming (19). To understand the rules that govern polyamide function, several groups have independently examined the DNA sequence specificity of this class of molecules in vitro (20–25). In particular, we developed cognate site identifier (CSI) analysis to interrogate DNA sequence specificity and affinity comprehensively for any given sequence across half a million permutations of a 10-mer binding site (20, 21). CSI studies demonstrated that affinities and specificities of polyamides for their cognate sites rival the affinities and specificities of natural transcription factors (20–23). Moreover, CSI data yielded polyamide affinity measurements for every 10-mer sequence that occurs in any given genome (21). Applying this information to map binding potential across the genome led to CSI-based “genomescapes” that predict thousands of putative polyamide-binding sites of varying affinities across the human genome (21, 22).
However, different regions of the genome are packaged to different degrees in a cell. Indeed chromatin accessibility is a major barrier to binding by naturally occurring DNA-binding proteins as well as artificial DNA binders, such as zinc fingers, transcription activator-like effectors, and the RNA-guided CRISPR-Cas9 (26, 27). Elegant biophysical and biochemical studies have demonstrated that polyamides bind to solvent-exposed cognate sites on nucleosomes without significant loss in affinity or specificity (28, 29). However, a recent study concluded that condensed chromatin structure can limit a polyamide-chlorambucil conjugate binding to cognate sites in human cells (30). The extent to which different chromatin states influence polyamide binding to its cognate sites is a long-standing question that remains unresolved. Lack of clarity on the parameters that govern genome-wide binding of polyamides greatly impedes the deployment of this powerful class of molecules to regulate cell fate-defining and disease-causing gene networks in vivo.
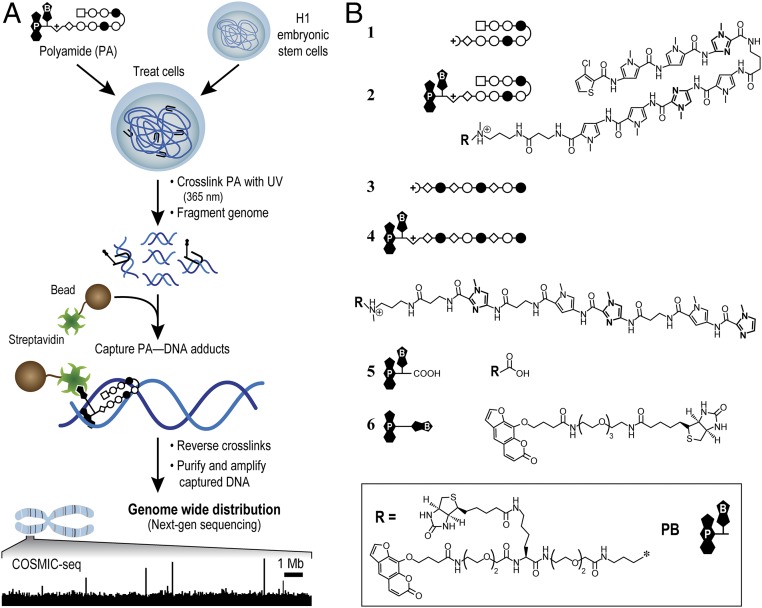
To understand how polyamides engage chromatinized loci in living cells, we developed a method to study direct polyamide–DNA interactions across the genome. We named this approach cross-linking of small molecules to isolate chromatin (COSMIC) (31). COSMIC employs trifunctional derivatives of polyamides that are composed of the DNA-binding ligand of interest, an affinity handle (biotin), and a photo cross-linker. COSMIC-sequencing (COSMIC-seq) coupled to next-generation sequencing (NGS) enabled us to map genome-wide binding profiles of two bioactive polyamides in H1 human embryonic stem cells (H1-hESCs; Fig. 1).
Fig. 1.
Bioactive polyamides and COSMIC scheme. (A) COSMIC-seq. Cells are treated with trifunctional derivatives of polyamide (PA). After cross-linking with 365 nm of UV irradiation, cells are lysed and genomic DNA is sheared. Streptavidin-coated magnetic beads are added to capture polyamide–DNA adducts. The DNA is released and analyzed by qPCR or by NGS. (B) Hairpin polyamides 1 and 2 target the DNA sequence 5′-WACGTW-3′, where W = A or T. Linear polyamides 3 and 4 target 5′-AAGAAGAAG-3′. Two derivatives of psoralen, 5 and 6, were also examined. Rings of N-methylimidazole are bolded for clarity. N-methylpyrrole (○), N-methylimidazole (●), 3-chlorothiophene (□), and β-alanine (◇) are shown. Psoralen (P) and biotin (B) are denoted.
The H1-hESC line was selected for this study for multiple reasons. First, H1-hESCs are a well-characterized (tier 1) cell line by the Encyclopedia of DNA Elements (ENCODE) consortium, and they represent a powerful system to determine whether different chromatin states are differentially permissive to polyamide binding (32). In H1-hESCs, the ENCODE has mapped the genome-wide positions of 31 transcription factors and chromatin-associated proteins; 11 posttranslational modifications (PTMs) of histone proteins; and many other valuable datasets, including chromatin accessibility as measured by hypersensitivity to the enzyme DNase I (DNase HS), DNA methylation, and gene expression by RNA-sequencing (RNA-seq) (32). Second, because these cells are propagated in tissue culture, they offer the opportunity to modulate gene expression ex vivo. Third, H1-hESCs can be used to model tissue engineering approaches for future applications in regenerative medicine.
The COSMIC-seq profiles in H1 cells show that although the expected binding to high-affinity DNA sequences is observed, polyamide binding to clusters of weak- to moderate-affinity sites is prevalent. More unexpected is the observation that both repressive heterochromatin and actively transcribed euchromatin are readily accessible to polyamides. Natural transcription factors rarely occupy repressive heterochromatin. Finally, we report a model, derived solely from in vitro CSI specificity experiments, that best fits genome-wide occupancy profiles in human stem cells. Our studies provide a genome-wide binding map of polyamides in live cells and point to a new paradigm for genome targeting by rationally designed polyamides. These results also guide the future use of polyamides as powerful research tools and potential therapeutics.
Results
Genome-Wide Localization of Polyamides by COSMIC-Seq.
To map polyamide-binding sites directly across the genome in living cells, we developed COSMIC-seq (Fig. 1A). COSMIC consists of treating live cells with trifunctional derivatives of polyamides. Because the photo cross-linker psoralen is used, the cross-links are reversible under well-defined conditions. Captured genomic DNA can be separated from the polyamide, purified, amplified, and identified by massively parallel NGS. Sequencing reads are computationally mapped to their location across the genome. The loci bound by polyamides show clear enrichment of sequencing reads relative to a genomic “control” sample that has not been enriched by streptavidin-mediated capture of DNA. Loci bound by polyamide are further validated via independent biological replicates and quantitative PCR (qPCR).
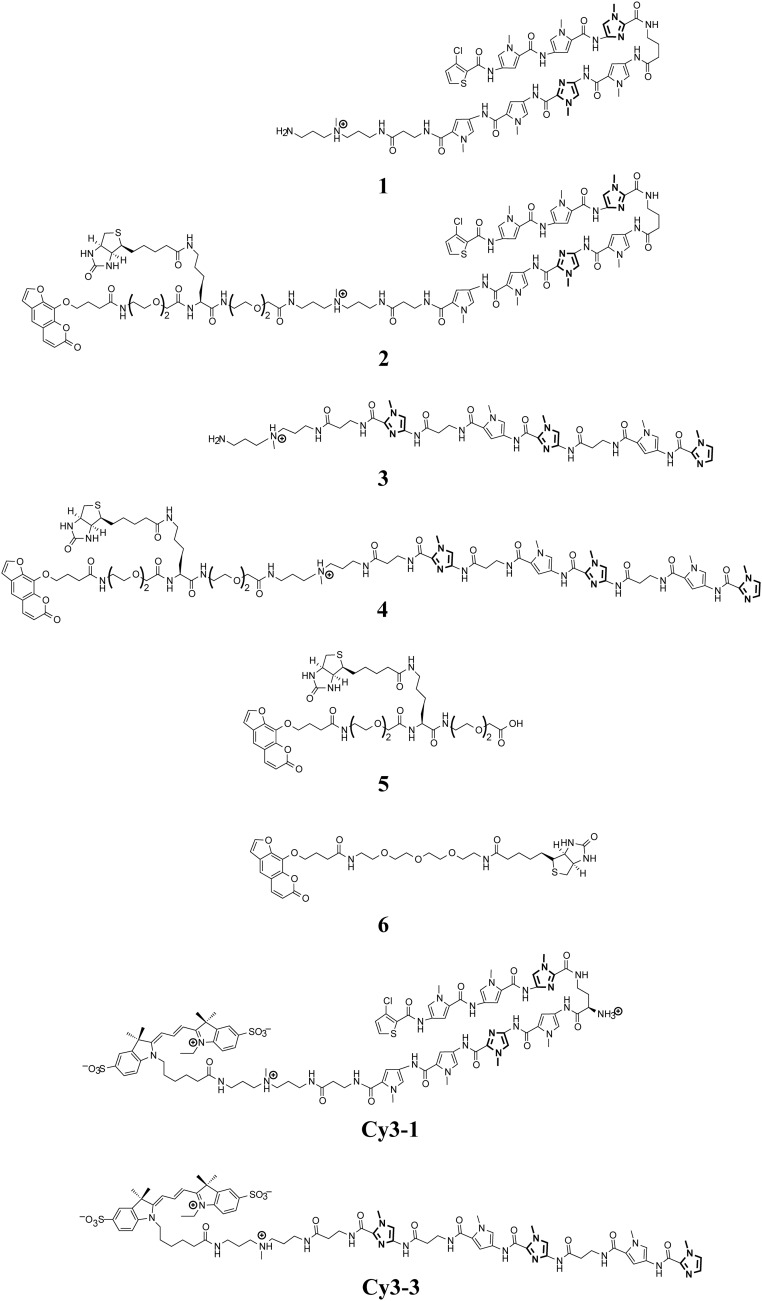
To perform COSMIC-seq, two structurally distinct, bioactive polyamides were synthesized using Boc solid-phase protocols (33). Hairpin 1, designed to target 5′-WTACGTW-3′ (34, 35), down-regulates VEGF expression in cell culture and suppresses tumor growth in vivo (35, 36). Linear 3, designed to target 5′-AAGAAGAAG-3′ (8), is designed to target a GAA repeat expansion found in patients with Friedreich’s ataxia to alleviate transcriptional repression (8). These polyamides were conjugated to the psoralen-biotin moiety, 5 (active ester), to yield 2 and 4 (Fig. 1B and Fig. S1). These trifunctional polyamides were incubated with H1-hESCs. Upon UV irradiation, psoralen reversibly cross-links to pyrimidines with a preference for thymine (37). To minimize potential bias in cross-linking, we incorporated a linker (∼36 Å extended) between the polyamide and psoralen. The linker enables psoralen to sample up to 10 bp flanking the polyamide-binding site and to cross-link to a proximal pyrimidine in AT-rich human genomes (31).
Fig. S1.
Chemical structures of molecules. Structures of molecules used in this study are illustrated. Heterocycles of N-methylimidazole are bolded for clarity. Cy, cyanine.
Sequence Specificity of Polyamide Derivatives.
Although psoralen binds to DNA with an association constant that is 100,000-fold lower than the polyamide, it is formally possible that it perturbs the specificity of polyamides in a nonlinear manner (37). To test this possibility, we performed CSI analysis to identify the sequence specificity of polyamides bearing or lacking a psoralen-biotin moiety (Fig. 2A). CSI analysis was performed on binding data derived from either high-density DNA microarrays or massively parallel NGS (20–22) (Fig. 2A). The DNA microarray contains more than 500,000 million spatially resolved DNA duplexes representing 1.5-fold coverage of all possible 10-mer sequence permutations. Fluorophore-conjugated polyamides were incubated with microarrayed duplex DNA, washed, and then imaged. Fluorescence intensity is proportional to the association constant between hairpin polyamide and the underlying DNA sequence (20, 21). Sequence specificity can also be determined with NGS by solution-based systematic evolution of ligands by exponential enrichment sequencing (SELEX-seq) or Bind-n-sequencing approaches (25, 38, 39). In the NGS-based approaches, a polyamide with an affinity handle, such as biotin, is incubated with duplex DNA (a library bearing all 1012 sequence permutations of a 20-bp site). Bound sequences are enriched by affinity purification with streptavidin-coated magnetic beads and analyzed by NGS (22, 39). Specificity profiles of the parent polyamides, 1 and 3, were generated with the microarray-based CSI approach (21). For 2 and 4, CSI by SELEX-seq was used to analyze the sequence specificity of 2 and 4 because it allows for a larger library of DNA molecules, thereby enabling the detection of contributions from the structure of flanking DNA or from the psoralen conjugated to the polyamides.
Fig. 2.
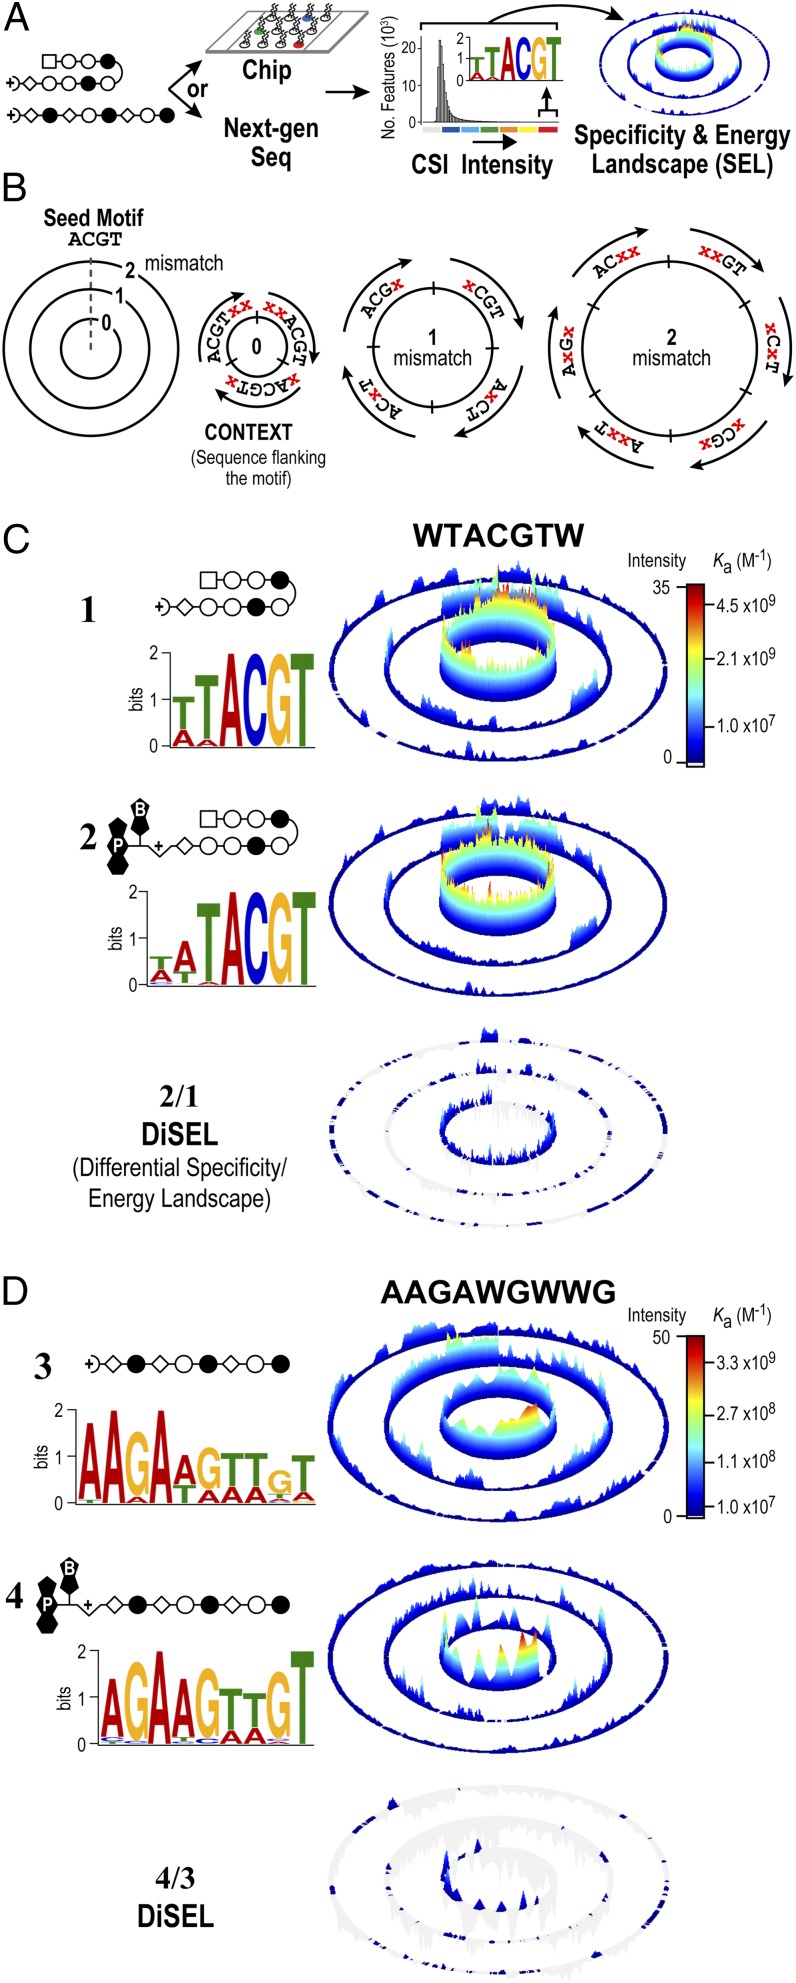
Comprehensive sequence specificity landscapes of synthetic genome readers. (A) Workflow to generate CSI sequence SELs. Specificity data can be derived by two different methods. A DNA microarray contains approximately half a million spatially resolved features that each display a unique sequence as a DNA hairpin, with all sequence variants of DNA, up to 12 bp, represented on the array (20–22). Polyamides are added to the microarray to obtain intensity values simultaneously for every DNA sequence. Alternatively, a library of DNA with all possible N-mers (e.g., 1012 unique 20-mers) can be added to a polyamide in solution (22). The polyamide–DNA interactions can be captured with an affinity handle to the polyamide (e.g., biotin/streptavidin), with the DNA amplified by PCR and sequenced with NGS (31). (B) Organization of a model SEL (21, 22, 63). The recognition preferences of DNA-binding molecules are displayed with SELs. A seed sequence (4 bp) is used to organize a dataset composed of all possible 6-mer combinations. (C and D) DNA logos and SELs reveal that the psoralen moiety has little impact on sequence specificity. Hairpin (C) and linear (D) polyamides with and without the psoralen moiety attached are shown. Scale bars show quantile-normalized CSI intensities. The difference between the two SELs is plotted as a DiSEL. Sequences preferred by 2 and 4 appear as colored peaks in the DiSELs of C and D, respectively.
Based on the most enriched sequences identified by CSI analysis, we derived position-weight matrices (PWMs) for each polyamide and displayed the resulting binding motifs as DNA logos. The logo provides a simple representation of the consensus binding motif in which dependence on a specific base at a given position is denoted by the height of the letter (height represents information content) (40). PWM-derived logos show that conjugating a psoralen-biotin moiety has no appreciable impact on polyamide specificity (compare profiles for 1 versus 2 and profiles for 3 versus 4; Fig. 2 C and D).
Although DNA logos are commonly used to display consensus motifs, they are inadequate in capturing the full spectrum of sequences targeted by polyamides (or even natural DNA-binding proteins). We therefore developed sequence specificity and binding energy landscapes (SELs) to display the comprehensive set of binding affinities (21, 22) (Fig. 2). SELs consistently reveal nonobvious cognate sites often masked by motif-finding algorithms (21, 22). In brief, SELs display the entire sequence specificity spectrum of DNA-binding molecules through a series of concentric rings. To illustrate the organization of the data, we displayed a hypothetical SEL with a binding intensity value for every possible 6-mer DNA sequence organized by the motif ACGT (Fig. 2B). The innermost ring (ring 0) contains all sequences bearing the ACGT seed motif, whereas the positions flanking this seed vary (denoted by an “x”; Fig. 2B). The set of sequences is organized in a clockwise manner, with the variable flanking residues organized in an alphabetical order (A, C, G, T). The impact of flanking sequences on the binding to an identical seed becomes readily evident from this organization of the data. Each successive ring displays an additional mismatch to the seed motif. For example, rings 1 and 2 display sequences with one and two mismatches to the seed motif, respectively. The organization of the mismatches (denoted by x) is also clockwise, with each of the three mismatches at any given position placed in alphabetical order (Fig. 2B).
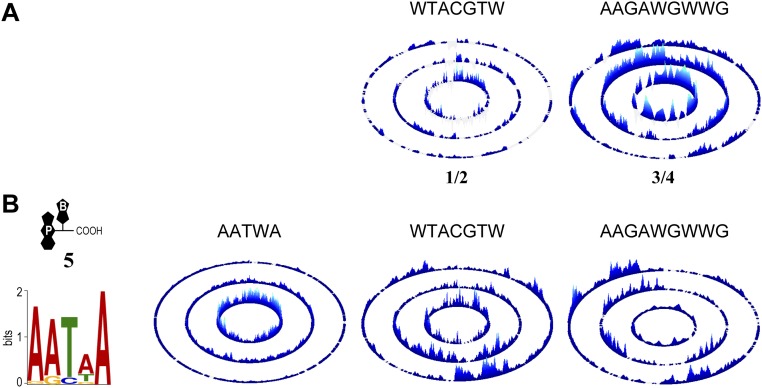
The hairpin polyamide functionalized with psoralen, 2, displayed sequence specificity landscapes that were nearly identical to its parent molecule, 1 (Fig. 2C). The 1 and 2 showed notably similar preferences for flanking nucleotides, as well as reduced binding to sequences with mismatches (the sequences located on the outer two rings of the SEL). To evaluate further if the addition of the psoralen moiety altered the specificity of the polyamide, we generated a differential specificity and energy landscape (DiSEL). In this comparative analysis, sequences preferred by 2 over 1 would emerge as peaks in the DiSEL. As is evident from the figure, the differences between 1 and 2 indicate the absence of a few very low-intensity peaks rather than the emergence of new peaks with altered sequence preferences (Fig. 2C and Fig. S2A). Thus, psoralen has little detectable impact on the specificity of the hairpin polyamide.
Fig. S2.
DiSELs and SELs. (A) Reciprocal DiSELs from Fig. 2 C and D. (B) Consensus motif of 5 was used as a seed motif. As a control, the seed motifs of 2 and 4 were used to organize the specificity data.
The linear derivative 4 showed a similar DNA logo to parent polyamide 3, and the comprehensive specificity and binding energy comparisons afforded by DiSEL again showed reduced representation of low-affinity peaks distributed across all three rings (Fig. 2D and Fig. S2A). These differences are not explained by the imposition of sequence preferences of psoralen on the intrinsic specificity of the linear polyamide (Fig. S2B).
We turned to in vitro cross-linking experiments to determine whether the differences between the specificity of 3 and 4 were due to more efficient enrichment of high-affinity sites, as is often observed in SELEX experiments (25). In cross-linking experiments, we have previously shown that 4 displays higher specificity for a sequence with a single base-pair mismatch, 5′-AAGAGGAAG-3′ than a sequence with double base-pair mismatch to the seed motif 5′-AAGAGGAGG-3′ (31), where the locations of the mismatches are highlighted. Although the array-based specificity profile of 3 corroborates this result, this information is lost from the SELEX-based specificity profile of 4 (Fig. 2D).
SELEX-seq and Bind-n-seq measure the specificity of 2 and 4 in a manner that is both rapid and cost-effective (25, 39, 41). This method is well-equipped to generate DNA logos with the high-affinity consensus sequence bound by a given polyamide (25, 39, 41). As mentioned previously (25), however, we find that this method does not capture the comprehensive specificity landscape of polyamides. Many low-affinity sequences that are not captured by sequencing-based approaches may well be critical to understanding in vivo polyamide-binding profiles and regulatory functions across the genome (21, 31). Based on these findings, we used the comprehensive CSI data from microarray-based experiments to predict polyamide binding across the genome.
Genome-Wide Polyamide Distributions in Cells Coincide with CSI-Derived Genomescapes.
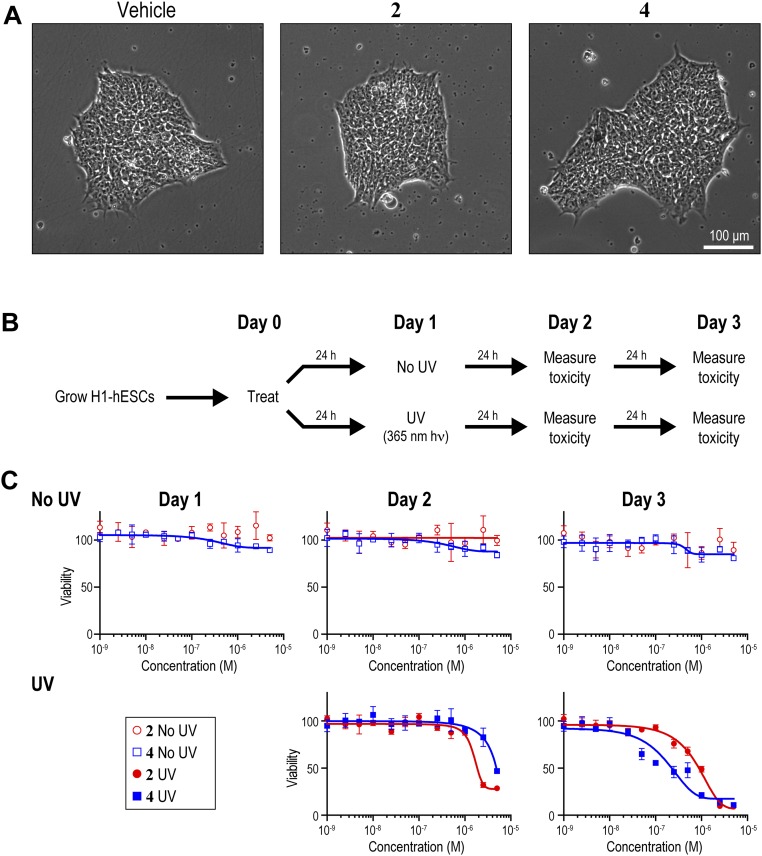
We performed COSMIC combined with NGS (COSMIC-seq) to identify the genome-wide targets of 2 and 4 in H1-hESCs (Fig. 1A). Cells were treated in biological duplicate with 2 or 4 at varying concentrations (20 nM and 400 nM to select a concentration close to the dissociation constant of the two polyamides and a concentration used in biological experiments, respectively). We observed a dose-dependent increase in enrichment as measured by COSMIC-qPCR at three different loci, which spanned a broad range of predicted binding energies (Fig. S3). Neither cell viability nor cellular morphology was perturbed after 24 h of treatment with either bioactive polyamide (Fig. S4). We confirmed that 2 and 4 could elicit concentration-dependent toxicity of H1 cells in the presence of low-dose 365-nm UV irradiation, offering an independent test of permeability, nuclear trafficking, and mechanism of action (Fig. S4 B and C).
Fig. S3.
Dose–response of 2 and 4. H1-hESCs were treated with two (20 nM and 400 nM) concentrations of 2 or 4 and profiled by COSMIC-qPCR. Genomescapes for each locus are shown for reference. Predicted scores, derived from the summation model, are included for reference. Results are mean ± SEM (n = 2).
Fig. S4.
(A) Cellular morphology of H1-hESCs after 24 h of treatment with 0.1% DMSO (vehicle), 400 nM 2 or 400 nM 4. (B) Experimental outline to assess cellular toxicity. Cells were treated for 24 h, beginning on day 0, with the indicated concentration of polyamide. On day 1, cells were exposed briefly (1 min) to 365 nm UV irradiation, or not exposed to UV irradiation, as indicated above. Toxicity was monitored on days 1, 2, and 3. (C) Cell viability after treatment with vehicle, 2, or 4. Results are mean ± SEM (n = 3).
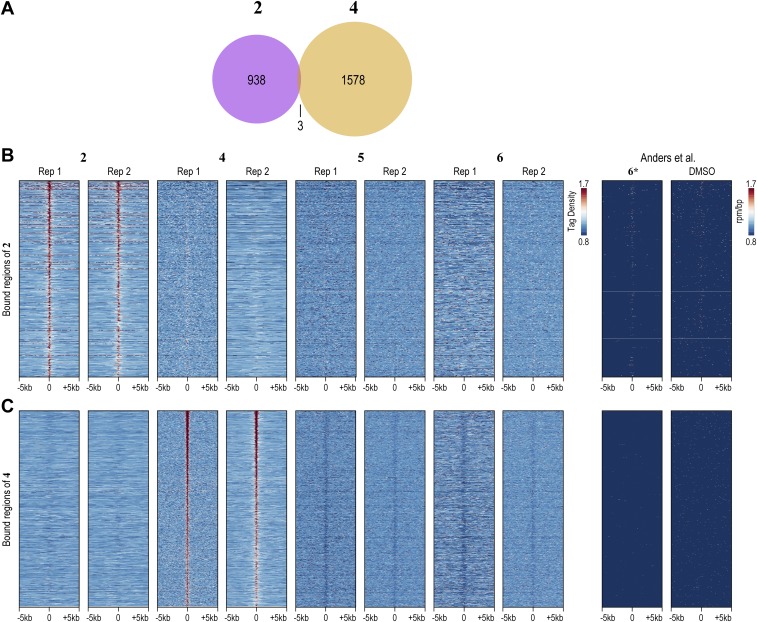
Using the standard peak-calling pipeline validated by the ENCODE consortium (42), we identified 923 and 1,581 high-confidence bound regions for 2 and 4, respectively, in H1-hESCs treated at 400 nM. Bound regions showed strong reproducibility among independent biological replicates (Fig. S5). By comparison, natural transcription factors, such as OCT4 and NANOG, that are vital for the stem cell state bind ∼4,000 and ∼5,000 distinct genomic loci in H1-hESCs, respectively (32). Compared with transcription factors, nucleosomes and PTMs of histones are more broadly distributed across the genome. For example, trimethylation of lysine 4 of histone H3 (H3K4me3) and dimethylation of lysine 79 of histone H3 (H3K79me2), histone modifications indicative of actively transcribed regions, are each found at ∼30,000 loci across the H1-hESC genome (32). We also profiled 2 and 4 at 20 nM (Figs. S6 and S7). In essence, 2 and 4 exhibit genome-wide distributions that are similar to natural transcription factors.
Fig. S5.
Reproducibility and specificity of COSMIC-seq in hESCs. (A) Overlap of regions bound by 2 and 4. (B) Heat maps of COSMIC signal centered on the bound regions of 2. (C) Heat maps of COSMIC signal centered on the bound regions of 4. Rep, replicate. Psoralen derivative 6 and DMSO from Anders et al. (48) are included for reference.
Fig. S6.
Genome-wide distribution of 2 and 4 at 20 nM shows polyamides bind to loci predicted by genomescapes. (A) Process to generate genomescapes. Genomescapes are generated by assigning an intensity to every 10-bp sequence in the genome from the CSI-SEL data. (B) Examples of 2 and 4 binding loci predicted by genomescapes. Signal tracks show the occupancy of 2 and 4. Tag density is plotted on the y axis (normalized to input DNA and 107 tags). Genomescapes of each polyamide are shown below the COSMIC tracks. (C) Heat maps reveal the selective enrichment of 2 and 4 at top predicted loci. We predicted binding of 2 and 4 to each locus in the genome with a model that incorporates clustered binding, designated the “summation model” (31). (Left) Tag density of each polyamide is shown for the top 1,000 nonoverlapping predicted hairpin loci. (Right) Tag density of each polyamide is shown for the top 1,000 nonoverlapping predicted linear loci. (D) Comparison of the top predicted sites with the bound regions of 2 and 4.
Fig. S7.
Distribution of bound regions of 2 and 4 at 20 nM across active and repressive chromatin sites. (A) Polyamides binding to loci in active and repressive chromatin states. Patterns of 2 and 4 compared with patterns of the indicated factors and chromatin states in H1-hESCs. The signal traces are grouped in polyamides (PAs), transcription factors (TFs), RNA polymerase II (Pol2), histone PTMs associated with active chromatin (active), chromatin accessibility as measured by hypersensitivity to the enzyme DNase (DNase HS), and histone PTMs associated with repressive chromatin (repressive) (32). ChromHMM demarcates the genome into one of 12 different chromatin states (legend at bottom of figure) (49). Polyamides 2 and 4 are plotted by normalized tag density (tags per 107 tags normalized to input), and ChIP-seq data are plotted by normalized signal. (B) Polyamide-bound regions distribute across diverse chromatin states. The distribution of the bound regions of 2 and 4 across the 12 different chromatin states is shown. By contrast, chromatin marks, transcription factors, and the chromatin landscape in H1-hESCs are highly biased for particular chromatin states.
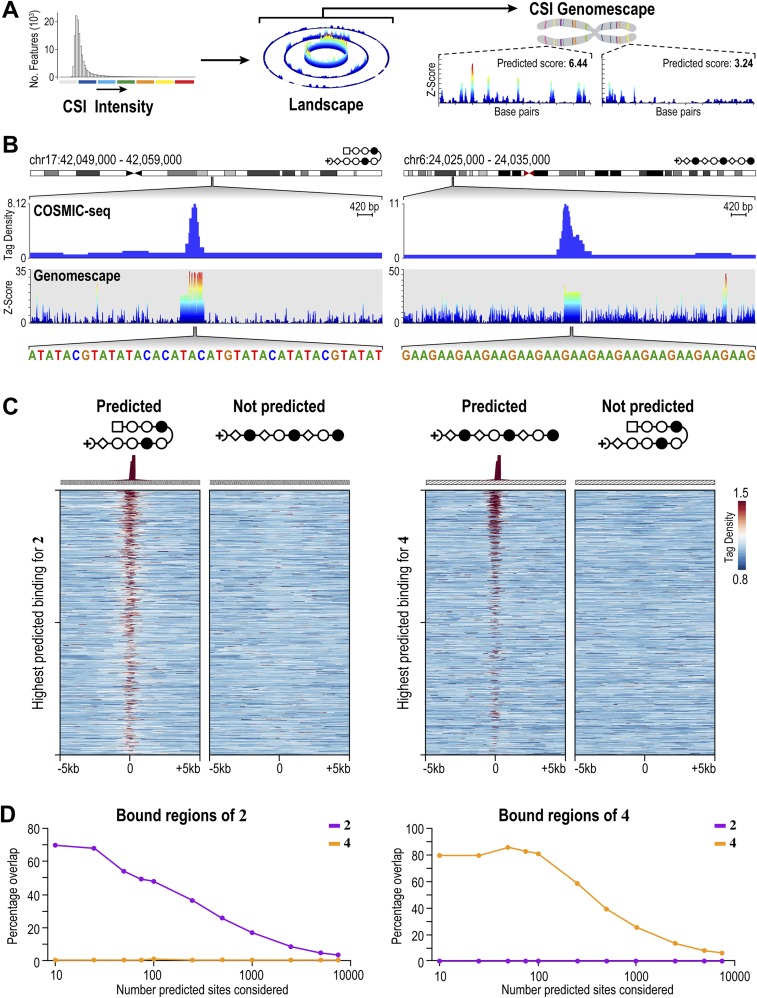
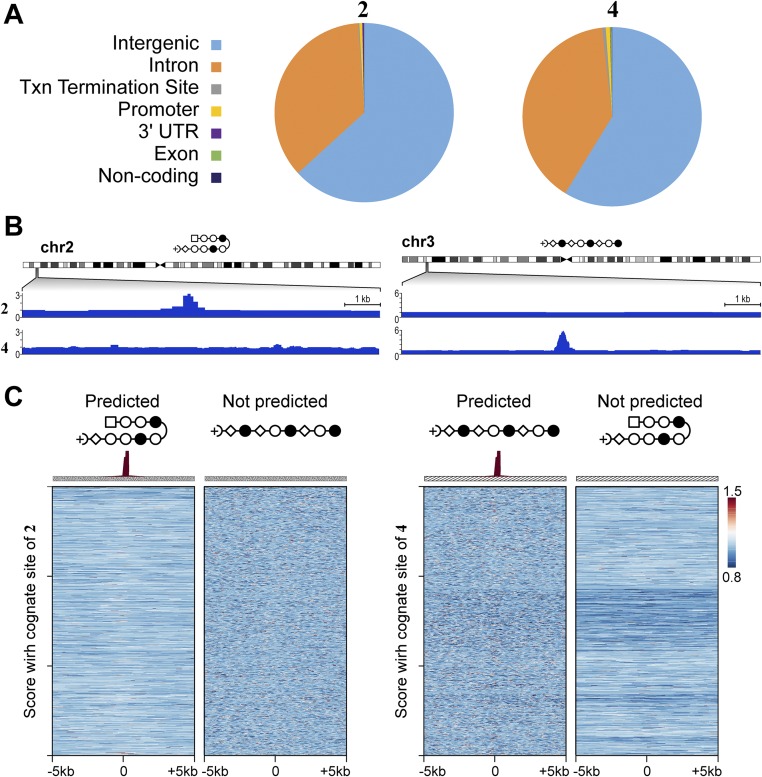
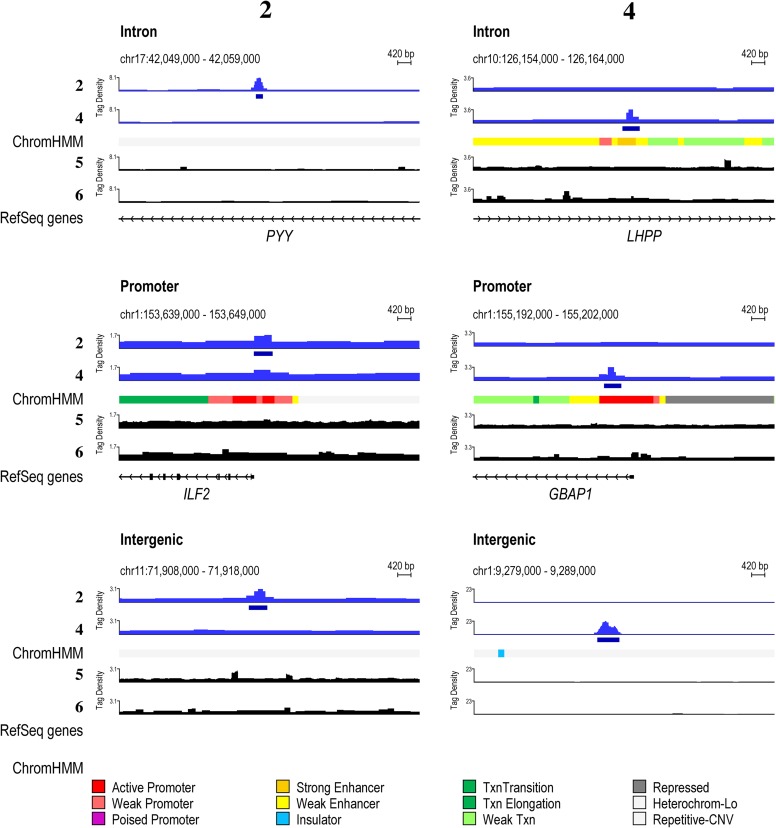
Polyamide-bound loci are found across many genetic elements, including promoters, but most frequently in introns and intergenic elements (Fig. S8A). This finding is consistent with the fact that ∼95% of the genome is intergenic and intronic. In general, the linear polyamide 4 exhibited increased COSMIC-seq signal across the genome, consistent with its ability to bind more broadly than the hairpin polyamide 2. The signal tracks are displayed by the tag density, which is the number of tags normalized to 107 tags and input DNA (43). We observed many bound regions that are predicted based on pairing rules of polyamides and the more comprehensive CSI-genomescapes that are derived from in vitro binding studies. For example, the linear polyamide was designed to target GAA repeats, and we detected a bound region for 4 on chromosome 3 (8) (Fig. 3B). We also predicted hairpin polyamide binding to a locus on chromosome 2 with multiple repeats of WTACGTW; COSMIC-seq revealed that this locus was clearly bound by 2 (Fig. 3B).
Fig. S8.
Comparison of the genome-wide distribution of 2 and 4 with functional elements. (A) Annotation of peaks across functional elements. Txn, transcription. (B) For each of the two loci in Fig. 3B, we show the signal track of the polyamide not predicted to be bound as a control. (C) Predictions based on scoring loci with a single cognate site do not show enrichment. Heat maps of COSMIC signal for 2 and 4. Here, we scored each locus for only its highest affinity consensus motifs 2 and 4. (Left) Tag density of each polyamide (normalized to input DNA and 107 tags) is shown for the top 1,000 nonoverlapping predicted hairpin loci. (Right) Tag density of each polyamide is shown for the top 1,000 nonoverlapping predicted linear loci.
Fig. 3.
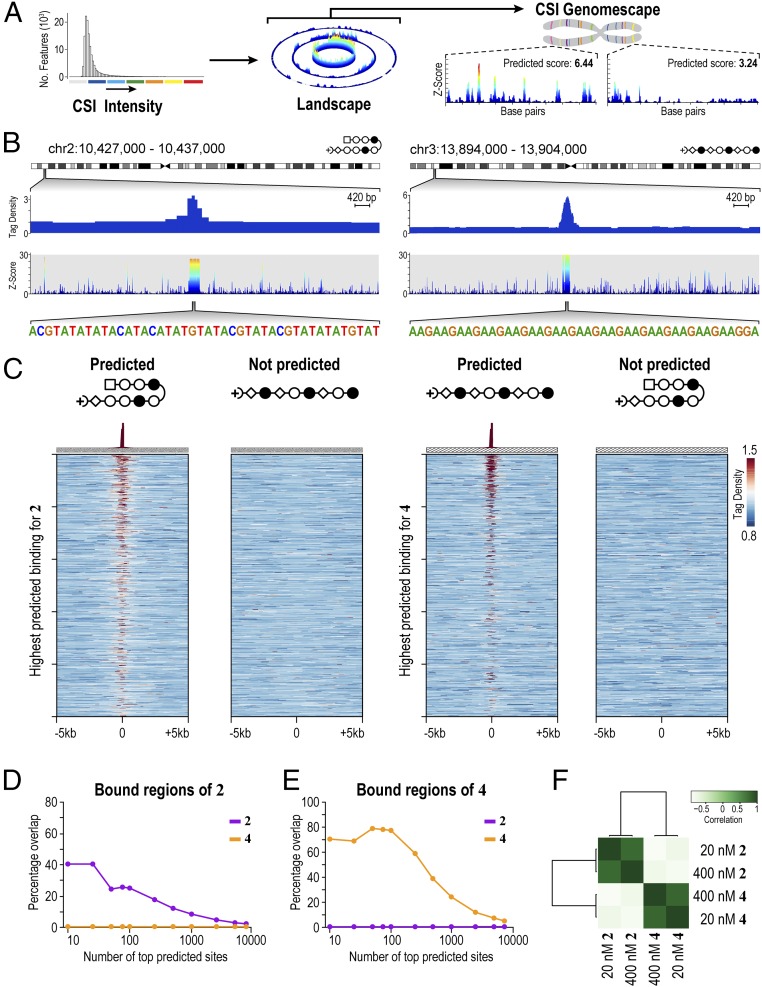
Genome-wide distribution of 2 and 4 shows polyamides bind to loci predicted by genomescapes. (A) Process to generate genomescapes. Genomescapes are generated by assigning an intensity to every 10-bp sequence in the genome from the CSI-SEL data. (B) Examples of 2 and 4 binding loci predicted by genomescapes. Signal tracks showing the occupancy of 2 and 4. Tag density is plotted on the y axis (normalized to input DNA and 107 tags). Genomescapes of each polyamide are shown below the COSMIC tracks. (C) Heat maps reveal the selective enrichment of 2 and 4 at top predicted loci. We predicted binding of 2 and 4 to each locus in the genome with a model that incorporates clustered binding, designated the SOS model (31). (Left) Tag density of each polyamide is shown for the top 1,000 nonoverlapping predicted hairpin loci. (Right) Tag density of each polyamide is shown for the top 1,000 nonoverlapping predicted linear loci. (D) Comparison of the top predicted sites to the bound regions of 2. (E) As in D for the bound regions of 4. (F) Correlation between COSMIC-seq datasets. The bound regions of 2 and 4 from 20 nM and 400 nM treatments were correlated with deepTools.
We next asked how well in vitro binding preferences predict polyamide distributions in live cells. Similar analyses with transcription factors show limited success, primarily because most transcription factors are dependent on chromatin accessibility (44). Although commonly used bioinformatic methods annotate genomic regions using only the highest affinity consensus sites (45), DNA-binding proteins in cooperative complexes bind weak- and moderate-affinity binding sites that are typically not considered in modeling genomic occupancy profiles (31, 46). Consequently, most computational models predict genome-wide binding patterns of natural transcription factors with varying success (47). In comparing COSMIC signals with binding predictions from CSI-derived genomescapes, we observed that the sum of all in vitro determined binding intensities (Z-scores) tiled across an ∼400-bp window most reliably predicted in vivo occupancy at a genomic locus (31). Here, this “summation of sites” (SOS) model is used to predict binding potential for 2 and 4 across the human genome (Materials and Methods). When the top predicted binding sites of 2 and 4 are rank-ordered, a strong correlation to the corresponding COSMIC-seq signal from H1 cells was readily evident (Fig. 3C). Consistent with sequence-specific binding in live cells, hairpin 2 is not found at the loci predicted by genomescapes for the linear polyamide 4 and, vice versa, 4 is not found at the loci predicted for 2 (Fig. 3C). Consistent with this observation, we observe strong congruence between the top SOS-predicted binding sites and the observed bound regions identified from COSMIC-seq (Fig. 3 D and E). A model that scored each locus based solely on the presence of single high-affinity consensus motifs (often displayed as a DNA logo) failed to show any pattern of enrichment in COSMIC-seq signal (Fig. S8C). Comparison of COSMIC-seq data between two different doses of polyamide (20 nM and 400 nM) conjugate showed a strong overlap in signal and in bound regions identified (Fig. 3F). The strong congruence between genomescape-based predictions and COSMIC-seq–based binding patterns was unexpected because our SOS model is derived from in vitro binding energetics; no chromatin accessibility information is considered.
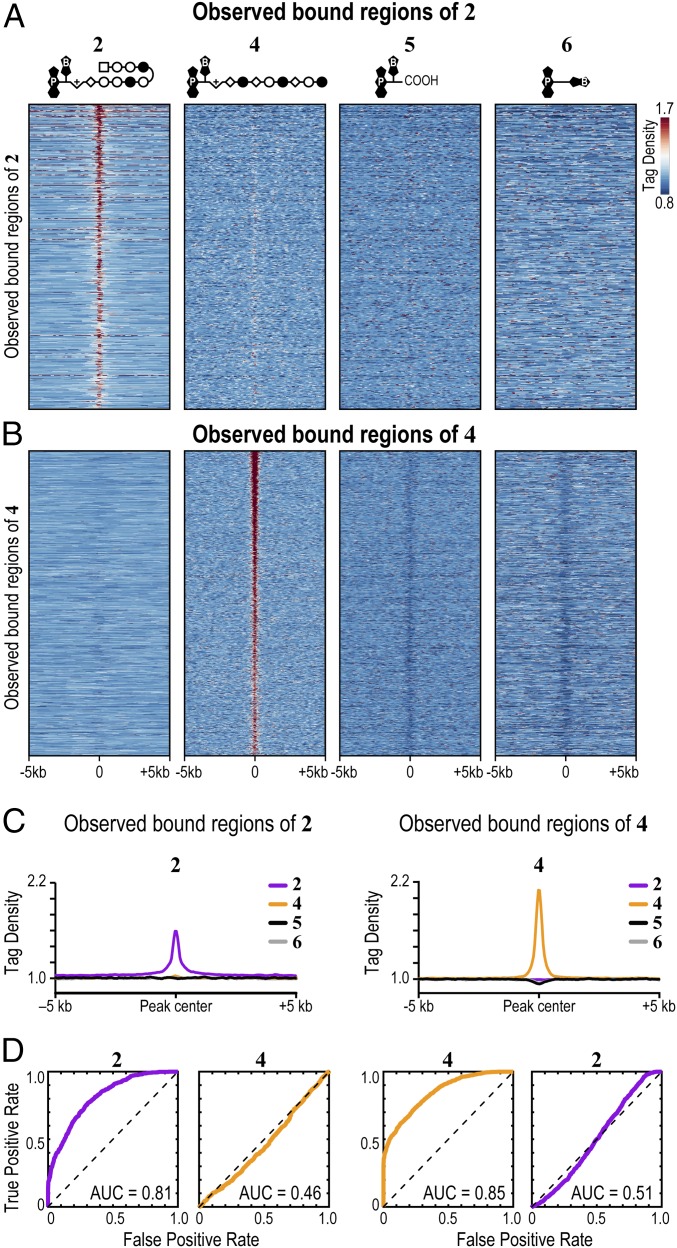
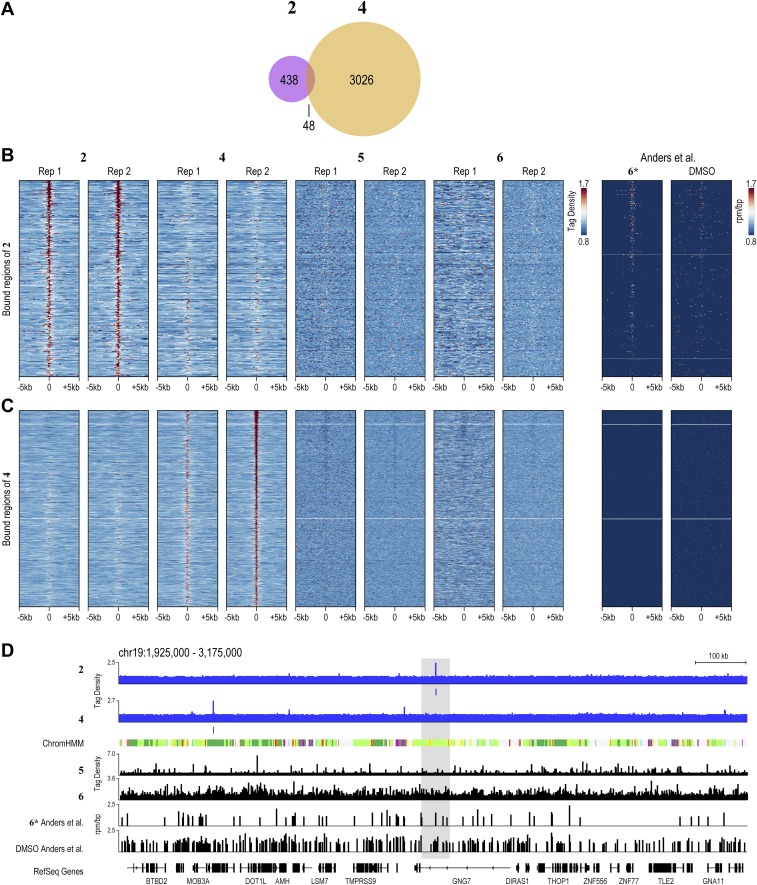
In an unguided test of specificity, we examined if genomic loci identified by COSMIC-seq analysis of different compounds are specifically enriched for the given compound. In particular, we examined whether bound regions represent sites of the genome that permit nonselective binding of any DNA ligand such as minor groove-binding polyamides or base-intercalating psoralen derivatives (molecules 5 and 6). In further support of the sequence-specific binding in vivo, COSMIC signals from 4, 5, and 6 show no pattern of overlap at genomic loci bound by 2 (Fig. 4A and Fig. S5). A similar absence of overlap is observed for sites bound by the linear polyamide 4 (Fig. 4B and Fig. S5). Metagene analysis of regions bound by 2 and 4 unambiguously demonstrates enrichment of 2 in regions bound by 2 and poor enrichment for either 4 or the two derivatives of psoralen, 5 and 6, at those regions (Fig. 4C). We also performed COSMIC on cells treated with DMSO, the vehicle used to dissolve the polyamide conjugates; no enrichment of any sequence was observed, providing further evidence for the specificity of the COSMIC-seq method. When we compared our COSMIC-seq data with a DMSO control from a previously published study, negligible background signal from DMSO is observed at some sites (48); the widespread low-level signal from both DMSO and even psoralen confirms that COSMIC-seq–based identification of genomic regions of 2 and 4 is reliant on polyamide specificity (Fig. S9D). We conclude that COSMIC-seq provides a reproducible method to study the genome-wide binding properties of synthetic genome readers.
Fig. 4.
Observed bound regions of 2 and 4 show specific enrichment at loci explained by CSI-genomescapes. (A) COSMIC signals from 4, 5, and 6 show no pattern of overlap with loci bound by 2. (B) COSMIC signals from 2, 5, and 6 show no pattern of overlap with loci bound by 4. (C) Specific enrichment of polyamides at bound regions shown by metagene analysis. Psoralen analogs 5 and 6 are not enriched at polyamide-bound regions. The average signal from biological duplicates in 50-bp bins is shown. (D) Bound regions of 2 and 4 are explained by the SOS model. ROC curves of bound regions for 2 and 4 are shown. CSI-derived specificity data of 4 failed to explain binding patterns of 2, and vice versa. The area under the ROC curve (AUC) quantifies the degree to which the SOS model could distinguish bound regions from unbound regions. AUC = 0.5 represents no accuracy, whereas AUC = 1.0 represents perfect accuracy.
Fig. S9.
Reproducibility and specificity of 20 nM COSMIC-seq data in hESCs. (A) Overlap of bound regions of 2 or 4, as indicated. Anders et al. (48). (B) Heat maps of COSMIC signal centered on the bound regions of 2. (C) Heat maps of COSMIC signal centered on the bound regions of 4. (D) Locus bound by 2 reveals pervasive low level signal from DMSO and 6* from Anders et al. (48). Psoralen derivative 6 and DMSO from Anders et al. are included for reference.
We next asked whether genomic loci bound by polyamides in live cells could be distinguished from nontarget loci by the CSI-based SOS model. Bound regions of the genome identified by COSMIC-seq data are defined as true-positive results, whereas regions not bound were defined as true-negative results. Receiver operating characteristic (ROC) curves were generated to evaluate the ability of in vitro-generated CSI data to predict in vivo COSMIC data accurately. In ROC analysis, the area under the curve (AUC) varies from 0.5 to 1.0, where 0.5 represents an inability to perform better than random guesses and 1.0 represents absolute accuracy. The higher the AUC values are above 0.5, the more accurate is the computational model in identifying bound regions from unbound regions. Loci bound by 2 in vivo are best explained by the SOS model based on in vitro CSI profiles of 2 (AUC = 0.81). Similarly, loci bound by 4 in vivo are best explained by the SOS model that uses in vitro specificity CSI profiles of 4 (AUC = 0.85; Fig. 4D). As a control, we computationally evaluated the ability of genomic regions bound by 2 to be predicted by CSI-derived specificity data of 4, and vice versa. The reciprocally mismatched data failed to capture binding patterns of the other polyamide (AUC = 0.46 and AUC = 0.51 for regions bound by 2 and 4, respectively; Fig. 4D). In conclusion, we observe selective enrichment of 2 and 4 at cognate loci within the genome of live cells.
Polyamides Bind Cognate Sites Across Diverse Chromatin States.
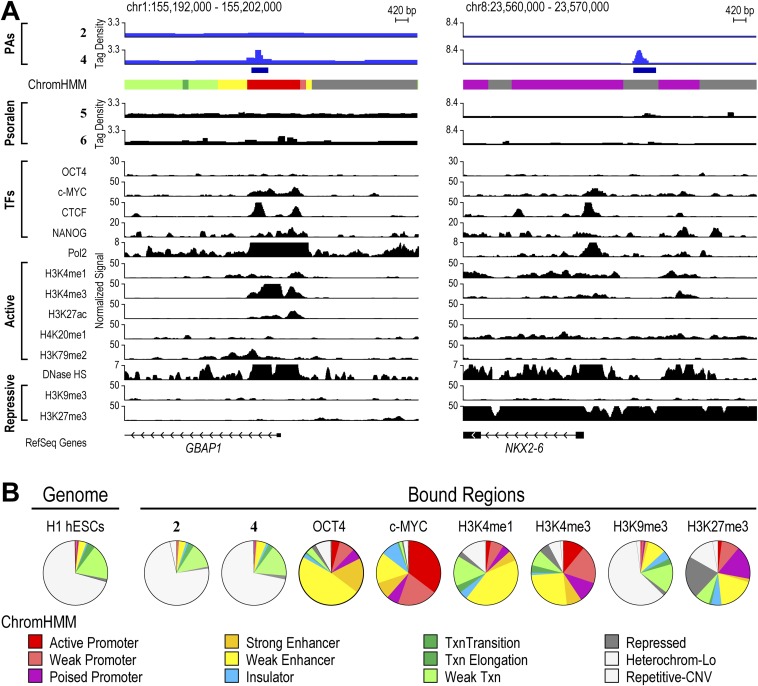
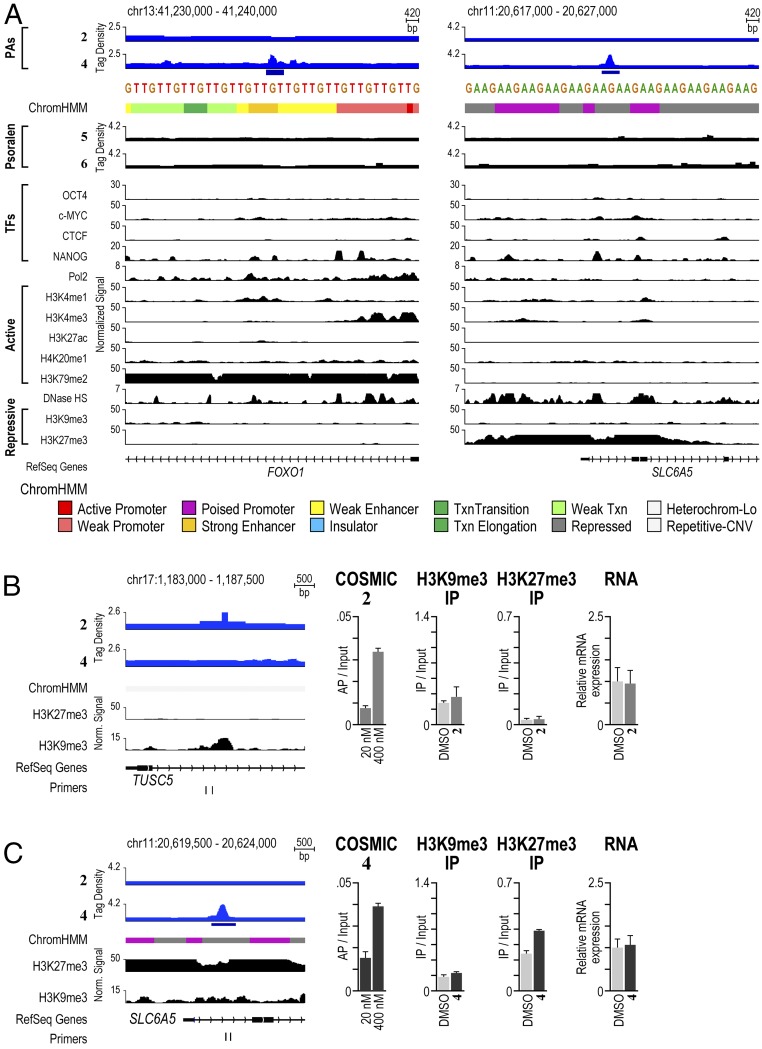
We next explored the consequences of different chromatin states on genome-wide binding profiles displayed by polyamides in H1-hESCs. The strong correlation between COSMIC-seq signal and our SOS model suggested that unlike natural transcription factors, polyamides were able to bind cognate sites that occurred in different chromatin states. To examine this possibility systematically, we compared regions bound by 2 and 4 with ChromHMM, a genome-wide chromatin map that demarcates every position of the genome into one of 12 different chromatin states (49). These high-resolution maps have proven valuable in classifying genomic regions that occur in diverse chromatin states (50). Surprisingly, we found polyamides occupying cognate sites located in both active and repressive chromatin states (Fig. 5A). One region bound by 4 on chromosome 13 was situated in chromatin marked by dimethylation of H3K79, a modification associated with active chromatin (Fig. 5A). Another region bound by 4 on chromosome 11 was located in chromatin marked by trimethylation of H3K27, a modification associated with repressive chromatin. Regions bound by 2 were also located in both repressive and active chromatin states (Figs. S10 and S11).
Fig. 5.
Polyamide-based genome readers can access their target sites in active and repressive chromatin sites. (A) Polyamides binding to loci in active and repressive chromatin states. Patterns of 2 and 4 compared with patterns of the indicated factors and chromatin states in H1-hESCs. On the left, the signal traces are grouped in PAs, transcription factors (TFs), RNA polymerase II (Pol2), histone PTMs associated with active chromatin (active), chromatin accessibility as measured by hypersensitivity to the enzyme DNase (DNase HS), and histone PTMs associated with repressive chromatin (repressive) (32). ChromHMM demarcates the genome into one of 12 different chromatin states (49). Polyamides 2 and 4 are plotted by normalized tag density (tags per 107 tags normalized to input DNA), and ChIP-seq data are plotted by normalized signal. (B) Analysis of a repressive region enriched in 2. The locus was profiled by COSMIC-qPCR to verify enrichment of 2. In addition, ChIP was performed to profile the enrichment of the repressive chromatin marks H3K9me3 and H3K27me3. Finally, the expression of the nearby gene, TUSC5, was profiled by RT-PCR. (C) As in B, for a repressive region enriched in binding by 4. The expression of the nearby gene, SLC6A5, was profiled by RT-PCR.
Fig. S10.
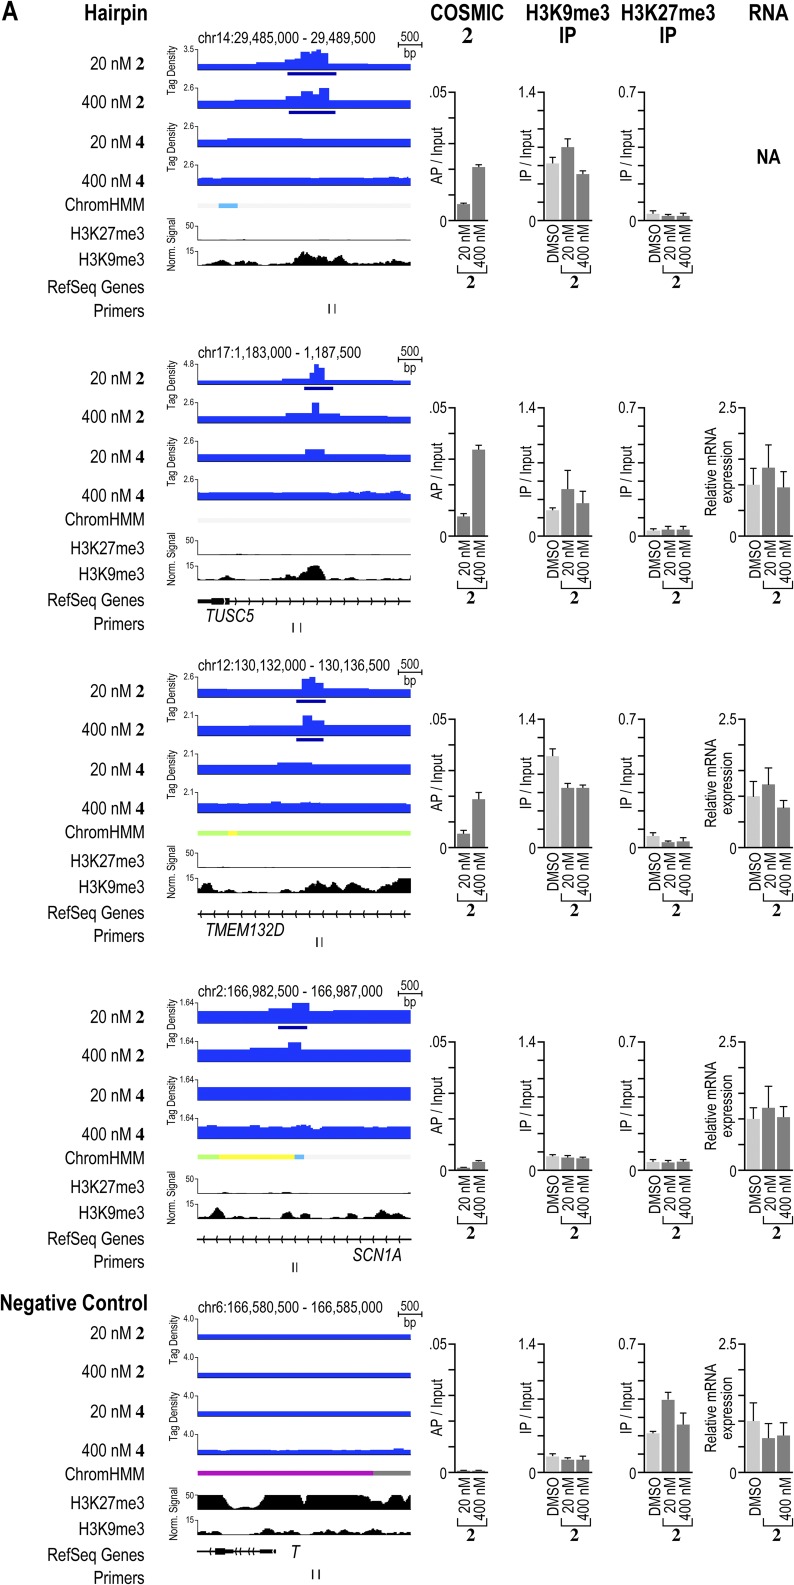
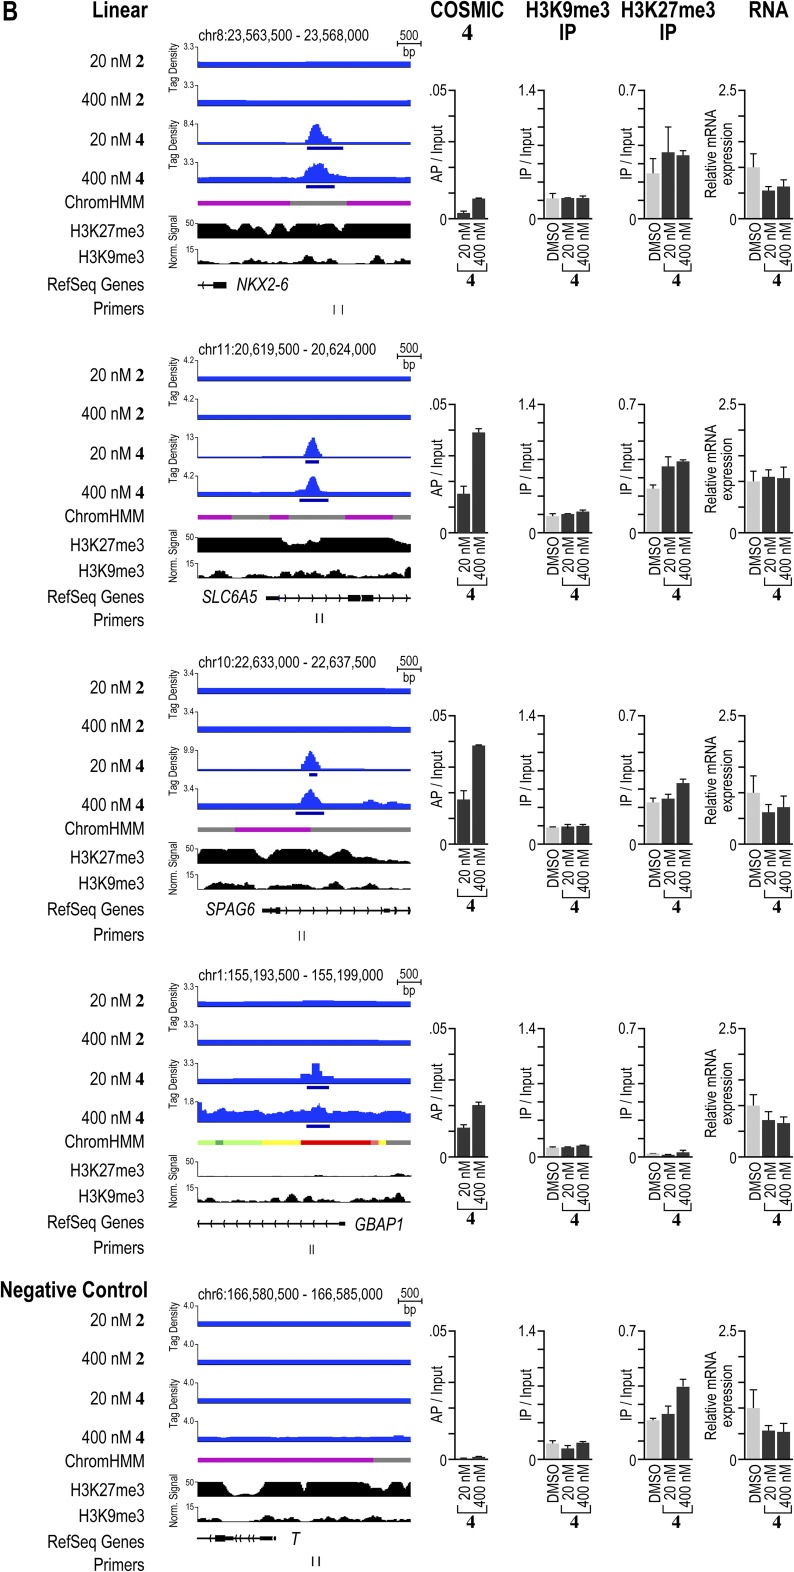
Validation of polyamide enrichment and chromatin state at several loci. (A) Comparison of signal traces, COSMIC-qPCR validation, ChIP of the repressive marks H3K9me3 and H3K27me3, and gene expression profiling by RT-PCR for several regions enriched in binding by 2 found in repressive or active chromatin states. (B) As in A for loci enriched in binding by 4. As a negative control, a locus near Brachyury (T) was chosen. This locus does not show enrichment for polyamides 2 or 4. We designed the primer pairs to be situated as closely to the bound region of interest as possible, to bind uniquely in the human genome, to enrich amplicons <250 bp, and to avoid the direct amplification of repetitive clustered sites.
Fig. S11.
Summary of synthetic genome readers binding to different functional elements and chromatin states. Polyamide derivatives 2 and 4 bind introns, promoters, and intergenic regions. Patterns of 20 nM 2 and 4 compared with psoralen analogs 400 nM 5 and 6 as well as chromatin states in hESCs.
To examine whether polyamide binding alters the underlying chromatin state at polyamide-binding sites, we used chromatin immunoprecipitation (ChIP) to compare the levels of repressive H3K9me3 and H3K27me3 at several polyamide-binding sites after treatment with 2 or 4 with a vehicle control. In Fig. 4, we display an H3K9me3-rich locus on chromosome 17 that is bound by 2. Treatment with 2 did not change the H3K9me3 enrichment significantly (Fig. 5B). Similarly, levels of H3K27me3 at a locus on chromosome 11 did not decrease upon binding by 4 (Fig. 5C). Treatment with 4 led to a slight increase in this repressive mark, confirming that the region bound remained in a repressive chromatin state (Fig. 5C). The results at these and other loci that we examined showed that polyamide treatment preserved the presence of repressive marks following polyamide treatment (Fig. 5 and Fig. S10).
Next, to examine whether polyamide binding perturbed expression of proximal or overlapping genes, we performed RT-PCR at specific loci. As shown in Fig. 5B, the locus on chromosome 17 targeted by 2 is located shortly downstream of the transcription start site of TUSC5. However, cells treated with 2 showed no significant change in the expression of TUSC5 compared with a vehicle (DMSO) control (Fig. 5B). Similarly, the locus on chromosome 11 targeted by 4 is situated just downstream of the transcription start site of SLC6A5, but treatment with 4 did not alter the expression of this gene (Fig. 5C). We also analyzed the expression of several other genes located proximal to bound regions of 2 or 4 and found only modest changes in gene expression upon treatment (Fig. S10).
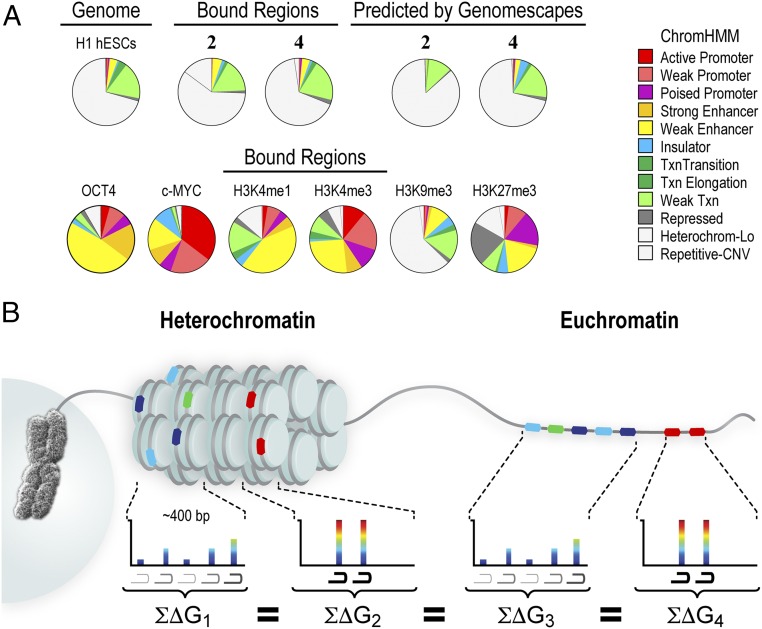
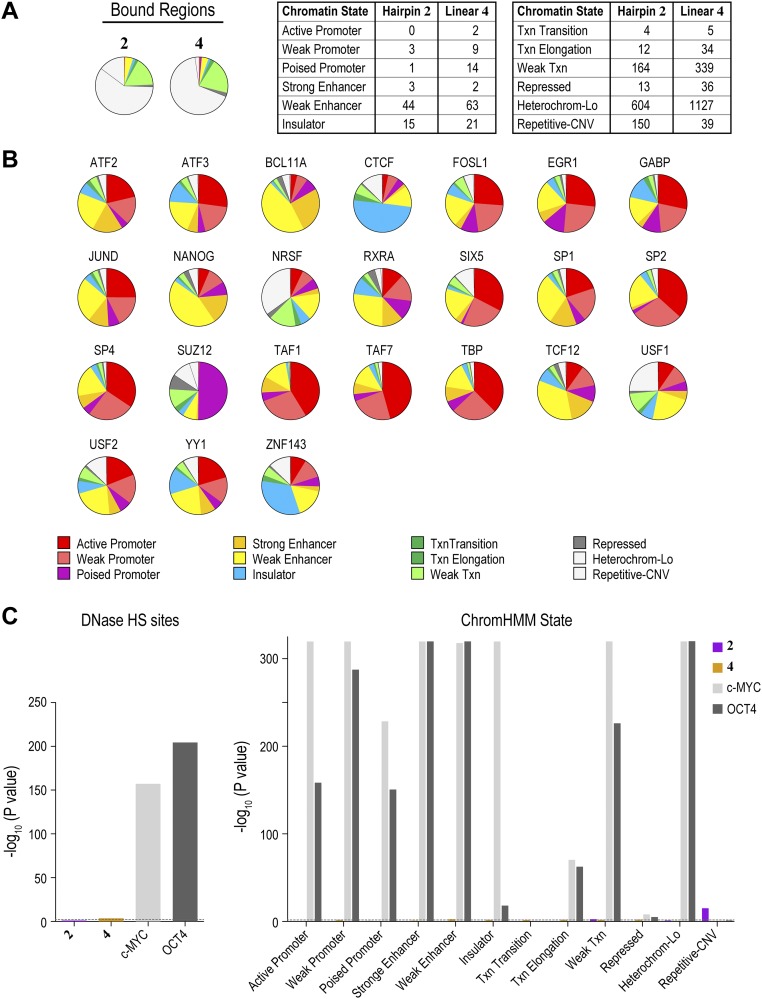
We next examined the propensity of all polyamide-targeted genomic loci to exist in one of the 12 chromatin states defined by ChromHMM (Fig. 6A). In stark contrast to the majority of natural transcription factors, polyamides did not display any overt preference for a particular chromatin state (Fig. 6A). The observed distribution of genomic regions bound by 2 and 4 mirrored the distribution of the H1-hESC genome in various chromatin states. Moreover, the binding profiles closely matched the profiles predicted by our SOS model (Fig. 6A). By contrast, genomic regions bound by endogenous transcription factors OCT4 and c-MYC are strongly associated with open chromatin states (32). These observations were confirmed by the Fisher’s exact test with Bonferroni adjustment for multiple testing (Fig. S12C). Thus, although the endogenous transcription factors c-MYC, OCT4, and several others show striking preferences for open-chromatin states, the synthetic genome readers 2 and 4 were found to occupy all chromatin states (Fig. S12B). We conclude that polyamides possess the ability to bind to cognate sites across diverse chromatin states, including highly repressive heterochromatin that is generally refractory to most natural and artificial DNA binding factors.
Fig. 6.
Polyamide binding in diverse chromatin states across the genome. (A) Polyamide-bound regions distribute across diverse chromatin states. The distribution of the bound regions of 2 and 4 across the 12 different chromatin states is shown. By contrast, chromatin marks, transcription factors, and the chromatin landscape in H1-hESCs are highly biased for particular chromatin states (more examples are shown in Fig. S12). CNV, copy number variation; Lo, low; Txn, transcription. (B) Polyamides bind to target sites found within both repressive heterochromatin and euchromatin. Binding is best explained by a model in which clustered sites, composed either of a few high-affinity sequences or of multiple moderate- and weak-affinity sites, exhibit equivalent polyamide occupancies across the genome. In heterochromatin, we show nucleosomes as discs with 146 bp wrapped around the histone octamer. We next show the SOS model in euchromatin.
Fig. S12.
Synthetic genome readers distribute across diverse chromatin states. (A) Polyamide derivatives 2 and 4 show distributions across chromatin states that resemble the distributions predicted by CSI-Genomescapes. Distribution of loci predicted to be bound by 2 and 4 across the 12 chromatin states. For reference, the distribution of regions observed by COSMIC-seq is shown. (B) Distribution of 24 endogenous transcription factors across the 12 chromatin states in hESCs (32). (C) Two-tailed Fisher’s exact test confirms that endogenous transcription factors exhibit strong preferences for specific DNase HS sites and chromatin states, whereas 2 and 4 show little preference for DNase HS sites or specific chromatin states. The dashed line indicates a Bonferroni-adjusted P value of 0.0038.
Discussion
Here, we report a genome-wide map of polyamide distributions in live human cells. Our data reveal (i) COSMIC-seq is a versatile tool for mapping genome-wide binding profiles of DNA-targeting ligands in cells; (ii) polyamides bind loci with clustered sites, often composed of multiple medium- to weak-affinity binding sites; (iii) genome-wide polyamide distribution is explained by an SOS computational model that uses in vitro specificity and affinity data; and (iv) polyamides bind to cognate sites located across all chromatin states. Taken together, COSMIC-seq addresses a long-standing question on the genome-binding properties of polyamides in live cells.
The enrichment of COSMIC signal at clustered binding sites spanning a range of affinities suggests that submaximal affinity sites are balanced by increased avidity for multiple sites (31) (Fig. 6B). Evolutionarily conserved Hox transcription factors were recently found to rely on clustered low-affinity sites to regulate key developmental genes in Drosophila (46). In this respect, polyamides behave like natural transcription factors when binding genomic loci. A key design principle that emerges from this genome-wide view of polyamide-binding sites is that loci might best be targeted through combined action at multiple clustered sites. As a resource for further evaluation and mining, a database containing the top 1,000 loci predicted to be targeted by 2 and 4 is now available as Dataset S1.
Although transcription factors can directly interact with partners to bind cooperatively to DNA (51), it is unclear whether the clustered binding by polyamides is cooperative in nature. Polyamides lack an interaction domain to facilitate such cooperative interaction directly, but this lack of an interaction domain does not preclude a cooperative interaction. Allosteric modulation of DNA may provide one explanation for this observation. Transcription factors such as glucocorticoid receptor were recently reported to modulate DNA allosterically to facilitate binding by another DNA-binding protein that does not appear to make protein–protein contacts (52). Furthermore, we have previously shown that a polyamide, lacking a domain to interact with a protein partner, facilitates the binding of a transcription factor to an adjacent site by 10-fold (53). The clustered sites bound by polyamides may also act as local energy sinks, preventing polyamides from escaping the locus and thereby increasing the local concentration of polyamide at such sites. Whether either, or both, of these mechanisms contributes to clustered binding emerges as an important question going forward.
The role for chromatin accessibility in influencing polyamide binding has remained ambiguous, with structural studies displaying polyamide binding to solvent-exposed cognate sites on nucleosomes and a recent report suggesting that open chromatin is required for the bioactivity of a polyamide-chlorambucil conjugate (28–30). Here, we provide direct evidence for polyamides binding to loci located within both active and repressive chromatin in cells (Fig. 6). It is important to note that the chromatin states in hESCs may be more (or less) accessible compared with other cell types (54). Whether similar binding profiles will be observed in different cell types despite different chromatin and genetic landscapes is the focus of our ongoing efforts, as is the generation of an atlas of the genome-wide distributions of a wide range of polyamides. [Note that while this paper was under review, Sugiyama and coworkers (55) reported the genome-wide mapping of one polyamide in nuclei isolated from fibroblasts.]
The ability of polyamides to bind cognate sites located in repressive chromatin may be facilitated by the change in DNA conformation induced by wrapping around the histone octamer. When DNA wraps around the histone octamer, the minor groove of DNA is widened to accommodate the increased curvature (28, 56). When polyamides bind to DNA, the width of the minor groove expands by up to 4 Å to accommodate the molecule (57). Nucleosomal DNA, even in heterochromatin, may thus be partially preorganized to accommodate polyamide binding in the minor groove. The linear polyamide (3) studied here was designed to bind to GAA repeats in the first intron of frataxin, a locus that appears to be situated within heterochromatin marked by H3K9me3 (8). Taken together, the ability of polyamides to access heterochromatin (a major barrier to binding to natural and artificial DNA-binding factors) opens unique opportunities to deploy this class of synthetic genome readers to regulate gene networks that direct cellular fate and function.
A few transcription factors are known to possess the ability to bind cognate sites on nucleosomes and evoke subsequent remodeling of chromatin (58). Such “pioneer” factors facilitate binding by other transcription factors and are usually necessary for the maintenance of cell identity. The forced overexpression of pioneer factors is often sufficient for cell-fate conversion (26). Our data suggest that polyamides, by virtue of being able to access repressive heterochromatin, could be harnessed to serve as pioneer factors, but the conditions under which they might do so will guide the next phase of polyamide design.
The ultimate goal of our efforts is to define genome-targeting rules for precise delivery of synthetic molecules that regulate gene expression and sculpt the transcriptome in a predetermined manner. Where examined, clustered sites appear to correlate with maximal impact on gene expression (21, 31). Integrating COSMIC-seq data of a larger set of polyamides (examined at different dosages and from different cell types) with data that captures time-resolved remodeling of the transcriptome will elucidate the dynamic relationship between target site occupancy and gene expression.
The COSMIC-seq approach that we describe here is a robust and broadly applicable method that can be readily extended to map the genome-wide binding properties of other classes of DNA-binding molecules, including several genome-directed therapeutics. COSMIC-seq will be instrumental in the genome-guided design of molecules that serve as precision-targeted therapeutics.
Materials and Methods
Molecules Studied.
Polyamides, peptides, and trifunctional derivatives of polyamides were synthesized as previously described (31, 33). Psoralen analog 6 was from ThermoFisher.
CSI Analysis by SELEX-Seq.
Cognate binding sites for 2, 4, and 5 were determined by the high-throughput SELEX-seq method (39). Polyamide derivatives 2 and 4 (20 nM) or 5 (2 μM) were incubated with 100 nM DNA library in binding buffer [1× PBS (pH 7.6), 50 ng/μL Poly(dI-dC)] and incubated for 1 h at room temperature. Ligand–DNA complexes were captured with streptavidin-coated magnetic beads (Dynabeads; Life Technologies) per the manufacturer’s instructions. After PCR amplification and purification, one additional round of PCR was performed to incorporate Illumina sequencing adapters and a unique 6-bp barcode for multiplexing. Samples were sequenced on an Illumina HiSeq 2000 at the University of Wisconsin–Madison DNA Sequencing Facility in the University of Wisconsin–Madison Biotechnology Center. The occurrence of every k-mer (lengths of 8–12 bp), summed over all reads, was counted using a sliding window of size k. To correct for biases in the initial DNA library, a standardized enrichment score (Z-score) was calculated by normalizing the counts of every k-mer to the expected number of counts in the unenriched library, with a fifth-order Markov model derived from the sequenced starting library (59, 60).
Analysis of CSI Data.
Sequence specificity landscapes were generated from quantile-normalized intensity data as previously described (21). The top 100 normalized Z-scores from CSI analysis were used to generate position weight matrices. MEME was run with the following parameters: -dna -mod anr or zoops -nmotifs 3 -minw 6 -maxw 12 -time 7,200 -revcomp.
Cell Culture.
H1-hESCs were maintained in essential 8 media grown on Matrigel-coated plates. Cells were passaged with StemPro Accutase (Life Technologies) at ≤90% confluency. Cellular toxicity was measured with the Cell Counting Kit (CCK-8; Dojindo Molecular Technologies) per the manufacturer’s instructions.
COSMIC.
COSMIC was performed as previously described, with minor modifications described in SI Materials and Methods (31). Each sample was repeated in biological duplicate. Briefly, at 40% confluency, 2.5 × 10⁷ H1-hESCs were treated with varying concentrations of 2 or 4 (20 nM, 400 nM) or 400 nM 5 or 6 of the molecule (0.1% DMSO final concentration).
NGS of COSMIC Samples.
Samples were sequenced on an Illumina HiSeq 2500 with a read length of 51 bp. Base pairs were called with Casava v.1.8.2 (Illumina). Sequencing reads were mapped to the human genome (hg19) with Bowtie v 1.0.0 (best -m 1) to yield unique alignments. Samples were further processed with Hypergeometric Optimization of Motif Enrichment (HOMER) to produce a signal track (43). The tag density for each factor was normalized to 107 tags and input DNA, and displayed with the Integrated Genome Viewer v 2.3. Bound regions were identified with SPP v 1.10.1 by the irreproducible discovery rate methodology according to ENCODE guidelines (42, 61). Annotations of peaks were performed with HOMER. Signal traces for metagene analysis were prepared with deepTools (62) from the average of the median signal from biological replicates. All data are deposited in the Gene Expression Omnibus (accession no. GSE70267).
ChIP.
H1-hESCs were incubated with 2 or 4 at the indicated concentrations, or with a DMSO (0.1%) control, and fixed in 1.5% (vol/vol) formaldehyde for 15 min after 24 h of treatment. Harvested cells were flash-frozen, and then sonicated and lysed. Lysates were immunoprecipitated overnight with H3K9me3 antibody (no. ab8898; Abcam) or H3K27me3 antibody (no. 9733; Cell Signaling ) at 4 °C. Immunoprecipitated histone marks were purified with protein G magnetic beads (no. 10004D; Thermo Fisher Scientific) after a series of five washes. Cross-links of protein–DNA complexes were reversed by incubating at 65 °C for 6 h. Eluted DNA was treated with RNase A and Proteinase K. Primer pairs are listed in Table S1. Data are from two independent biological experiments, and error bars represent SEM.
Table S1.
Primer pairs for qPCR
| Locus | Forward primer | Reverse primer |
| COSMIC and ChIP | ||
| Nearby locus | ||
| T | CTCTCCCTTCTCCAACTTACACC | GGTCCTTTTGGTGCCTCTTTCTA |
| NME8 | GAGAGCCTTCTGCTCCGATTT | CAAGGTGCGCTTTCCCAAGTG |
| ZNHIT6 | TGGCAACTCAAAGCAGCAAT | TGTAGGGAGCAGGTGAGGAA |
| NKX2-6 | CACCCAGAGACAACATTTTAGTGG | ACAAACACAGTCTACTACGGTCT |
| SLC6A5 | TGGGAATCTGGAAGTGAATACGA | GCCAGGTAGCAAAGACAAGGTTA |
| SPAG6 | CGTGATTTCTCGTCTTGCTTTAGT | GACTGAGGAGTAGAAGGAACGC |
| GBAP1 | GACTGTAGGAGTCAAGTGTGGAG | AGAGTAGTGTGTGCTGAAGGAAG |
| Chr14:29,485,000 | TTTGGGTTGAGTGCTTTGGGATA | TCGAAGATCCTAGTGTTTCCAATC |
| TUSC5 | GCCTCTTGGTTACAGGGAAAGG | GTTCTGTGGTCTCATTGCCTTGG |
| TMEM132D | CACCCATATACCTAATACTCAGAGG | GAAAATACCTTAGAGCGGGCAGA |
| SCN1A | CTTCATCCTCGCCTCACTCTATG | GCGATGTAATGTAAGGTGCTGTC |
| RT-PCR | ||
| Gene | ||
| T | GGGTACTCCCAATCCTATTCTGAC | ACTGACTGGAGCTGGTAGGT |
| NKX2-6 | ATGGACGCGGAACGGATG | CACCTGCGCCTGCGAAA |
| SLC6A5 | GGGGATGAGAATAAGGCCCG | GGATGAGGAAAGCACCTCCC |
| SPAG6 | AGAACGCGGGTGTAATGTCT | AGCTGTGGAAGAATGTCGCA |
| GBAP1 | TACTTCAGGCAGTGTCGTGG | TAGCAGATGATAGGCGGCGA |
| TUSC5 | ACCACCTCCTATGCCCAAGA | TCCACGTTGCCCTGTTGCAT |
| TMEM132D | GCTGGCTCAGAAAACAGTGC | GGACACTCCCAAGTCAGACG |
| SCN1A | CCTTGGTTGGTGGACCTTCA | TCAGTGGTTGTTCCATTGTCA |
Gene Expression.
Cells were treated with the indicated molecules for 24 h. After treatment, cells were harvested and total RNA was purified with the RNeasy Mini Kit (Qiagen), including on-column DNase I treatment (ZYMO Research), according to the manufacturer’s directions. Two-hundred fifty nanograms of cDNA was synthesized from RNA via the iScript cDNA synthesis kit according to the manufacturer’s directions (Bio-Rad). qPCR was performed with iTaq Universal SYBR Green Supermix (Bio-Rad) on a CFX Connect 96 instrument (Bio-Rad). Primer pairs are listed in Table S1. TATA-box binding protein (TBP) was used as a reference gene. Data are from four independent biological experiments, and error bars represent SEM.
SI Materials and Methods
Materials.
Unless otherwise noted, starting materials were purchased from standard chemical suppliers and used without further purification. Water was purified with a Nanopure water purification system (18.2 MΩ). All buffers were filtered (0.2 μm) before use. Oligonucleotides were from Integrated DNA Technologies, Inc. Cell culture reagents were from Invitrogen. Essential 8 (E8) media was prepared as previously described (64).
Polyamide and Peptide Synthesis.
Polyamides were synthesized on a solid support as previously described (31, 33). Cy3-labeled derivatives of 1 and 3 were synthesized previously (21). After synthesis, the polyamide was cleaved from resin by aminolysis with 3,3′-diamino-N-methyldipropylamine (55 °C, 12 h). Polyamide was precipitated twice with diethyl ether, dissolved in 15% (vol/vol) acetonitrile/H2O + 0.1% TFA, and purified by reverse-phase preparative HPLC on a C18 column. Fractions that showed clean polyamide without contaminants were frozen in liquid nitrogen and lyophilized to afford a white or off-white powder. Polyamides were dissolved in DMSO, and concentration was measured by UV/Vis spectroscopy with a molar extinction coefficient of 8650 M−1⋅m−1 at a local maximum wavelength near 310 nm for each N-methylpyrrole, N-methylimidazole, or 3-chlorothiophene.
Psoralen derivative 5 was synthesized by manual Fmoc solid-phase synthesis on 2-chlorotrityl chloride resin by standard procedures. Coupling and deprotection were performed at room temperature for 1 h and 15 min, respectively. After synthesis was complete, 5 was cleaved from the resin with a solution of 95% (vol/vol) TFA, 2.5% (vol/vol) H2O, and 2.5% (vol/vol) triisopropylsilane; purified to ≥95% purity via reverse-phase preparative HPLC; and lyophilized to afford a white powder. The mass calculated for 5 (C43H60N6NaO15S) is 955.37 (observed 955.96). Polyamide conjugates 2 and 4 were prepared as previously described (31). Polyamides were purified as previously described (31). The identity and purity of all molecules synthesized were confirmed by MALDI-TOF mass spectrometry and analytical HPLC. The mass calculated for 2 (C102H131ClN27O24S2) is 2216.90 (observed 2216.68). The mass calculated for 4 (C86H119N24O22S) is 1,871.86 (observed 1,872.38). Psoralen derivative 6 was from ThermoFisher.
CS Analysis by High-Throughput SELEX.
Cognate binding sites for 2, 4, and 5 were determined by the high-throughput (HT) SELEX method (39). A DNA library with a central randomized 20-bp region, flanked by constant sequences for PCR amplification, was purchased from Integrated DNA Technologies. Polyamide derivatives 2 and 4 (20 nM) or 5 (2 μM) were added to 100 nM of DNA library in binding buffer [1× PBS (pH 7.6), 50 ng/μL Poly(dI-dC)] and incubated for 1 h at room temperature. Ligand–DNA complexes were captured with streptavidin-coated magnetic beads (Dynabeads; Life Technologies) per the manufacturer’s instructions. After capture, three quick washes were performed with binding buffer. Beads were resuspended in PCR master mix; the DNA was amplified for 15 cycles and was then purified with the Econospin Purification Kit (Epoch Life Sciences). After purification, one additional round of PCR was performed to incorporate Illumina sequencing adapters and a unique 6-bp barcode for multiplexing. The starting library was also barcoded and sequenced. Samples were sequenced on an Illumina HiSeq 2000 at the University of Wisconsin–Madison DNA Sequencing Facility in the University of Wisconsin–Madison Biotechnology Center. Reads were demultiplexed with the 6-bp barcode and truncated to include only the 20 bp from the random region of the library. The occurrence of every k-mer (lengths of 8–12 bp), summed over all reads, was counted using a sliding window of size k. To correct for biases in the initial DNA library, a standardized enrichment score (Z-score) was calculated by normalizing the counts of every k-mer to the expected number of counts in the unenriched library, with a fifth-order Markov model derived from the sequenced starting library (59).
Sequence Logos.
The top 100 normalized Z-scores from CSI analysis were used to generate position weight matrices. MEME was run with the following parameters: -dna -mod anr or zoops -nmotifs 3 -minw 6 -maxw 12 -time 7,200 -revcomp.
Sequence Specificity Landscapes and Genomescapes.
Sequence specificity landscapes were generated from quantile-normalized intensity data as previously described (21). A seed motif is used to organize the data. The innermost ring (ring 0) displays sequences that contain a perfect match to the seed motif. The next two rings (rings 1 and 2) display sequences with one and two mismatches from the seed motif, respectively. The sequences in the center ring are sorted first alphabetically by motif and then alphabetically by the flanking sequences. This ordering system is maintained in subsequent rings first by the positions of the mismatches and then by the substitute nucleotide at the mismatch. Thus, all sequences are arranged such that similar sequences appear together and no sequence is repeated. Genomescapes are generated by assigning a CSI intensity to every 10-bp sequence in the genome. The CSI data used to generate the genomescapes for the core polyamides of 2 and 4 were prepared from previously published CSI data (21).
Cell Culture.
H1-hESCs were maintained in E8 media grown on Matrigel-coated plates. H1-hESCs were supplied by WiCell and tested for mycoplasma by standard methods. Cells were passaged with StemPro Accutase (Life Technologies) at ≤90% confluency. Ten micromolar Y27632, an inhibitor of Rho-associated protein kinase, was added for 12 h after passage to promote the survival of dissociated cells. Cellular toxicity was measured with the Cell Counting Kit (CCK-8; Dojindo Molecular Technologies) per the manufacturer’s instructions. Cells were counted with a hemocytometer.
COSMIC.
COSMIC was performed as previously described (31). Each sample was repeated in biological duplicate. Briefly, at 40% confluency, 2.5 × 10⁷ H1-hESCs were treated with varying concentrations of 2 or 4 (20 nM, 400 nM) or 5 or 6 (400 nM) of the molecule (0.1% DMSO final concentration). For 2 and 4, COSMIC-seq was performed with affinity-purified (AP) DNA from the 20 nM treatment. At 24 h after treatment, cells were irradiated at room temperature for 30 min with an UV lamp (2.4 mW/cm2; CalSun) through a Pyrex filter. After irradiation, cells were washed again with PBS and isolated with Accutase per the manufacturer’s directions. The Accutase was quenched with an equal volume of E8 media. The cells were centrifuged at 500 × g and resuspended in COSMIC buffer [20 mM Tris⋅Cl (pH 8.1), 2 mM EDTA, 150 mM NaCl, 1 mM PMSF, 1 mM benzamidine, 1.5 μM pepstatin, 1% Triton X-100, 0.1% SDS]. Samples were sonicated on ice for 36 min with a cycle of 10 s on and 10 s off at 60% amplitude (MiSonix). Samples were centrifuged 10 min at 12,000 × g. Ten percent of the sample was saved as input DNA and stored at −80 °C until reversal of cross-linking. The rest of the sample was used for the affinity purification. Streptavidin-coated magnetic beads (100 μL per sample, Dynabeads MyOne C1) were washed in COSMIC buffer and incubated with samples for 4 h at 4 °C. All washes were performed at room temperature unless otherwise noted. For 2 and 4, 1 and 3 were added (5 μM), respectively, in the washes. Samples were washed twice with COSMIC buffer (once 12 h and once 4 h). Samples were then washed once with washing buffer 1 [10 mM Tris⋅Cl (pH 8.0), 1 mM EDTA, 3% (vol/vol) SDS], once with washing buffer 2 [10 mM Tris⋅Cl (pH 8.0), 250 mM LiCl, 1 mM EDTA, 0.5% Nonidet P-40, 1% sodium deoxycholate], twice with washing buffer 3 [4 M urea, 10 mM Tris⋅Cl (pH 7.5) at 50 °C, 1 mM EDTA, 0.1% Nonidet P-40], and twice with TE [10 mM Tris⋅Cl (pH 8.0), 1 mM EDTA]. Samples were resuspended in TE. These samples are referred to as AP DNA. Input and AP samples were resuspended in cross-link reversal buffer [10 mM Tris (pH 7.6), 0.4 mM EDTA, 100 mM KOH]. Cross-links were reversed, and DNA was eluted from beads at the same time by heating samples for 30 min at 90 °C. Input and AP samples were neutralized with concentrated HCl, and incubated first with RNase A (0.2 µg/µL) for 1 h at 37 °C and then with Proteinase K (0.2 μg/μL) for 1 h at 55 °C. Samples were purified with the Econospin PCR Purification Kit (Epoch Life Sciences).
We note that COSMIC differs from the related approach termed chemical affinity capture and massively parallel DNA sequencing (Chem-seq) (48). Chem-seq focuses on small molecules that bind proteins or protein complexes that, in turn, interact with DNA. Additionally, the formaldehyde used for chemical cross-linking of protein–DNA complexes in Chem-seq and ChIP-seq methods preferentially generates protein–protein cross-links that can result in indirect interactions and so-called “phantom peaks” (42, 65). Finally, it is unclear if formaldehyde leads to covalent conjugation of chemical ligands to their target proteins in live cells; thus, Chem-seq may well reflect noncovalent binding to cell-free protein–DNA complexes and not the actual sites of action of the ligands in live cells. With COSMIC, the focus is primarily on DNA-binding molecules such as polyamides, where the synthetic genome reader delivers the photoreactive cross-linker to DNA to identify direct polyamide–DNA interactions across the genome of a living cell (31).
qPCR.
Samples were analyzed by qPCR (CFX Connect Real-Time PCR system; Bio-Rad). qPCR was performed with SYBR green reagents (iTaq Universal SYBR Green). Chromatin samples were analyzed with PCR parameters as follows: one cycle of 95 °C for 5 min and 40 cycles of 95 °C for 10 s and 55 °C for 30 s. A serial dilution of input DNA was used to determine the fraction of AP DNA compared with input DNA. Primer pairs were designed with Primer3 (66) (Table S1). Data are from at least two independent biological experiments, and error bars represent SEM.
NGS of COSMIC Samples.
Sequencing libraries for input and AP DNA were labeled with a DNA barcode for multiplexing, and prepared for sequencing with the TruSeq ChIP Sample Prep Kit (Illumina, Inc.) per the manufacturer’s directions. Samples were sequenced on an Illumina HiSeq 2500 with a read length of 51 bp. Base pairs were called with Casava v.1.8.2 (Illumina). Reads were demultiplexed with the barcode to yield only the 51-bp genomic fragment.
Bioinformatic Analysis of COSMIC-Seq Data.
Sequencing reads were mapped to the human genome (hg19) with Bowtie v 1.0.0 (best -m 1) to yield unique alignments. Samples were further processed with HOMER to produce a signal track (43). The tag density for each factor was normalized to 107 tags and input DNA, and displayed with the Integrated Genome Viewer v 2.3. Bound regions were identified with SPP v 1.10.1 by the irreproducible discovery rate methodology according to ENCODE guidelines (42, 61). Heat maps of bound regions include all peaks separated by at least 1 kb to limit redundancy. Annotations of peaks were performed with HOMER. Signal traces for metagene analysis were prepared with deepTools (62) from the average of the median signal from biological replicates, centered ±5 kb around bound regions of 2 or 4. All data are deposited in the Gene Expression Omnibus (GEO; accession no. GSE70267). Signal tracks for DMSO and 6 from Anders et al. (48) were downloaded from GEO accession no. GSE44098, and a liftover to hg19 was performed. We also displayed signal tracks produced by ENCODE (unit of measurement: normalized signal) in the Integrated Genome Viewer. A two-tailed Fisher’s exact test with Bonferroni adjustment for multiple testing was used to determine P values. Peaks of transcription factors in H1-hESCs were downloaded from hgdownload.cse.ucsc.edu/goldenpath/hg19/encodeDCC/wgEncodeAwgTfbsUniform/. Peaks of PTMs of histone proteins were also produced by ENCODE and downloaded from hgdownload.cse.ucsc.edu/goldenpath/hg19/encodeDCC/wgEncodeBroadHistone/. Signal tracks for transcription factors and chromatin marks were downloaded from hgdownload.cse.ucsc.edu/goldenpath/hg19/encodeDCC/. ENCODE DNase hypersensitivity peaks and signal tracks in H1-hESCs were from hgdownload.cse.ucsc.edu/goldenpath/hg19/encodeDCC/wgEncodeUwDnase/.
ROC Curves.
To score each peak, we summed the in vitro binding intensities (Z-score) with a moving window across the center of the peak (420 bp) (31)
| [S1] |
where x is the start of the locus (seq), y is the end of the locus, ZPA is the Z-score of the given polyamide for the window i to i + l − 1, and l is the length of the CSI oligo. We used previously published CSI sequence specificity data for the hairpin polyamide 2 and linear polyamide 4 (21). For the ROC curve, COSMIC peaks were taken as positive. Loci of equal length ±5 kb from the center of the COSMIC peak were taken as negative if they did not overlap with another COSMIC peak.
Loci Predicted to be Bound by 2 and 4.
We divided the genome into nonoverlapping 420-bp fragments. We scored each fragment for predicted binding by 2 and 4 according to the summation method, as described in the previous section. Loci with no reads from the input control sample mapping across the 420-bp stretch around a given locus were omitted from the analysis. Loci within 1 kb of each other were also filtered to avoid displaying the same locus multiple times on the heat map. The loci were sorted by predicted binding. This order was used to plot the COSMIC signal for the top 1,000 predicted loci as heat maps in Cistrome (67) with the following parameters: saturation = 0.01, upstream = 5,000, downstream = 5,000, step 10. As a control, we also scored the genome with the top cognate score based on the in vitro CSI-binding intensity (Z-score). We binned the genome into 420-bp bins and scanned each of these loci with a 10-bp sliding window. Each locus was assigned with the maximum intensity (CSI Z-score) found within that locus.
ChromHMM Analysis.
ChromHMM states with the same biological interpretation (e.g., strong enhancers) were grouped together to comprise 12 distinct chromatin states (49). We determined the fraction of peaks located in each of the 12 ChromHMM chromatin states with bedops v 1.2.5. The same procedure was used for the top 1,000 predicted targets of 2 and 4, peaks of transcription factors in H1-hESCs, produced by ENCODE and downloaded from hgdownload.cse.ucsc.edu/goldenpath/hg19/encodeDCC/wgEncodeAwgTfbsUniform/. Peaks of PTMs of histone proteins were also produced by ENCODE and downloaded from hgdownload.cse.ucsc.edu/goldenpath/hg19/encodeDCC/wgEncodeBroadHistone/.
Supplementary Material
Acknowledgments
We thank Jennifer Bolin for preparation of Illumina libraries. We thank Asuka Eguchi for help with cell culture, Dr. Zbigniew Skrzypczynski for advice on synthesis, and Laura Vanderploeg for help with figures. This work was supported by NIH Grants CA133508 (to A.Z.A.) and HL099773 (to A.Z.A. and J.A.T.), the H. I. Romnes faculty fellowship (to A.Z.A.), and the W. M. Keck Medical Research Award (to A.Z.A. and P.R.). G.S.E. was supported by NIH Grant T32 GM07215, a Peterson Fellowship, and a Progenitor Cell Biology Consortium Jump Start Award (JS_2014/4_02). J.A.R.M. was supported by a fellowship from NIH Grants HL099773 and T32 HG002760. D.B. was supported by Grant DMR-0832760 (to P.R.) from the National Science Foundation and the W. M. Keck Medical Research Award. M.P.G. was supported by a Hilldale scholarship. K.K. and C.M. were supported by the Khorana Program.
Footnotes
Conflict of interest statement: A.Z.A. is the sole member of VistaMotif, LLC and founder of the nonprofit WINStep Forward.
This article is a PNAS Direct Submission. T.W.M. is a Guest Editor invited by the Editorial Board.
Data deposition: The data reported in this paper have been deposited in the Gene Expression Omnibus (GEO) database, www.ncbi.nlm.nih.gov/geo (accession no. GSE70267).
This article contains supporting information online at www.pnas.org/lookup/suppl/doi:10.1073/pnas.1604847113/-/DCSupplemental.
References
- 1.Wang D, Lippard SJ. Cellular processing of platinum anticancer drugs. Nat Rev Drug Discov. 2005;4(4):307–320. doi: 10.1038/nrd1691. [DOI] [PubMed] [Google Scholar]
- 2.Hurley LH. DNA and its associated processes as targets for cancer therapy. Nat Rev Cancer. 2002;2(3):188–200. doi: 10.1038/nrc749. [DOI] [PubMed] [Google Scholar]
- 3.Rodriguez R, Miller KM. Unravelling the genomic targets of small molecules using high-throughput sequencing. Nat Rev Genet. 2014;15(12):783–796. doi: 10.1038/nrg3796. [DOI] [PubMed] [Google Scholar]
- 4.Dervan PB. Molecular recognition of DNA by small molecules. Bioorg Med Chem. 2001;9(9):2215–2235. doi: 10.1016/s0968-0896(01)00262-0. [DOI] [PubMed] [Google Scholar]
- 5.Dickinson LA, et al. Inhibition of Ets-1 DNA binding and ternary complex formation between Ets-1, NF-kappaB, and DNA by a designed DNA-binding ligand. J Biol Chem. 1999;274(18):12765–12773. doi: 10.1074/jbc.274.18.12765. [DOI] [PubMed] [Google Scholar]
- 6.Edwards TG, et al. HPV episome levels are potently decreased by pyrrole-imidazole polyamides. Antiviral Res. 2011;91(2):177–186. doi: 10.1016/j.antiviral.2011.05.014. [DOI] [PMC free article] [PubMed] [Google Scholar]
- 7.Edwards TG, Vidmar TJ, Koeller K, Bashkin JK, Fisher C. DNA damage repair genes controlling human papillomavirus (HPV) episome levels under conditions of stability and extreme instability. PLoS One. 2013;8(10):e75406. doi: 10.1371/journal.pone.0075406. [DOI] [PMC free article] [PubMed] [Google Scholar]
- 8.Burnett R, et al. DNA sequence-specific polyamides alleviate transcription inhibition associated with long GAA.TTC repeats in Friedreich’s ataxia. Proc Natl Acad Sci USA. 2006;103(31):11497–11502. doi: 10.1073/pnas.0604939103. [DOI] [PMC free article] [PubMed] [Google Scholar]
- 9.Pandian GN, et al. A synthetic small molecule for rapid induction of multiple pluripotency genes in mouse embryonic fibroblasts. Sci Rep. 2012;2:544. doi: 10.1038/srep00544. [DOI] [PMC free article] [PubMed] [Google Scholar]
- 10.Dickinson LA, et al. Arresting cancer proliferation by small-molecule gene regulation. Chem Biol. 2004;11(11):1583–1594. doi: 10.1016/j.chembiol.2004.09.004. [DOI] [PubMed] [Google Scholar]
- 11.Yang F, et al. Antitumor activity of a pyrrole-imidazole polyamide. Proc Natl Acad Sci USA. 2013;110(5):1863–1868. doi: 10.1073/pnas.1222035110. [DOI] [PMC free article] [PubMed] [Google Scholar]
- 12.Hiraoka K, et al. Inhibition of KRAS codon 12 mutants using a novel DNA-alkylating pyrrole-imidazole polyamide conjugate. Nat Commun. 2015;6:6706. doi: 10.1038/ncomms7706. [DOI] [PubMed] [Google Scholar]
- 13.Gottesfeld JM, Neely L, Trauger JW, Baird EE, Dervan PB. Regulation of gene expression by small molecules. Nature. 1997;387(6629):202–205. doi: 10.1038/387202a0. [DOI] [PubMed] [Google Scholar]
- 14.Mapp AK, Ansari AZ, Ptashne M, Dervan PB. Activation of gene expression by small molecule transcription factors. Proc Natl Acad Sci USA. 2000;97(8):3930–3935. doi: 10.1073/pnas.97.8.3930. [DOI] [PMC free article] [PubMed] [Google Scholar]
- 15.Ansari AZ, Mapp AK, Nguyen DH, Dervan PB, Ptashne M. Towards a minimal motif for artificial transcriptional activators. Chem Biol. 2001;8(6):583–592. doi: 10.1016/s1074-5521(01)00037-0. [DOI] [PubMed] [Google Scholar]
- 16.Arora PS, Ansari AZ, Best TP, Ptashne M, Dervan PB. Design of artificial transcriptional activators with rigid poly-L-proline linkers. J Am Chem Soc. 2002;124(44):13067–13071. doi: 10.1021/ja0208355. [DOI] [PubMed] [Google Scholar]
- 17.Arndt H-D, et al. Toward artificial developmental regulators. J Am Chem Soc. 2003;125(44):13322–13323. doi: 10.1021/ja0371395. [DOI] [PubMed] [Google Scholar]
- 18.Xiao X, Yu P, Lim H-S, Sikder D, Kodadek T. A cell-permeable synthetic transcription factor mimic. Angew Chem Int Ed Engl. 2007;46(16):2865–2868. doi: 10.1002/anie.200604485. [DOI] [PubMed] [Google Scholar]
- 19.Janssen S, Cuvier O, Müller M, Laemmli UK. Specific gain- and loss-of-function phenotypes induced by satellite-specific DNA-binding drugs fed to Drosophila melanogaster. Mol Cell. 2000;6(5):1013–1024. doi: 10.1016/s1097-2765(00)00100-3. [DOI] [PubMed] [Google Scholar]
- 20.Warren CL, et al. Defining the sequence-recognition profile of DNA-binding molecules. Proc Natl Acad Sci USA. 2006;103(4):867–872. doi: 10.1073/pnas.0509843102. [DOI] [PMC free article] [PubMed] [Google Scholar]
- 21.Carlson CD, et al. Specificity landscapes of DNA binding molecules elucidate biological function. Proc Natl Acad Sci USA. 2010;107(10):4544–4549. doi: 10.1073/pnas.0914023107. [DOI] [PMC free article] [PubMed] [Google Scholar]
- 22.Tietjen JR, Donato LJ, Bhimisaria D, Ansari AZ. Sequence-specificity and energy landscapes of DNA-binding molecules. Methods Enzymol. 2011;497:3–30. doi: 10.1016/B978-0-12-385075-1.00001-9. [DOI] [PubMed] [Google Scholar]
- 23.Puckett JW, et al. Quantitative microarray profiling of DNA-binding molecules. J Am Chem Soc. 2007;129(40):12310–12319. doi: 10.1021/ja0744899. [DOI] [PMC free article] [PubMed] [Google Scholar]
- 24.He G, et al. Binding studies of a large antiviral polyamide to a natural HPV sequence. Biochimie. 2014;102(0):83–91. doi: 10.1016/j.biochi.2014.02.011. [DOI] [PMC free article] [PubMed] [Google Scholar]
- 25.Meier JL, Yu AS, Korf I, Segal DJ, Dervan PB. Guiding the design of synthetic DNA-binding molecules with massively parallel sequencing. J Am Chem Soc. 2012;134(42):17814–17822. doi: 10.1021/ja308888c. [DOI] [PMC free article] [PubMed] [Google Scholar]
- 26.Eguchi A, Lee GO, Wan F, Erwin GS, Ansari AZ. Controlling gene networks and cell fate with precision-targeted DNA-binding proteins and small-molecule-based genome readers. Biochem J. 2014;462(3):397–413. doi: 10.1042/BJ20140400. [DOI] [PMC free article] [PubMed] [Google Scholar]
- 27.Wu X, et al. Genome-wide binding of the CRISPR endonuclease Cas9 in mammalian cells. Nat Biotechnol. 2014;32(7):670–676. doi: 10.1038/nbt.2889. [DOI] [PMC free article] [PubMed] [Google Scholar]
- 28.Suto RK, et al. Crystal structures of nucleosome core particles in complex with minor groove DNA-binding ligands. J Mol Biol. 2003;326(2):371–380. doi: 10.1016/s0022-2836(02)01407-9. [DOI] [PubMed] [Google Scholar]
- 29.Gottesfeld JM, et al. Sequence-specific recognition of DNA in the nucleosome by pyrrole-imidazole polyamides. J Mol Biol. 2001;309(3):615–629. doi: 10.1006/jmbi.2001.4694. [DOI] [PubMed] [Google Scholar]
- 30.Jespersen C, et al. Chromatin structure determines accessibility of a hairpin polyamide-chlorambucil conjugate at histone H4 genes in pancreatic cancer cells. Bioorg Med Chem Lett. 2012;22(12):4068–4071. doi: 10.1016/j.bmcl.2012.04.090. [DOI] [PMC free article] [PubMed] [Google Scholar]
- 31.Erwin GS, Bhimsaria D, Eguchi A, Ansari AZ. Mapping polyamide-DNA interactions in human cells reveals a new design strategy for effective targeting of genomic sites. Angew Chem Int Ed Engl. 2014;53(38):10124–10128. doi: 10.1002/anie.201405497. [DOI] [PMC free article] [PubMed] [Google Scholar]
- 32.ENCODE Project Consortium An integrated encyclopedia of DNA elements in the human genome. Nature. 2012;489(7414):57–74. doi: 10.1038/nature11247. [DOI] [PMC free article] [PubMed] [Google Scholar]
- 33.Baird EE, Dervan PB. Solid phase synthesis of polyamides containing imidazole and pyrrole amino acids. J Am Chem Soc. 1996;118(26):6141–6146. [Google Scholar]
- 34.Viger A, Dervan PB. Exploring the limits of benzimidazole DNA-binding oligomers for the hypoxia inducible factor (HIF) site. Bioorg Med Chem. 2006;14(24):8539–8549. doi: 10.1016/j.bmc.2006.08.028. [DOI] [PubMed] [Google Scholar]
- 35.Olenyuk BZ, et al. Inhibition of vascular endothelial growth factor with a sequence-specific hypoxia response element antagonist. Proc Natl Acad Sci USA. 2004;101(48):16768–16773. doi: 10.1073/pnas.0407617101. [DOI] [PMC free article] [PubMed] [Google Scholar]
- 36.Szablowski JO, Raskatov JA, Dervan PB. An HRE-binding Py-Im polyamide impairs hypoxic signaling in tumors. Mol Cancer Ther. 2016;15(4):608–617. doi: 10.1158/1535-7163.MCT-15-0719. [DOI] [PMC free article] [PubMed] [Google Scholar]
- 37.Hyde JE, Hearst JE. Binding of psoralen derivatives to DNA and chromatin: Influence of the ionic environment on dark binding and photoreactivity. Biochemistry. 1978;17(7):1251–1257. doi: 10.1021/bi00600a019. [DOI] [PubMed] [Google Scholar]
- 38.Zhao Y, Granas D, Stormo GD. Inferring binding energies from selected binding sites. PLOS Comput Biol. 2009;5(12):e1000590. doi: 10.1371/journal.pcbi.1000590. [DOI] [PMC free article] [PubMed] [Google Scholar]
- 39.Jolma A, et al. Multiplexed massively parallel SELEX for characterization of human transcription factor binding specificities. Genome Res. 2010;20(6):861–873. doi: 10.1101/gr.100552.109. [DOI] [PMC free article] [PubMed] [Google Scholar]
- 40.Schneider TD, Stephens RM. Sequence logos: A new way to display consensus sequences. Nucleic Acids Res. 1990;18(20):6097–6100. doi: 10.1093/nar/18.20.6097. [DOI] [PMC free article] [PubMed] [Google Scholar]
- 41.Anandhakumar C, et al. Next-generation sequencing studies guide the design of pyrrole-imidazole polyamides with improved binding specificity by the addition of β-alanine. Chembiochem. 2014;15(18):2647–2651. doi: 10.1002/cbic.201402497. [DOI] [PubMed] [Google Scholar]
- 42.Landt SG, et al. ChIP-seq guidelines and practices of the ENCODE and modENCODE consortia. Genome Res. 2012;22(9):1813–1831. doi: 10.1101/gr.136184.111. [DOI] [PMC free article] [PubMed] [Google Scholar]
- 43.Heinz S, et al. Simple combinations of lineage-determining transcription factors prime cis-regulatory elements required for macrophage and B cell identities. Mol Cell. 2010;38(4):576–589. doi: 10.1016/j.molcel.2010.05.004. [DOI] [PMC free article] [PubMed] [Google Scholar]
- 44.Pique-Regi R, et al. Accurate inference of transcription factor binding from DNA sequence and chromatin accessibility data. Genome Res. 2011;21(3):447–455. doi: 10.1101/gr.112623.110. [DOI] [PMC free article] [PubMed] [Google Scholar]
- 45.Jolma A, et al. DNA-binding specificities of human transcription factors. Cell. 2013;152(1-2):327–339. doi: 10.1016/j.cell.2012.12.009. [DOI] [PubMed] [Google Scholar]
- 46.Crocker J, et al. Low affinity binding site clusters confer hox specificity and regulatory robustness. Cell. 2015;160(1-2):191–203. doi: 10.1016/j.cell.2014.11.041. [DOI] [PMC free article] [PubMed] [Google Scholar]
- 47.Alipanahi B, Delong A, Weirauch MT, Frey BJ. Predicting the sequence specificities of DNA- and RNA-binding proteins by deep learning. Nat Biotechnol. 2015;33(8):831–838. doi: 10.1038/nbt.3300. [DOI] [PubMed] [Google Scholar]
- 48.Anders L, et al. Genome-wide localization of small molecules. Nat Biotechnol. 2014;32(1):92–96. doi: 10.1038/nbt.2776. [DOI] [PMC free article] [PubMed] [Google Scholar]
- 49.Ernst J, Kellis M. ChromHMM: Automating chromatin-state discovery and characterization. Nat Methods. 2012;9(3):215–216. doi: 10.1038/nmeth.1906. [DOI] [PMC free article] [PubMed] [Google Scholar]
- 50.Kasowski M, et al. Extensive variation in chromatin states across humans. Science. 2013;342(6159):750–752. doi: 10.1126/science.1242510. [DOI] [PMC free article] [PubMed] [Google Scholar]
- 51.Ptashne M, Gann A. Genes and Signals. Cold Spring Harbor Press; Cold Spring Harbor, NY: 2002. [Google Scholar]
- 52.Kim S, et al. Probing allostery through DNA. Science. 2013;339(6121):816–819. doi: 10.1126/science.1229223. [DOI] [PMC free article] [PubMed] [Google Scholar]
- 53.Moretti R, et al. Targeted chemical wedges reveal the role of allosteric DNA modulation in protein-DNA assembly. ACS Chem Biol. 2008;3(4):220–229. doi: 10.1021/cb700258r. [DOI] [PMC free article] [PubMed] [Google Scholar]
- 54.Meshorer E, Misteli T. Chromatin in pluripotent embryonic stem cells and differentiation. Nat Rev Mol Cell Biol. 2006;7(7):540–546. doi: 10.1038/nrm1938. [DOI] [PubMed] [Google Scholar]
- 55.Chandran A, et al. Deciphering the genomic targets of alkylating polyamide conjugates using high-throughput sequencing. Nucleic Acids Res. 2016;44(9):4014–4024. doi: 10.1093/nar/gkw283. [DOI] [PMC free article] [PubMed] [Google Scholar]
- 56.Becker MM, Grossmann G. 5′ Photofootprinting DNA in vitro and in vivo. In: Revzin A, editor. Footprinting of Nucleic Acid-Protein Complexes. Academic; Boston: 1993. pp. 129–160. [Google Scholar]
- 57.Chenoweth DM, Dervan PB. Allosteric modulation of DNA by small molecules. Proc Natl Acad Sci USA. 2009;106(32):13175–13179. doi: 10.1073/pnas.0906532106. [DOI] [PMC free article] [PubMed] [Google Scholar]
- 58.Soufi A, et al. Pioneer transcription factors target partial DNA motifs on nucleosomes to initiate reprogramming. Cell. 2015;161(3):555–568. doi: 10.1016/j.cell.2015.03.017. [DOI] [PMC free article] [PubMed] [Google Scholar]
- 59.Slattery M, et al. Cofactor binding evokes latent differences in DNA binding specificity between Hox proteins. Cell. 2011;147(6):1270–1282. doi: 10.1016/j.cell.2011.10.053. [DOI] [PMC free article] [PubMed] [Google Scholar]
- 60.Ansari AZ, Peterson-Kaufman KJ. A partner evokes latent differences between Hox proteins. Cell. 2011;147(6):1220–1221. doi: 10.1016/j.cell.2011.11.046. [DOI] [PubMed] [Google Scholar]
- 61.Li Q, Brown JB, Huang H, Bickel PJ. Measuring reproducibility of high-throughput experiments. Ann Appl Stat. 2011;5(3):1752–1779. [Google Scholar]
- 62.Ramírez F, Dündar F, Diehl S, Grüning BA, Manke T. deepTools: A flexible platform for exploring deep-sequencing data. Nucleic Acids Res. 2014;42(Web Server issue) W1:W187–W191. doi: 10.1093/nar/gku365. [DOI] [PMC free article] [PubMed] [Google Scholar]
- 63.Hauschild KE, Stover JS, Boger DL, Ansari AZ. CSI-FID: High throughput label-free detection of DNA binding molecules. Bioorg Med Chem Lett. 2009;19(14):3779–3782. doi: 10.1016/j.bmcl.2009.04.097. [DOI] [PMC free article] [PubMed] [Google Scholar]
- 64.Chen G, et al. Chemically defined conditions for human iPSC derivation and culture. Nat Methods. 2011;8(5):424–429. doi: 10.1038/nmeth.1593. [DOI] [PMC free article] [PubMed] [Google Scholar]
- 65.Jackson V. Formaldehyde cross-linking for studying nucleosomal dynamics. Methods. 1999;17(2):125–139. doi: 10.1006/meth.1998.0724. [DOI] [PubMed] [Google Scholar]
- 66.Rozen S, Skaletsky H. Primer3 on the WWW for general users and for biologist programmers. Methods Mol Biol. 2000;132:365–386. doi: 10.1385/1-59259-192-2:365. [DOI] [PubMed] [Google Scholar]
- 67.Liu T, et al. Cistrome: An integrative platform for transcriptional regulation studies. Genome Biol. 2011;12(8):R83. doi: 10.1186/gb-2011-12-8-r83. [DOI] [PMC free article] [PubMed] [Google Scholar]
Associated Data
This section collects any data citations, data availability statements, or supplementary materials included in this article.


