Abstract
Objectives
Introduction of hybrid techniques, such as transapical transcatheter aortic valve replacement (TA-TAVR), requires skills that a heart team must master to achieve technical efficiency: the technical performance learning curve. To date, the learning curve for TA-TAVR remains unknown. We therefore evaluated the rate at which technical performance improved, assessed change in occurrence of adverse events in relation to technical performance, and determined whether adverse events after TA-TAVR were linked to acquiring technical performance efficiency (the learning curve).
Methods
From April 2007 to February 2012, 1100 patients, average age 85.0 ± 6.4 years, underwent TA-TAVR in the PARTNER-I trial. Learning curves were defined by institution-specific patient sequence number using nonlinear mixed modeling.
Results
Mean procedure time decreased from 131 to 116 minutes within 30 cases (P = .06) and device success increased to 90% by case 45 (P = .0007). Within 30 days, 354 patients experienced a major adverse event (stroke in 29, death in 96), with possibly decreased complications over time (P ~ 08). Although longer procedure time was associated with more adverse events (P<.0001), these events were associated with change in patient risk profile, not the technical performance learning curve (P = .8).
Conclusions
The learning curve for TA-TAVR was 30 to 45 procedures performed, and technical efficiency was achieved without compromising patient safety. Although fewer patients are now undergoing TAVR via nontransfemoral access, understanding TA-TAVR learning curves and their relationship with outcomes is important as the field moves toward next-generation devices, such as those to replace the mitral valve, delivered via the left ventricular apex.
Keywords: transapical transcatheter aortic valve replacement, learning curve, technical performance, success, safety
Graphical abstract
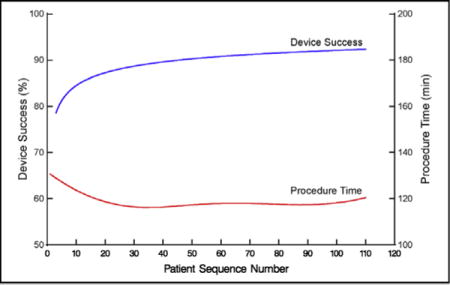
Transcatheter aortic valve replacement (TAVR) has revolutionized treatment of patients with severe senile calcific aortic valve stenosis. As with introduction of any complex procedure, particularly one requiring a team approach, a set of skills must be mastered to achieve technical competence: the learning curve.1,2 To date, the time necessary to traverse this learning phase for transapical (TA) TAVR remains unknown, and it is uncertain whether this learning curve compromises successful valve replacement and patient safety.
International TAVR trials have been designed to mandate a “transfemoral (TF) first” access strategy, with alternative access, such as the TA approach, reserved for patients with severe peripheral vasculopathy.3,4 Because clinical risk factors associated with peripheral vascular disease may preclude TF access, understanding learning curves associated with TA-TAVR is necessary to ensure this procedure is performed successfully and safely. In this study, we sought to answer the following questions: (1) Was there a technical performance learning curve for TA-TAVR in the Placement of Aortic Transcatheter Valves (PARTNER) I trial? (2) Were there associated consequences during this period, such as occurrence of adverse events early after TA-TAVR? (3) Did the technical performance learning curve compromise successful valve replacement and patient safety?
METHODS
Patients
From April 2007 to February 2012, 1100 patients from 24 PARTNER-I trial institutions underwent TA-TAVR. Average age was 85.0 ± 6.4 years and mean transaortic gradient was 44 mm Hg, with a mean aortic valve area of 0.64 cm2, consistent with severe senile calcific aortic stenosis. Nearly all patients had peripheral vascular disease (98%), hypertension (96%), and hyperlipidemia (87%), and 51% had undergone previous coronary artery bypass grafting and 46% previous percutaneous coronary intervention; 43% had cerebral vascular disease, 45% chronic pulmonary disease, and 36% diabetes (Table E1). Median number of cases performed per institution was 48, with 2 the lowest and 112 the highest (Figure E1). Because prevalence of TA-TAVR steadily increased during the PARTNER-I trial (Figure E2) and the interval between TA-TAVR cases decreased at nearly all institutions, that is, institution volume increased (Figure E3), we included all as-treated TA-TAVR patients who were part of both randomized and nonrandomized cohorts (Table E2).
Study Device and Procedure
The Edwards SAPIEN transcatheter heart valve system (Edwards Lifesciences, Irvine, Calif) used in the PARTNER-I trial consisted of a trileaflet bovine pericardial valve (model 9000TFX) and a balloon-expandable, stainless steel support frame. Technical details of TA-TAVR have been previously described.5 The procedures themselves were performed by the institution’s own team. An experienced industry technical representative was also in attendance for each case, along with qualified interventional cardiologists. Cardiac surgery proctors observed, on average, the first 3 procedures.
Study Design
This is an as-treated analysis. Before start of the PARTNER-I trial, 40 patients underwent TA-TAVR with the SAPIEN device at 3 institutions: Columbia University (n = 13), Cleveland Clinic (n = 12), and Baylor Health Care System (n = 15). For purposes of learning curve analyses, sequential numbering of patients for these 3 institutions was adjusted to reflect the number of procedures that had been performed before the PARTNER-I trial; however, patient-level data were unavailable for these 40 patients. To illustrate, 12 patients underwent TA-TAVR at Cleveland Clinic before the trial, so patient sequence number for analysis started at 13.
Data
Data used for this study were from a December 20, 2012, locked data extract provided to the PARTNER Publications Office by Edwards Lifesciences. These data have been approved for use in research by institutional review boards at each institution. All patients provided written informed consent.
Endpoints
Technical performance
Among the many technical performance measures for which learning curves were assessed, we selected those that would illustrate technical efficiency and the influence on the learning curve of accumulating external experience: procedure time, fluoroscopy time, contrast volume used, and number of postdeployment dilatations. Procedure time was the time from surgical incision until incision closure. Influence of external experience on technical performance was assessed by the institution’s date of entry into the trial.
Outcomes
Intra- and postprocedure events assessed included device success, adverse events occurring during the procedure, length of postprocedure hospital stay, and major adverse events occurring within 30 days. All were adjudicated by a clinical events committee and defined as follows:
Device success: Delivery and deployment of the prosthesis and retrieval of the delivery catheter, resulting in an aortic valve area larger than 0.9 cm2, with less than 3+ aortic regurgitation (AR) in the earliest evaluable echocardiogram and only a single valve deployed and implanted in the correct anatomical position. Even if another valve was required that successfully treated, for example, severe paravalvular leak, this was classified as device failure. This definition closely parallels that of the Valve Academic Research Consortium.6
Adverse events during procedure: Intraprocedural events included vascular hemorrhage, bleeding, arrhythmia, hypotension, conduction defects, abnormal laboratory values, and paravalvular leak (Table E3). Definitions of these adverse events followed PARTNER-I trial protocol definitions.7
Length of postprocedure hospital stay: Interval in days between index procedure date and hospital discharge date after the procedure.
Major adverse events occurring within 30 days: A composite endpoint that included adverse events during the procedure, all-cause mortality, stroke, major bleeding, and major vascular complications (Appendix E1).
Data Analysis
Analyses were performed using SAS statistical software (SAS v9.2; SAS, Inc, Cary, NC) and R software version 3.0.2 (http://www.R-project.org).
Learning curves were explored using 3 general strategies, and a fourth special strategy for procedure time (Appendix E2). First, a learning curve profile for all technical and outcomes endpoints was constructed for each institution according to institution-specific patient sequence number. These were summarized for continuous data using locally weighted scatterplot smoothing (loess).8 Second, an overall learning curve profile across all institutions was constructed using mixed-effects modeling to account for correlation of patients within an institution. This methodology permitted us to derive a confidence band around the point estimates and to generate numerical estimates at selected sequence numbers. To obtain tests of statistical significance, this analysis was supplemented by focused modeling of each learning curve variable with patient sequence number. Third, because institutions entered the trial at different times, which confounds date-of-procedure effects, we investigated the effect of entry date of each institution into the PARTNER-I trial on learning curves using a combination of data exploration and estimation of trends according to broad categories of trial entry date.
For procedure time, a more intense modeling approach was used to estimate the number of cases required to reach a steady value. For this, we applied a commonly used hyperbolic model for learning curves that assumes that procedure time would decrease with experience at an institution-specific rate, but eventually would reach an institution-specific average minimum time (mathematically, an asymptote; see Appendix E2). A nonlinear mixed-effects method was used for this. By definition, an asymptote is reached only with an infinite number of cases, so we chose 15 seconds as the difference between successive procedure times to indicate that the curve had become essentially flat. This model permitted us to perform a multivariable analysis that included institution-specific patient sequence number, interval between procedures (an instantaneous measure of the institution’s case volume), and trial entry date.
Association of outcomes learning curves with patient variables and technical performance metrics
We investigated the association of major adverse events occurring within 30 days of TA-TAVR and post-TAVR length of stay with patient variables (Appendix E3) and technical performance metrics (procedure time, fluoroscopy time, contrast volume, pacing count during balloon aortic valvotomy and prosthesis deployment, and number of postdeployment dilatations). Although procedure time demonstrated a clear learning curve, patient factors and events occurring during the procedure may prolong it. Therefore, to explore the possible link between this learning curve and 30-day major adverse events, we decomposed procedure time into 3 components:
Procedure time learning curve: For each patient, we predicted procedure time by a hyperbolic mixed-effects model of patient sequence number as described in Appendix E2. This analysis accounted for institution trial entry date, interval between cases, and patient sequence number.
Patient factors influencing procedure time: For each patient, we predicted procedure time by a linear mixed-effects parsimonious model of patient factors. This analysis accounted for institutional variability as a random effect.
Unmeasured factors prolonging procedure time: The difference between observed procedure time and that accounted for by the technical learning curve and patient factors was assumed to represent patient selection factors, events during the procedure prolonging its duration, and other unmeasured variables.
Three variables representing each of these 3 components were then forced into models of 30-day major adverse events, along with patient variables.
Missing values
We used fivefold multiple imputation for missing values of variables used in multivariable analyses, as described in Appendix E2.9
Presentation
Continuous variables are summarized as mean ± standard deviation or as equivalent 15th, 50th (median), and 85th percentiles when distribution of values is skewed. Categorical variables are summarized by frequencies and percentages. Confidence limits or bands are 68%, which is consistent with 1 standard error of the point estimate, but may be asymmetric.
RESULTS
Technical Performance
Mean procedure time was 120 ± 67 minutes (Table 1), decreasing from 131 to 116 minutes by case 30 (Table E4), and remaining constant at approximately 117 minutes thereafter (Figures 1 and 2, A, Table E4; P = .06). On average, it took 1.7 ± 0.46 years for institutions to perform 30 cases. Institutional values of non–risk-adjusted average minimum (asymptotic) procedure time ranged from 77 to 222 minutes (Figure E4, A). This minimum was reached after 5 to 52 cases, but typically 15 (Figure E4, B). Among the last 5 institutions entering the trial, 9 cases were needed to reach a minimum procedure time (Figure E4, C), although these institutions tended to have a longer asymptotic procedure time than those entering the trial near its beginning (Figure E4, D). The average calendar time it took institutions to reach their asymptote was 14.0 ± 6.9 months. We were unable to demonstrate that higher institutional volume, assessed as lower interval between sequential cases, was associated with procedure time after accounting for sequence number and trial entry date (P = .5).
TABLE 1.
Technical performance and outcomes endpoints after transapical transcatheter aortic valve replacement
| Endpoint | n* | n (%) |
|---|---|---|
| Technical performance | ||
| Procedure time, min | 1092 | 120.0 ± 66.7† |
| Fluoroscopy time, min | 1048 | 13.5 ± 10.5† |
| Contrast medium, mL | 1057 | 45/90/150‡ |
| Postdilatations | 1096 | |
| 0 | 980 (89) | |
| 1 | 103 (9.4) | |
| 2 | 12 (1.1) | |
| 3 | 1 (0.09) | |
| Outcomes | ||
| Device success | 1061 | 930 (88) |
| Aortic regurgitation grade at discharge | ||
| Total | 1021 | |
| None/trace | 587 (57) | |
| Mild | 366 (36) | |
| Moderate | 64 (6.3) | |
| Severe | 4 (0.39) | |
| Transvalvular | 1020 | |
| None/trace | 907 (89) | |
| Mild | 109 (11) | |
| Moderate | 4 (0.39) | |
| Severe | 0 (0) | |
| Paravalvular | 1018 | |
| None/trace | 657 (65) | |
| Mild | 305 (30) | |
| Moderate | 53 (5.2) | |
| Severe | 3 (0.29) | |
| Adverse events during procedure | 1100 | 257 (23) |
| Myocardial perforation | 1100 | 11 (1.0) |
| Ventricular injury | 1100 | 4 (0.36) |
| Adverse events within 30 d | 1100 | |
| Stroke | 29 (2.6) | |
| Mortality | 96 (8.7) | |
| Major bleeding | 97 (8.8) | |
| Major vascular complication | 39 (3.5) | |
| Composite 30-d major adverse event | 1100 | 354 (32) |
| Postprocedure length of stay, d | 1081 | 5/8/15‡ |
Patients with data available.
Mean ± standard deviation.
15th/50th/85th percentiles.
FIGURE 1.
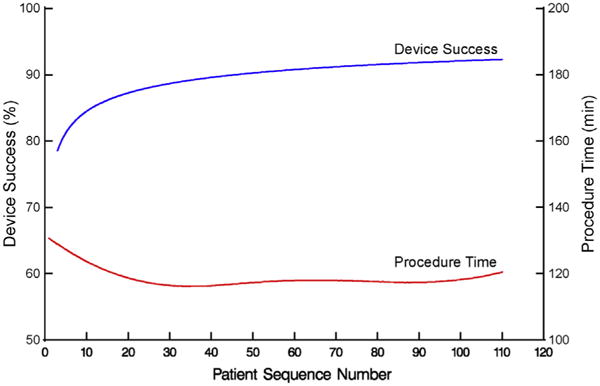
Overall profile of procedure time and device success for transapical transcatheter aortic valve replacement, ordered by institution-specific patient sequence number. Solid red line represents average procedure time adjusted for institution and solid blue line represents average percent of patients who experienced successful device deployment.
FIGURE 2.
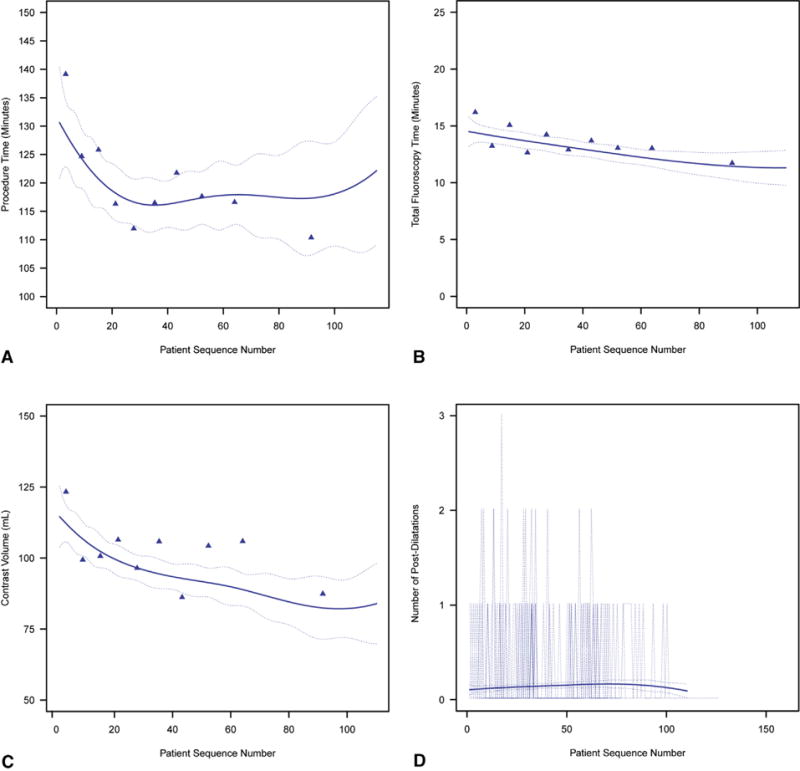
Overall profile of mean technical performance for transapical transcatheter aortic valve replacement, ordered by institution-specific patient sequence number. Solid line represents average profiles adjusted for institution, enclosed within a dashed 68% confidence band equivalent to 1 standard error. For crude verification of model fit, symbols in (A) through (C) are mean responses of data unadjusted for institution grouped into deciles by patient sequence number, and dotted curves in (D) are profiles for each institution. A, Procedure time (minutes). B, Total fluoroscopy time (minutes). C, Contrast volume (mL). D, Number of postdilatations.
Fluoroscopy time averaged 14 ± 10 minutes (Figure 2, B, Table 1) and decreased only slightly from 14 to 12 minutes by case 60 (Table E4; P = .01). Median contrast volume was 90 mL (15th and 85th percentiles 45 and 150 mL), decreasing from 114 to 90 mL by case 60 (Figure 2, C, Table E4; P<.0001). Frequency of postdeployment dilatations remained low (none in 89% of patients) and constant across the experience (Figure 2, D, Table E4; P = .5).
Outcomes
Device success increased from 72% to 80% by 4 cases and to 90% within 45 cases (Figures 1 and 3, Table E4; P = .0007). On average, it took 2.20 ± 0.48 years for institutions to perform 45 cases. Intraprocedural adverse events fell from 31% to 25% by 15 cases, but with wide confidence limits, and remained constant thereafter (Figure 4, A, Table E4; P = .3). Specifically, 15 patients experienced intraprocedural myocardial perforation or ventricular injury (Table 1), with no significant trend over patient sequence number (Figure E5, A, P = .4) or years from institution trial entry date (Figure E5, B, P = .8). Median postprocedure length of hospital stay was 8 days (15th and 85th percentiles 5 and 15 days) and became slightly shorter with increasing experience (Figure 5, Table E4; P = .13); after risk adjustment, postprocedure hospital stay was found to be statistically significantly shorter with increasing sequence number (P = .04).
FIGURE 3.
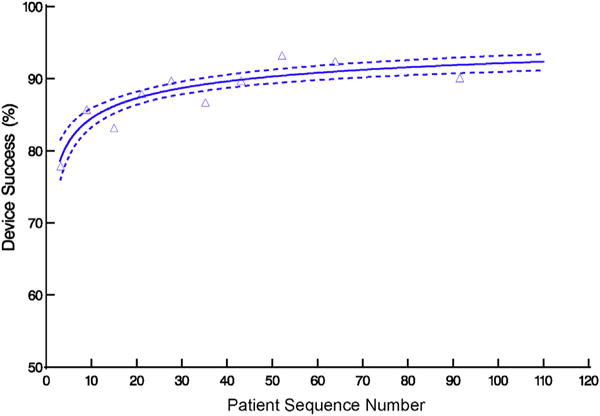
Profile of percentage of patients who experienced successful device deployment during transapical transcatheter aortic valve replacement, ordered by institution-specific patient sequence number. Format is as in Figure 2.
FIGURE 4.
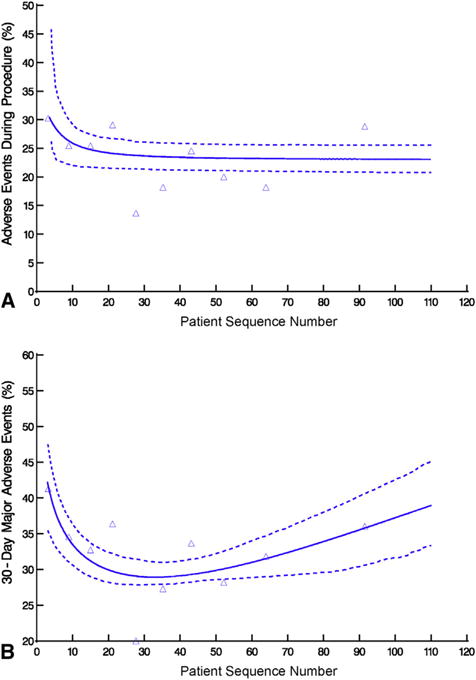
Patients who experienced an adverse event during or after transapical transcatheter aortic valve replacement, ordered by institution-specific patient sequence number. Format is as in Figure 2. A, Adverse events during procedure. B, Major adverse events within 30 days.
FIGURE 5.
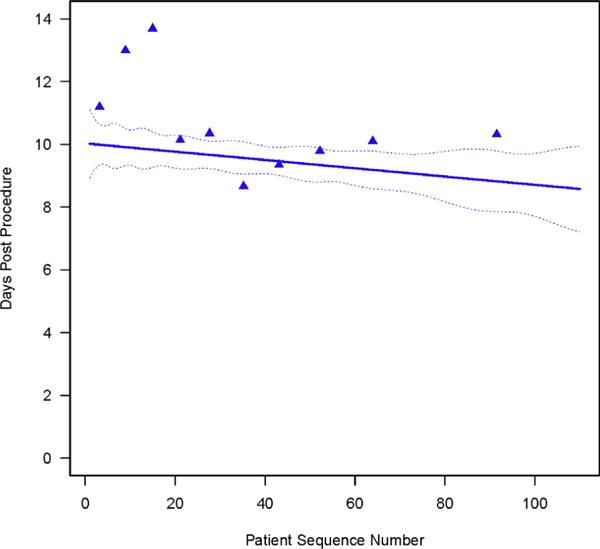
Length of hospital stay after transapical transcatheter aortic valve replacement, ordered by institution-specific patient sequence number. Format is as in Figure 2.
A total of 46% of patients had none/trace paravalvular AR initially, improving to 66% within the first 30 cases, whereas moderate paravalvular AR fell from 11% to 5.1% (Figure 6, Table E4; P = .10). Transvalvular AR was minimal across experience, with 84% of patients having none/trace transvalvular AR and 15% mild initially; prevalence of none/trace transvalvular AR increased to 89% and mild decreased to 10% within 30 cases (Figure E6, A, Table E4; P = .2). Initially, 41% of patients had none/trace total AR, which improved to 58% by case 30, whereas moderate total AR fell from 12% to 6.3% (Figure E6, B, Table E4; P = .13).
FIGURE 6.
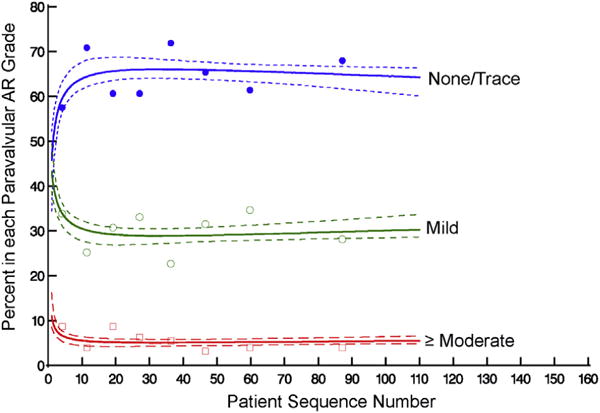
Percentage of patients in each paravalvular aortic regurgitation (AR) grade at discharge, ordered by institution-specific patient sequence number. Format is as in Figure 2.
Within 30 days, 354 patients (32%) experienced at least 1 major adverse event: 29 (2.6%) had a stroke, 97 (8.8%) a major bleeding episode, and 39 (3.5%) a major vascular complication; 96 patients (8.7%) died (Table 1, Figure E7). Occurrence of a composite event (adverse event or death) within 30 days fell from 51% initially to 29% by case 30, then rose slightly to 36% by case 90 (Figure 4, B, Table E4; P = .01).
Influence of Technical Performance on Outcomes
Total procedure time was strongly associated with outcomes, with a nearly linear increase in risk of 30-day major adverse events (Figure 7). The most significant risk factors for 30-day major adverse events were longer procedure time, baseline antiplatelet drug therapy, higher international normalized ratio, and lower hemoglobin, but only possibly patient sequence number (Table E5; P = .09). On further analysis (Table E6), when procedure time was deconstructed into technical performance, patient characteristics, and unknown factors, there was no evidence (P = .8) of an effect of technical performance, as reflected by procedure time, on the composite endpoint; rather, patient profile (P = .05) and unknown variables (P<.0001) were associated, although a possible effect of sequence number persisted (P = .06).
FIGURE 7.
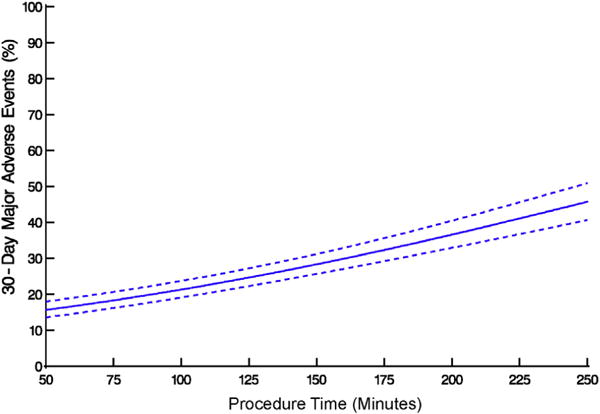
Association between procedure time and major adverse events within 30 days after transapical transcatheter aortic valve replacement. Solid line represents average profiles adjusted for institution, enclosed within a dashed 68% confidence band equivalent to 1 standard error.
DISCUSSION
Principal Findings
Following the introduction of TA-TAVR across PARTNER-I institutions, procedure time, fluoroscopy time, and volume of contrast medium sharply decreased as patient sequence number increased, indicating a short technical performance learning curve from the perspective of number of cases; however, because of a TF-first policy, it took more than a year on average to traverse this learning curve. This trend appeared to be accounted for largely by patient characteristics associated with prolonged procedures. In conjunction, device success increased while intraprocedural complications and postprocedure AR all decreased within the first 30 to 45 cases; again, however, performing 45 cases extended over a 2-year period. The composite endpoint of intraprocedural adverse events, death, stroke, and major bleeding within 30 days initially fell, then slightly rose, perhaps due to changing patient profile and unmeasured variables. Importantly, extended procedure times typically encountered at the beginning of an institution’s experience, and associated with a greater likelihood of adverse events, were found in multivariable analysis not to be an independent risk factor for these adverse events. These findings and those of others10 have important implications for forthcoming novel structural heart devices deployed via the left ventricular apex.
Findings in Context
The concept of a learning curve associated with TA-TAVR is not new. Aguirre and colleagues11 from Cleveland Clinic recently reported on their early experience with TA-TAVR in 150 patients from 2007 to 2013. They divided patients into 2 groups roughly corresponding to early and mature phases, and found that the need for rescue maneuvers decreased with experience. Although 30-day mortality, bleeding from the left ventricular apex, and deployment of more than 1 valve were similar, 1-year survival improved during the more recent era, perhaps reflecting better patient selection. The authors concluded that despite an elderly, high-risk population, increasing experience was associated with decreasing mortality and complications after TA-TAVR, and that TA-TAVR is as safe and effective as TF-TAVR when performed by skilled teams.
Our finding that occurrence of intraprocedural adverse events and 30-day mortality, stroke, and major bleeding initially fell, then slightly rose may have reflected an increased willingness to enroll more complex patients, and evidence supporting this was found in our multivariable analysis. D’Ancona and colleagues12 detailed their similar experience with 500 consecutive high-risk patients undergoing TA-TAVR between 2008 and 2011. They discovered a significant relationship among procedure time, fluoroscopy time, and institutional experience, concluding that a structured training program was necessary to minimize operating room and radiation times, and approximately 100 cases were necessary to traverse the learning curve. They posited that TA-TAVR may be a more difficult procedure than TF-TAVR, but that risk of neurologic complications should be lower due to avoidance of atheromatous debris in the aorta.
In their experience with 299 patients who underwent TA-TAVR between 2006 and 2010, Kempfert and colleagues13 found a low occurrence of stroke and a clear trend toward declining 30-day mortality with increasing experience. They further proposed the existence of a technical learning curve associated with shorter fluoroscopy time, lower contrast dye load, fewer postballoon dilations, and shorter cardiopulmonary bypass time, which translated into shorter procedure times during the second half of their experience. The authors suggested that increased technical facility with wire handling and adjuncts, such as multiple imaging snapshots during stepwise implantation, increased the technical precision of deployment, thereby improving early outcomes.
An important task in assessing learning curves is distinguishing between individual and global experience. In our study of 24 institutions participating in the PARTNER-I trial, we found that institution trial entry date was not significantly associated with adverse outcomes. Importantly, the SAPIEN device itself evolved over time and certain technical efficiencies are likely associated with more sophisticated iterations of both the valve and implantation systems. Enhanced imaging also may be associated with valve deployment accuracy and improved early outcomes.
Clinical Implications
What does this large TA-TAVR experience from the PARTNER-I trial tell us? First, the learning curve for TA-TAVR is relatively short in terms of number of cases; these data demonstrate that approximately 30 to 45 cases were required to attain technical proficiency for TA-TAVR. This may relate to the heart teams’ previous experience with minimally invasive procedures. Avoiding intraprocedural difficulties and complications that increase procedure time may improve early postoperative outcomes. It is unclear whether evolution of the TA-TAVR platform played more of a role than operator proficiency in improving outcomes.
It is uncertain how these TA-TAVR advances relate to contemporaneous, but admittedly different, technical advances in TF-TAVR. TF-TAVR is rapidly becoming the procedure of choice in patients undergoing transcatheter aortic valve therapy, particularly as device and sheath sizes decrease. Svensson and colleagues14 recently reported the causes of death in PARTNER-I cohorts A and B. They found that TF-TAVR was associated with an increased risk of cardiovascular death, whereas in high-risk patients, both TA-TAVR and AVR had higher early noncardiovascular risk. They concluded that TF-TAVR is preferred for inoperable patients at high risk of noncardiovascular mortality. Unlike TF-TAVR, however,15,16 we found little evidence of a technical performance learning curve, and no suggestion that a technical learning curve is associated with adverse outcomes or prolonged postprocedure hospitalization after adjusting for patient factors.
TA-TAVR may benefit certain patients, including those with severe peripheral vascular disease, although other access routes, including transaortic,17,18 are currently being evaluated in ongoing clinical trials. Although, subsequent to PARTNER-I, fewer patients are undergoing TAVR via non-TF access, understanding TA-TAVR learning curves and their effect on outcomes is important as the field moves toward structural devices delivered via the left ventricular apex, such as mitral valve replacement.
Limitations
This is a large study of patients who underwent TA-TAVR with operator teams at 24 institutions. Thus, we were unable to account for variations in team members and whether individual operator experience was more important than a team’s accrued experience. Intraoperative risk factors for prolonged procedure time were not recorded and we cannot account for intangible selection factors that may have been at play during the trial.19,20 Specific techniques developed and used by successful teams could not be ascertained from registry data. Finally, this analysis cannot account for differences in learning that existed before the PARTNER-I trial and does not account for learning from larger TF-TAVR experiences that may affect the contemporary learning curve.
CONCLUSIONS
The learning curve for TA-TAVR was short in terms of number of cases, but long in calendar time due to a TF-first trial preference. Importantly, technical competence was achieved without compromising patient safety. Although fewer patients are undergoing TAVR via non-TF access, understanding TA-TAVR learning curves and their effect on outcomes is important for structural heart teams as they adopt, learn, and master next-generation therapies delivered via the left ventricular apex.
Supplementary Material
VIDEO 1.
Transapical transcatheter aortic valve replacement procedure using an Edwards SAPIEN S3 valve. Video available at http://www.jtcvsonline.org/article/S0022-5223(16)30099-X/addons.
Central Message
The learning curve for TA-TAVR did not compromise patient safety.
Perspective
The learning curve for TA-TAVR was 30 to 45 cases and technical competence was achieved without compromising patient safety. Although fewer patients are undergoing TAVR via non-TF access, understanding TA-TAVR learning curves and their relationship with outcomes is important as the field moves toward next-generation devices delivered via the left ventricular apex.
Acknowledgments
The nonlinear mixed-effects models were developed with support from National Institutes of Health grant 1R01HL103552-01A1, Ancillary Comparative Effectiveness of Atrial Fibrillation Ablation Surgery.
Data used for this study were from a December 20, 2012, locked data extract provided to the PARTNER Publications Office by Edwards Lifesciences. These data have been approved for use in research by institutional review boards at each institution. All patients provided written informed consent. Data analysis was performed by investigators at Cleveland Clinic, with no sponsor involvement in study proposal or design, analyses, interpretation, or the decision to publish.
The authors thank Linda DiPaola at Cleveland Clinic and Steven Xu at Columbia University for statistical programming; Gina Ventre at Cleveland Clinic and Maria Alu at Columbia University for editing, formatting, and preparing this manuscript for submission; and William Niles Anderson and Hung-Ir Li at Edwards Lifesciences for data validation.
Abbreviations and Acronyms
- AR
aortic regurgitation
- PARTNER
Placement of Aortic Transcatheter Valves
- TA
transapical
- TAVR
transcatheter aortic valve replacement
- TF
transfemoral
Footnotes
Clinical Trial Registration: http://clinicaltrials.gov/ct2/show/NCT00530894; NCT00530894.
Conflict of Interest Statement
R.M.S. is a member of the Clinical Steering Committee at Abbott and S.J.M., consults with Sorin and Abbott, has a patent application with Sorin, and does research with Sorin, Edwards Lifesciences, Abbott, and St Jude; A.D.P. is a proctor for Edwards Lifesciences; M.M. is a member of the executive committee for Edward Lifesciences’ PARTNER trial; L.G.S. is on executive committees for Edwards Lifesciences’ PARTNER and COMMENCE trials; V.H.T. consults with Edwards Lifesciences; R.M. has research support from Edwards Lifesciences and St Jude Medical, consults with Abbott Vascular, Cordis, and Medtronic, and has equity in Entourage Medical; E.H.B. is on executive committees for Edwards Lifesciences’ PARTNER and COMMENCE trials and leads the Cleveland Clinic PARTNER Publications Office, which carries out and publishes independent analyses of PARTNER data. All other authors have nothing to disclose with regard to commercial support.
Scanning this QR code will take you to the appendices, supplemental figures, tables, and video for this article.

References
- 1.Gurvitch R, Tay EL, Wijesinghe N, Ye J, Nietlispach F, Wood DA, et al. Transcatheter aortic valve implantation: lessons from the learning curve of the first 270 high-risk patients. Catheter Cardiovasc Interv. 2011;78:977–84. doi: 10.1002/ccd.22961. [DOI] [PubMed] [Google Scholar]
- 2.Alli OO, Booker JD, Lennon RJ, Greason KL, Rihal CS, Holmes DR., Jr Transcatheter aortic valve implantation: assessing the learning curve. JACC Cardiovasc Interv. 2012;5:72–9. doi: 10.1016/j.jcin.2011.09.014. [DOI] [PubMed] [Google Scholar]
- 3.Lefevre T, Kappetein AP, Wolner E, Nataf P, Thomas M, Schachinger V, et al. One year follow-up of the multi-centre European PARTNER transcatheter heart valve study. Eur Heart J. 2011;32:148–57. doi: 10.1093/eurheartj/ehq427. [DOI] [PMC free article] [PubMed] [Google Scholar]
- 4.Smith CR, Leon MB, Mack MJ, Miller DC, Moses JW, Svensson LG, et al. Transcatheter versus surgical aortic-valve replacement in high-risk patients. N Engl J Med. 2011;364:2187–98. doi: 10.1056/NEJMoa1103510. [DOI] [PubMed] [Google Scholar]
- 5.Walther T, Simon P, Dewey T, Wimmer-Greinecker G, Falk V, Kasimir MT, et al. Transapical minimally invasive aortic valve implantation: multicenter experience. Circulation. 2007;116:I240–5. doi: 10.1161/CIRCULATIONAHA.106.677237. [DOI] [PubMed] [Google Scholar]
- 6.Leon MB, Piazza N, Nikolsky E, Blackstone EH, Cutlip DE, Kappetein AP, et al. Standardized endpoint definitions for transcatheter aortic valve implantation clinical trials: a consensus report from the Valve Academic Research Consortium. J Am Coll Cardiol. 2011;57:253–69. doi: 10.1016/j.jacc.2010.12.005. [DOI] [PubMed] [Google Scholar]
- 7.The PARTNER Trial: Placement of AoRTic TraNscathetER Valves, Version 2.0. Irvine, CA: Edwards Lifesciences; 2008. [Google Scholar]
- 8.Cleveland WS, Devlin SJ. Locally weighted regression: an approach to regression analysis by local fitting. J Am Stat Assoc. 1988;83:596–610. [Google Scholar]
- 9.Rubin DB. Multiple Imputation for Non-response in Surveys. New York: Wiley; 1987. [Google Scholar]
- 10.von Segesser LK, Gerosa G, Borger MA, Ferrari E. Prevention and management of potential adverse events during transapical aortic valve replacement. J Heart Valve Dis. 2013;22:276–86. [PubMed] [Google Scholar]
- 11.Aguirre J, Waskowski R, Poddar K, Kapadia S, Krishnaswamy A, McCullough R, et al. Transcatheter aortic valve replacement: experience with the transapical approach, alternate access sites, and concomitant cardiac repairs. J Thorac Cardiovasc Surg. 2014;148:1417–22. doi: 10.1016/j.jtcvs.2014.05.019. [DOI] [PubMed] [Google Scholar]
- 12.D’Ancona G, Pasic M, Unbehaun A, Dreysse S, Drews T, Buz S, et al. Transapical aortic valve implantation: learning curve with reduced operating time and radiation exposure. Ann Thorac Surg. 2014;97:43–7. doi: 10.1016/j.athoracsur.2013.07.070. [DOI] [PubMed] [Google Scholar]
- 13.Kempfert J, Rastan A, Holzhey D, Linke A, Schuler G, van Linden A, et al. Transapical aortic valve implantation: analysis of risk factors and learning experience in 299 patients. Circulation. 2011;124:S124–9. doi: 10.1161/CIRCULATIONAHA.110.013425. [DOI] [PubMed] [Google Scholar]
- 14.Svensson LG, Blackstone EH, Rajeswaran J, Brozzi N, Leon MB, Smith CR, et al. Comprehensive analysis of mortality among patients undergoing TAVR: results of the PARTNER trial. J Am Coll Cardiol. 2014;64:158–68. doi: 10.1016/j.jacc.2013.08.1666. [DOI] [PubMed] [Google Scholar]
- 15.Alli O, Rihal CS, Suri RM, Greason KL, Waksman R, Minha S, et al. Learning curves for transfemoral transcatheter aortic valve replacement in the PARTNER-I trial: technical performance. Catheter Cardiovasc Interv. 2015 Aug 10; doi: 10.1002/ccd.26120. [Epub ahead of print] [DOI] [PubMed] [Google Scholar]
- 16.Minha S, Waksman R, Satler LP, Torguson R, Alli O, Rihal CS, et al. Learning curves for transfemoral transcatheter aortic valve replacement in the PARTNER-I Trial: Success and safety. Circ Cardiovasc Interv. 2015 Oct 1; doi: 10.1002/ccd.26121. [Epub ahead of print] [DOI] [PubMed] [Google Scholar]
- 17.Al Kindi AH, Salhab KF, Roselli EE, Kapadia S, Tuzcu EM, Svensson LG. Alternative access options for transcatheter aortic valve replacement in patients with no conventional access and chest pathology. J Thorac Cardiovasc Surg. 2014;147:644–51. doi: 10.1016/j.jtcvs.2013.02.014. [DOI] [PubMed] [Google Scholar]
- 18.Okuyama K, Jilaihawi H, Mirocha J, Nakamura M, Ramzy D, Makkar R, et al. Alternative access for balloon-expandable transcatheter aortic valve replacement: comparison of the transaortic approach using right anterior thoracotomy to partial J-sternotomy. J Thorac Cardiovasc Surg. 2015;149:789–97. doi: 10.1016/j.jtcvs.2014.10.062. [DOI] [PubMed] [Google Scholar]
- 19.Tice JA, Sellke FW, Schaff HV. Transcatheter aortic valve replacement in patients with severe aortic stenosis who are at high risk for surgical complications: summary assessment of the California Technology Assessment Forum. J Thorac Cardiovasc Surg. 2014;148:482–91.e6. doi: 10.1016/j.jtcvs.2013.09.056. [DOI] [PubMed] [Google Scholar]
- 20.Sepehri A, Beggs T, Hassan A, Rigatto C, Shaw-Daigle C, Tangri N, et al. The impact of frailty on outcomes after cardiac surgery: a systematic review. J Thorac Cardiovasc Surg. 2014;148:3110–7. doi: 10.1016/j.jtcvs.2014.07.087. [DOI] [PubMed] [Google Scholar]
Associated Data
This section collects any data citations, data availability statements, or supplementary materials included in this article.


