

Abstract
Objective
To test whether protein anabolic resistance is an early defect in type 2 diabetes (T2D).
Research design and methods
Seven lean, normoglycemic T2D offspring (T2D-O) and eight matched participants without family history (controls; C) underwent a 3-hour hyperinsulinemic (40 mU/m2/min), euglycemic (5.5 mmol/L) and isoaminoacidemic clamp. Whole-body glucose and protein kinetics were measured with d-[3–3H]glucose and l-[l-13C]leucine, respectively. Plasma amino acids were measured by liquid chromatography-tandem mass spectrometry.
Results
Fasting glycemia and glucose kinetic variables did not differ between groups. Clamp decreases in glucose rate of appearance were not different, but rate of disappearance increased 29% less in T2D-O, to a significantly lower rate. Fasting leucine was higher in T2D-O, but kinetics did not differ. Clamp increases in leucine oxidation and decreases in endogenous rate of appearance (protein breakdown) were equal, but in T2D-O, non-oxidative rate of disappearance (protein synthesis) did not increase and net balance (synthesis—breakdown) did not become positive as in C.
Conclusions
Resistance of whole-body protein anabolism (synthesis and net balance) accompanies resistance of glucose uptake in T2D-O. Mechanisms responsible, possible roles in the increased risk of developing diabetes, and its potential impact on long-term protein balance require definition.
Keywords: Insulin Resistance In Vivo, Protein Metabolism, Offspring, Glucose Metabolism
Significance of this study.
What is already known about this subject?
The offspring of patients with type 2 diabetes are at a higher risk of developing the disease.
Previous studies have identified several abnormalities in glucose and lipid metabolism in this population, but the status of protein metabolism is not known.
What are the new findings?
The main finding of the study is the presence of altered protein metabolism in lean young offspring of patients with type 2 diabetes.
The defect is characterized by the inability of insulin to stimulate protein synthesis with no defect in inhibiting protein breakdown.
How might these results change the focus of research or clinical practice?
This study adds to the body of work characterizing the early abnormalities in the pathogenesis of type 2 diabetes and may have implications for long-term protein balance.
Introduction
Insulin is a key hormone that regulates whole-body glucose, lipid, and protein metabolism through coordinated effects on multiple target tissues. Resistance to its action is thought to play a primary role in the development of type 2 diabetes (T2D). This is inferred in part from prospective studies demonstrating the presence of insulin resistance decades before the onset of the disease.1 2 In offspring of patients with type 2 diabetes (T2D-O), insulin resistance predicts development of the disease.2–4 This population is often studied to identify early defects in the pathogenesis of T2D.5 6 Indeed, even if glucose tolerant, lean T2D-O are often insulin resistant and display metabolic abnormalities in glucose metabolism, such as impaired insulin-stimulated glucose transport/phosphorylation7 8 and glycogen synthesis9 as well as fatty acid metabolism, including impaired whole-body lipid oxidation,10 11 muscle mitochondrial function,12 13 and intramyocellular lipid content.14 15 However, a defect in protein metabolism in T2D-O is not well established as only one prior study assessed protein breakdown in T2D-O using the conventional hyperinsulinemic clamp.16 Whereas it showed attenuated suppression of protein breakdown in T2D-O, data on synthesis were not available. Protein metabolism is important for protein homeostasis and energy expenditure, and its impairment in young individuals could have long-term consequences for protein and energy balance.
Several groups17–21 and we22–24 have modified the hyperinsulinemic clamp to combine both the tracer-estimated kinetic responses of glucoregulation (with stable- or tritium-labeled isotopes), with those of protein metabolism (with l-[1–13C]leucine). This allows for the estimation of endogenous glucose rate of appearance (Ra) and disappearance (Rd, uptake), as well as whole-body protein synthesis (S, non-oxidative leucine Rd), breakdown (B, endogenous leucine Ra) and oxidation. In healthy persons, the standard clamp technique showed that hyperinsulinemia inhibits protein B but does not stimulate S, thereby blunting the net synthesis (S–B) response.25–27 The latter is due to the decreased availability of circulating amino acids (AA) as substrates, rather than a direct effect of insulin. This was proved directly in muscle in vivo.28 When aminoacidemia is kept constant at postabsorptive levels by clamping with variable-rate infusion of a mixture of AA, inhibition of whole-body B and stimulation of S occur, a more physiological response.24
Using this hyperinsulinemic, euglycemic, isoaminoacidemic clamp, we have determined that in several insulin-resistant states, there is concurrent resistance of glucose and protein metabolism.22 Notably, this occurs in obesity (with normal glucose tolerance)22 and T2D.23 But whether this is a primary feature of the insulin-resistance syndrome or due to excess adiposity and hyperglycemia has not been established. Hence, we used this technique to test the hypothesis that glucose-tolerant T2D-O with no other known diabetes risk factors will show insulin resistance of whole-body protein anabolism concurrently with that of the well-documented glucose metabolism.
Materials and methods
Participants
Seven lean young offspring of at least one T2D parent, and eight age- and body-composition-matched volunteers without a family history of diabetes (controls, C) were recruited through local advertisements. Screening exclusion criteria included smoking, unstable weight (>±3 kg) for the last 6 months, cancer in the previous 5 years, unconventional diets, and medications known to affect metabolism. Respondents who met the inclusion criteria were screened with medical history and physical examination, electrocardiogram, chest X-ray, 24-hour dietary recall, and complete laboratory tests for the absence of hepatic, hematologic, renal, pulmonary, thyroid, and cardiovascular diseases. Eligible volunteers underwent a 75 g oral glucose tolerance test (OGTT), and those with impaired glucose tolerance were excluded. Participant characteristics are presented in table 1. All gave written, informed consent, and the Ethics Review Board of the McGill University Health Centre approved the protocol.
Table 1.
Participant characteristics
| Characteristic | C | T2D-O |
|---|---|---|
| n (W/M) | 4/4 | 4/3 |
| Age (years) | 24.6±1.1 | 26.0±2.1 |
| Height (cm) | 170.3±3.1 | 171.2±3.8 |
| Weight (kg) | 59.9±3.1 | 68.6±5.0 |
| BMI (kg/m2) | 20.6±0.4 | 23.2±0.7* |
| LBM (kg) | 44.7±3.2 | 47.2±4.5 |
| AMMI (kg/m2) | 6.9±0.4 | 7.4±0.5 |
| Trunk fat mass (kg) | 5.7±0.8 | 8.9±1.4 |
| Estimated visceral adipose tissue (g) | 148±47 | 322±198 |
| Body fat (%) | 21.3±2.9 | 27.6±2.6 |
| Waist circumference (cm) | 70.6±2.0 | 76.3±3.3 |
| Hip circumference (cm) | 90.2±2.3 | 95.2±1.6 |
| Waist/hip | 0.78±0.02 | 0.80±0.03 |
| 2 Hours OGTT plasma glucose (mmol/L) | 5.6±0.4 | 5.3±0.4 |
| OGTT net glucoseAUC (mg/dL/120 min) | 3573±967 | 2578±768 |
| OGTT net insulinAUC (µU/mL/120 min) | 4594±969 | 5544±828 |
| Matsuda-ISI index | 8.94±1.34 | 6.23±0.91 |
| HOMA-IR index | 1.1±0.2 | 1.4±0.2 |
| HbA1c (%) (mmol/mol) | 5.1±0.1 (32±1) | 5.5±0.2 (37±2)* |
| Triglycerides (mmol/L) | 0.64±0.07 | 0.56±0.07 |
| Total cholesterol (mmol/L) | 4.36±0.08 | 4.07±0.28 |
| HDL cholesterol (mmol/L) | 1.78±0.11 | 1.57±0.22 |
| LDL cholesterol (mmol/L) | 2.29±0.12 | 2.25±0.14 |
| Energy intake (kcal/day) | 2081±153 | 1990±188 |
| Protein intake (g/day) | 86.8±6.6 | 80.0±8.5 |
| REE (kcal/day) | 1369±113 | 1511±108 |
| npRQ | 0.82±0.01 | 0.80±0.01 |
| Fat oxidation (mg/min) | 46.4±5.3 | 60.6±5.9 |
| Glucose oxidative Rd (mg/min) | 64.5±7.8 | 60.5±8.6 |
| Glucose non-oxidative Rd (mg/min) | 75.4±9.0 | 81.2±10.3 |
Data are mean ± SEM.
*p<0.05 vs C, by independent samples t-test.
AMMI, appendicular muscle mass index; npRQ, non-protein respiratory quotient; OGTT, oral glucose tolerance test; REE, resting energy expenditure.
Study design
Participants were instructed to consume a weight-maintaining diet and refrain from strenuous physical activity for 3 days preceding the study. On the morning prior, they were admitted to the study unit of the Centre for Innovative Medicine of the Royal Victoria Hospital/McGill University Health Centre. They were provided with an isoenergetic, protein-controlled (1.83±0.06 g/kg lean body mass; LBM) diet, based on 24-hour food recall. Physical activity was limited to walks around the hospital grounds. Body circumferences were measured according to WHO 1995 criteria. Body composition was determined by dual-energy X-ray absorptiometry (iDXA equipped with CoreScan software; GE Healthcare Lunar, Madison, Wisconsin, USA). Female participants were studied during the follicular phase of the menstrual cycle.
Hyperinsulinemic, euglycemic, isoaminoacidemic clamp
The protocol is depicted in figure 1. On the clamp day, after a 10–12 hours overnight fast, catheters were inserted into an antecubital vein for infusions and a contralateral dorsal hand vein (retrograde) for blood sampling. The hand was placed in a heated box at 65°C to arterialize the venous blood. d-[3–3H]Glucose was infused (22 µCi bolus then 0.22 μCi/min; PerkinElmer, Boston, Massachusetts) for estimation of glucose kinetics. For leucine kinetics, an oral bolus of 0.1 mg/kg of NaH13CO2 and 0.5 mg/kg intravenous L-[1–13C]leucine bolus were followed by a constant infusion at 0.008 mg/kg/min. Stable isotopes were from Cambridge Isotope Laboratory (Andover, Massachusetts, USA). After 180 min, insulin (Humulin R; Eli Lilly Canada, Toronto, Ontario, Canada) was infused at 40 mU/m2/min for 180 min. During insulin infusion, a 20%, low 13C-glucose solution (Avebe b.a., Foxhol, the Netherlands) and an AA solution (TrophAmine 10% without electrolytes, B. Braun Medical, Irvine, California, USA) were infused at variable rates to maintain constant concentrations of plasma glucose at 5.5 mmol/L and of branched-chain AA (BCAA) at each individual's baseline, based on rapid fluorimetric measurements at 5 min intervals. TrophAmine was chosen as we have previously shown it to be able to maintain the serum concentrations most of its other AA at close to postabsorptive levels. Blood samples for substrates, hormones, and isotopic enrichment were collected at intervals specified in figure 1. Expired air was collected (Becton Dickinson Vacutainer Systems, Franklin Lakes, New Jersey, USA) for 13CO2 enrichment. A factor of 10.1% was used as adjustment to 13CO2 enrichment calculations to correct for dilution of background enrichment by glucose and AA infusions.24 Indirect calorimetry was performed for 20 min during postabsorptive and clamp states. Kinetics were determined at the isotopic steady states during the last 30 min of each phase.
Figure 1.
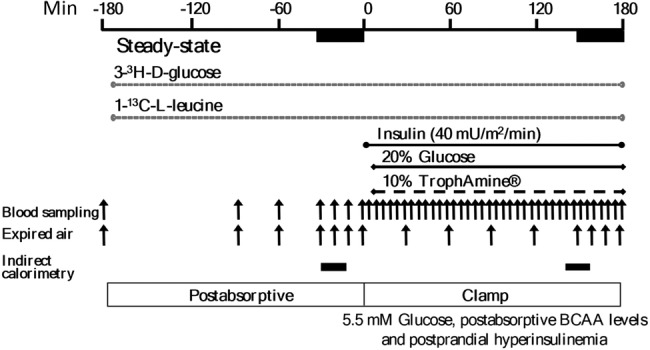
Hyperinsulinemic, euglycemic, isoaminoacidemic clamp protocol. Infusion of tracers was performed in the postabsorptive state, followed by the clamp period. Insulin infused at a constant rate, and glucose and the amino acid solution (TrophAmine) at feedback regulated rates based on frequent blood sampling. Both stages are of durations required to achieve the predetermined steady-state concentrations and isotopic enrichment for kinetics calculations. Samples of blood and expired air were obtained at times indicated by the vertical arrows, and indirect calorimetry during the periods indicated by the horizontal bars.
Substrates, whole-body protein, and glucose kinetics
Plasma glucose was measured by the glucose oxidase method (GM9 glucose analyzer, Analox Instruments, Lunenburg, Massachusetts, USA). Total BCAA concentrations were measured during clamp by a 4-min enzymatic, fluorimetric method (FP-6200; Jasco Corporation, Tokyo, Japan).24 Glucose turnover was calculated as in Ref. 24. Serum insulin was measured by ELISA (Mercodia AB, Uppsala, Sweden), and non-esterified fatty acid (NEFA) concentrations by colorimetric assay (NEFA-HR, Wako Chemicals USA, Richmond, VA, USA). Expired air was analyzed for 13CO2 enrichment by isotope ratio mass spectrometry (Micromass 903D, Vacuum Generators, Winsforce, UK). Individual plasma AA and the stable isotopic enrichments of the tracers were measured by liquid chromatography-tandem mass spectrometry (Agilent 6460 Triple Quadrupole, with UHPLC 1290, Santa Clara, CA, USA). l-[1–13C]Leucine kinetics were calculated at the isotopic steady states, according to Ref. 29, using plasma [1–13C]α-ketoisocaproic acid (KIC) enrichment (reciprocal model).
Statistical analyses
Results are presented as mean ± SEM. Participant characteristics were analyzed with the unpaired t-test. Postabsorptive data and responses to clamps were analyzed by repeated-measures analysis of variance (ANOVA) to test for clamp as within and between factors, and their interaction. To control for possible effects of adiposity on the main outcomes, glucose and protein kinetic parameters (in total units/min) were analyzed between groups by ANCOVA, with LBM and % body fat or waist as covariates. Non-normally-distributed data within postabsorptive and clamp periods were analyzed using non-parametric tests. Pearson's and Spearman's coefficients were used for simple correlations. From our previous data and based on Hall's formula using the intergroup difference in Δ net synthesis (S–B) of 0.26 μmol/kg fat-free mass/min with SD of 0.16, we estimated 7 participants were required to observe a difference at α=0.05 and power=0.80. A p-value of <0.05 was considered significant. Analyses were performed using SPSS Statistics 22 (IBM, Armonk, New York, USA).
Results
Participant characteristics
The two groups (table 1) were closely matched in sex distribution, anthropometric (except for a small difference in body mass index (BMI), albeit within the normal reference range) and comprehensive body composition variables. Likewise, fasting blood and OGTT variables (including incremental areas under the curve); homeostatic model of assessment-insulin resistance and Matsuda indices; serum lipids; daily energy and protein intake, resting energy expenditure (REE), non-protein respiratory quotient (npRQ); fat and glucose oxidation. Notwithstanding these similarities, mean glycated hemoglobin (HbA1c) was higher in the T2D-O, though within the reference range.
Postabsorptive and clamp insulin and substrates
In the postabsorptive state, serum insulin, plasma glucose, and serum NEFA did not differ between groups (table 2). The serum concentrations of the 23 AA measured differed solely for leucine, 17% higher in T2D-O, but only by 18 µmol/L (p=0.014, by Mann-Whitney U test). Though isoleucine and valine were not different, the difference in total BCAAs was borderline significant (p=0.052). The sum of non-essential or all AA measured did not differ. However, the total essential AA were higher in T2D-O (p=0.009, independent samples t-test). This was contributed to by several AA, individually not significantly higher (see online supplemental table S1). During the clamp, serum insulin was kept at the same postprandial levels, plasma glucose was maintained at postabsorptive levels, and NEFA concentrations decreased markedly to the same level. Changes in serum AA concentrations were of small magnitude: threonine, valine, asparagine, serine, and tyrosine decreased significantly, whereas histidine, lysine, methionine, phenylalanine, tryptophan, alanine, arginine, and glycine increased. There were no clamp × group interactions in the foregoing results, indicating that different magnitudes of change could not influence other end point differences between groups. However, KIC, the first step in leucine metabolism, was also significantly higher in the T2D-O, and decreased with the clamp in both groups, more in T2D-O (clamp×group interaction, p=0.033). Postabsorptive leucine correlated with KIC (r=0.611, p=0.016). Arginine did not differ and increased identically (p<0.001) during the clamp. In contrast, all three methylarginines (asymmetrical and symmetrical dimethylarginines (ADMA and SDMA, respectively) and NG-monomethyl-l-arginine (NMMA)), also not different, decreased similarly. Since methylarginines are released on protein catabolism, we tested their correlation with whole-body protein kinetics. Postabsorptive ADMA correlated with protein synthesis (0.525, p=0.044) and breakdown (0.587, p=0.021).
Table 2.
Circulating insulin and substrate concentrations
| C |
T2D-O |
p |
|||||
|---|---|---|---|---|---|---|---|
| Postabsorptive | Clamp | Postabsorptive | Clamp | Clamp | Group | C × G | |
| Insulin (pmol/L) | 30±5 | 381±32 | 35±4 | 460±42 | <0.001 | – | – |
| Glucose (mmol/L) | 5.1±0.2 | 5.3±0.0 | 5.3±0.1 | 5.5±0.1 | – | – | – |
| NEFA (μmol/L) | 418±75 | 51±2 | 468±69 | 61±5 | <0.001 | – | – |
| Leucine (μmol/L) | 103±3 | 106±2 | 121±6* | 116±11 | – | – | – |
| Isoleucine (μmol/L) | 46±2 | 48±2 | 54±3 | 54±5 | – | – | – |
| Valine (μmol/L) | 179±8 | 162±6 | 197±9 | 177±13 | <0.001 | – | – |
| Branched-chain AA (μmol/L) | 328±12 | 317±9 | 372±17 | 347±29 | – | – | – |
| Essential AA (μmol/L) | 671±17 | 700±18 | 768±28† | 793±43 | – | 0.018 | – |
| Non-essential AA (μmol/L) | 1405±90 | 1421±61 | 1321±67 | 1375±74 | – | – | – |
| Total AA (μmol/L) | 2075±90 | 2121±48 | 2089±80 | 2167±95 | – | – | – |
| α-Ketoisocaproic acid (µmol/L) | 48±1 | 33±2 | 68±6* | 44±5* | <0.001 | 0.009 | 0.033 |
| Arginine (µmol/L) | 56±5 | 79±4 | 60±9 | 84±13 | <0.001 | – | – |
| ADMA (µmol/L) | 0.625±0.039 | 0.578±0.031 | 0.634±0.044 | 0.602±0.038 | 0.001 | – | – |
| SDMA (µmol/L) | 0.485±0.020 | 0.468±0.022 | 0.517±0.013 | 0.485±0.010 | <0.001 | – | – |
| NMMA (µmol/L) | 0.113±0.014 | 0.103±0.010 | 0.121±0.014 | 0.113±0.013 | 0.020 | – | – |
Data are mean ± SEM.
*p<0.05 vs C of the same period, by Mann-Whitney U test.
†p<0.05 vs C postabsorptive, by independent samples t-test.
ADMA, asymmetrical dimethylarginine; C × G, clamp × group; NEFA, non-esterified fatty acid; NMMA, N-G-monomethyl-l-arginine; SDMA, symmetrical dimethylarginine.
bmjdrc-2016-000312supp_table.pdf (166.2KB, pdf)
Glucose and leucine kinetics
Postabsorptive glycemia (table 2) and glucose kinetic variables (figure 2) did not differ. Similar clamp decreases in endogenous Ra occurred (clamp effect p<0.001). Glucose infusion rates were 9.8±0.8 in C vs 6.6±0.6 mg/kg LBM/min in T2D-O (p=0.006, Mann-Whitney U test). Rd showed a lesser clamp increase in T2D-O, as indicated by a significant clamp × group interaction (p=0.006). When controlling for possible effects of adiposity, the difference in clamp glucose Rd remained significant when adjusted for % body fat or waist circumference (p<0.05) and after further adjusting for differences in HbA1c (p=0.043).
Figure 2.
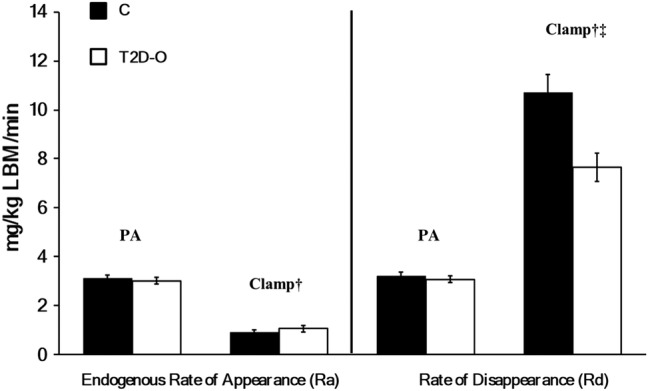
Whole-body glucose kinetics in C and T2D-O during postabsorptive and clamp states. Endogenous glucose rate of appearance (Ra) and disposal (Rd). Data are mean ± SEM. There was a significant clamp effect in glucose Ra, †p <0.001 by repeated-measures ANOVA, with no group effect or interaction. There was a significant increase in glucose Rd during clamp, †p <0.001. The clamp effect on glucose Rd was lower in T2D-O, ‡p =0.006, clamp × group interaction.
There were no group differences in postabsorptive leucine kinetics (figure 3A). Clamp leucine infusion rates were 1.14±0.08 in C vs 0.94±0.09 µmol/kg LBM/min in T2D-O (not significant). Similar increases occurred (clamp effect p<0.001) in flux and oxidation, and decreases in breakdown (figure 3B). However, in T2D-O, synthesis did not increase as in C (group effect, p=0.02; clamp × group interaction, p=0.015) and net balance failed to become positive (group effect, p=0.011; clamp × group interaction, p=0.001). The differences between groups in whole-body protein synthesis and net balance as well as Δ S and Δ net balance during the clamp remain significant when adjusted for % body fat or waist circumference. When adjusting for HbA1c, differences remained in protein S (p=0.015) and Δ S (p=0.015), but not in net balance (p=0.259) and Δ net balance (p=0.098). Strong positive correlations existed between clamp glucose Rd and protein synthesis (r=0.743, p=0.002) and Δ net balance (r=0.732, p=0.002).
Figure 3.
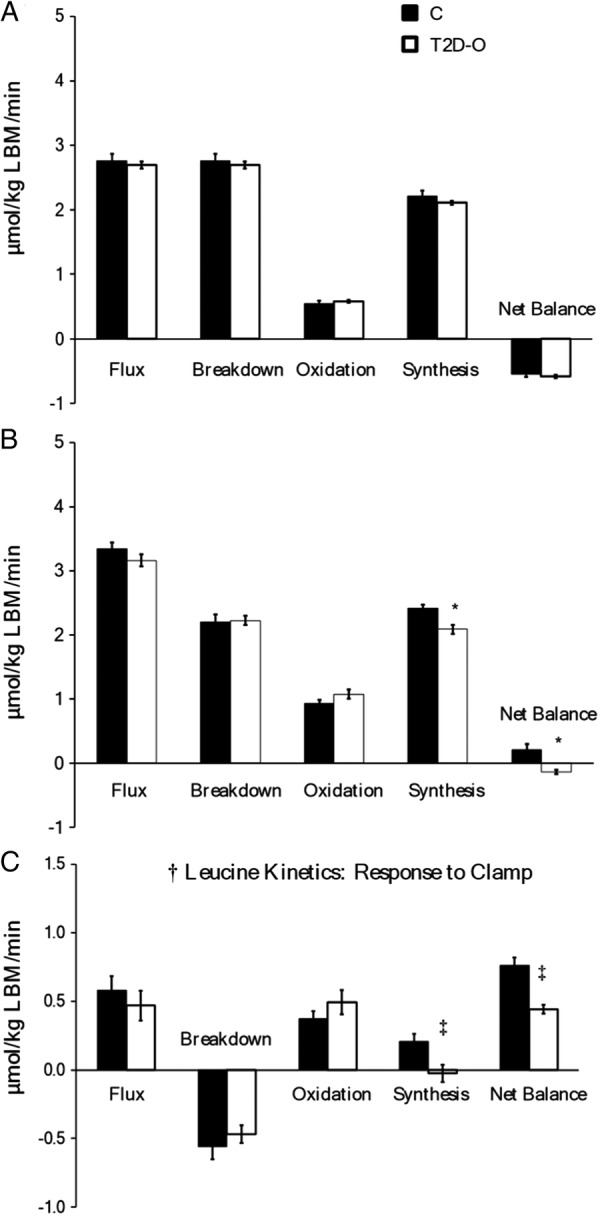
Whole-body protein kinetics in C and T2D-O during postabsorptive and clamp states. Leucine flux, protein breakdown (leucine endogenous Ra), oxidation, synthesis (non-oxidative leucine Rd), and net balance (synthesis–breakdown). A: Postabsorptive and B: clamp states. Data are mean ± SEM. There was a significant clamp effect in all kinetic variables, †p <0.05. Protein synthesis and net balance were significantly lower in T2D-O during the clamp period, *p < 0.05. C; response to clamp. Protein synthesis did not increase in T2D-O resulting in a lower increment in net balance, ‡p <0.05, clamp ×group interaction.
Discussion
Using the hyperinsulinemic-isoaminoacidemic clamp, we have previously established that insulin resistance of protein metabolism exists concurrently with that of glucose metabolism in obesity22 and T2D.23 Since these conditions are associated with several metabolic disturbances including greater adiposity and hyperglycemia, impaired whole-body protein anabolism could be a consequence of these factors and not a primary feature of insulin-resistant conditions. To distinguish between these possibilities, we assessed whole-body protein and glucose metabolism in lean young offspring of T2D parents, a population commonly studied to identify the earliest defects in insulin resistance.6 7 10 12 13 Our group of lean T2D-O, as with C, had normal postabsorptive glucose, NEFAs and insulin levels, as well as most individual AAs. Furthermore, they had comparable insulin sensitivity indices based on fasting blood and OGTT measurements. However, T2D-O had subtly but significantly higher BMIs as well as postabsorptive leucine (with correspondingly higher KIC) and HbA1c levels, though all within their normal ranges. We confirmed the presence of insulin resistance of whole-body glucose disposal in T2D-O, independent of the slightly elevated adiposity and HbA1C, as previously reported in conventional clamp studies. Notable is that we also confirmed that there is not a defect in insulin suppression of glucose production.7 12 15 Thus, our participants resembled those in previous studies of T2D-O.
The principal new finding is the demonstration of insulin resistance of whole-body protein anabolism in offspring of T2D patients. As with glucose, postabsorptive kinetics were not different. The inclusion of maintained clamp isoaminoacidemia with measurement of leucine oxidation allowed for definition of the resistance as due to impaired whole-body protein synthesis. As there was no difference in the suppression of catabolism, the impairment of net anabolism (synthesis minus breakdown) was due to synthesis. The only previous clamp study with the same leucine tracer was not isoaminoacidemic and only estimated catabolism, which was suppressed less in the T2D-O.16 However, its significance is mitigated by the conventional clamp being a state in which synthesis is limited by the insulin suppression of catabolism making fewer AA available. Our results show that the impaired insulin-stimulated whole-body protein anabolism is another early defect in insulin resistance, independent of differences in the total and central adiposity.
The defect of whole-body protein anabolism in T2D-O could be explained by impaired protein synthesis in insulin-sensitive tissues. We are unaware of prior studies of tissue protein fractional synthesis rates in T2D-O, so the contributions of individual tissues in this population remain to be determined. Though muscle has the largest protein content of the body (∼50%) in mammals, it contributes only about 25% to turnover26 and has a much lower fractional synthesis rate than the liver.30 31 There is evidence from animal studies,31 32 as well as regional catheterization in human studies, that the splanchnic drained viscera have much higher protein turnover, particularly synthesis rates.33 Calculations comparing the relative contributions of the visceral tissues with faster turnover, with total skeletal muscle and its slow rates, have been made.34 Hence, as visceral tissues are insulin responsive, the lesser protein-synthetic response we found in T2D-O might be accounted for by lesser clamp responses of this compartment. Nygren and Nair concluded from iso- and hyper-aminoacidemic clamps in healthy volunteers that anabolism in muscle is mostly insulin mediated, whereas AA modulate it in muscle and splanchnic bed.27 The tissues contributing to impairment of whole-body protein anabolism in T2D-O have yet to be established.
The concentrations of the 19 postabsorptive AA (see online supplementary table S1) showed only one group difference, that of leucine, higher in the T2D-O. This difference is typically reported in the presence of insulin resistance, especially in obesity and diabetes35 36 though has not been reported in offspring. The elevations of the BCAA and aromatic AA are even considered a metabolomic signature and risk factor for later T2D,35 such that higher leucine may be an early biomarker in offspring. That the use of TrophAmine caused mostly small but significant increases in several AA, is because plasma BCAAs were our target for maintaining isoaminoacidemia through feedback adjustments of infusion rates. The rise in alanine is also contributed to by the increase in glucose Rd, via the alanine cycle. That the total BCAA, total non-essential and total AA were not different, and the total essential AA minimally elevated, documents the justification for ‘isoaminoacidemia’. The changes are minuscule compared with their postprandial responses. AAs absent from the infusate tended to decline: aspartate, asparagine, and glutamine; in the case of tyrosine, it is because it is present in a slowly metabolized form.
Other end points measured are of particular interest (table 2). Plasma α-ketoisocaproic acid, the first step in leucine metabolism, was, like leucine, also significantly higher in the T2D-O. Elevated KIC concentration is also part of the metabolomic signature of T2D.37 While it declined with the clamp, the group difference was sustained. The decline reflects the similar protein breakdown suppression, without compensation from the AA infusion, since it does not contain KIC. Its plasma enrichment is measured for the leucine kinetic calculation as it better reflects intracellular leucine metabolism.38 The three methylarginines, NMMA, ADMA and SDMA, did not differ between groups, but they also declined similarly during hyperinsulinemia. Hence, their decline could also have been due to the clamp inhibition of protein breakdown. This could be a physiologic response, as all three inhibit arginine transport into cells, and NMMA and ADMA inhibit nitric oxide synthase, so vasodilatation could be enhanced. We have previously shown that MA levels correlate with rates of glucose and protein turnover in lean, obese, and elderly persons.39 That they correlated positively with fasting protein flux rates is further consistent with control by protein breakdown rates. Tessari et al,40 in persons with a range of insulin resistance, demonstrated a clamp decrease of ADMA and SDMA, and that ADMA contributes to the impaired whole-body nitric oxide synthesis implicated in their decreased vascular responsiveness. Though the NOS precursor arginine likely increased in our study because of its content in TrophAmine, for an effect on MA levels, it would have to be incorporated into protein, methylated, and subsequently released.
Conclusions
As we have previously demonstrated in other insulin-resistant states, offspring of T2D patients were characterized by an impairment in whole-body protein anabolism (synthesis and net balance), which was proportional to the insulin resistance with respect to glucose metabolism. The tissues responsible for the defect in protein anabolism remain to be determined. The results are compatible with impaired whole-body protein anabolism being a primary defect in T2D. As insulin resistance is present in T2D-O decades before the onset of the disease, early alterations of protein metabolism may have consequence for their long-term protein balance.
Acknowledgments
The authors are grateful for technical support from Concettina Nardolillo, Daniel White, Heng Jiang, and Kathryn Wright.
Footnotes
Contributors: SAB, VC, MAT, SC, and EBM designed the experimental protocol. SAB, VC, MAT, SC, JAM, ML, and EBM recruited and screened participants and conducted the clamp experiment. SAB, SC, ML, and EBM performed and/or supervised the laboratory analyses and analyzed data. SAB, SC, and EBM wrote the manuscript. All authors approved the manuscript.
Funding: This work was supported by a grant from Canadian Institutes of Health Research to EBM (MOP-62889).
Competing interests: None declared.
Ethics approval: Ethics Review Board of the McGill University Health Centre.
Provenance and peer review: Not commissioned; externally peer reviewed.
Data sharing statement: No additional data are available.
References
- 1.Lillioja S, Mott DM, Spraul M et al. Insulin resistance and insulin secretory dysfunction as precursors of non-insulin-dependent diabetes mellitus. Prospective studies of Pima Indians. N Engl J Med 1993;329:1988–92. 10.1056/NEJM199312303292703 [DOI] [PubMed] [Google Scholar]
- 2.Martin BC, Warram JH, Krolewski AS et al. Role of glucose and insulin resistance in development of type 2 diabetes mellitus: results of a 25-year follow-up study. Lancet 1992;340:925–9. [DOI] [PubMed] [Google Scholar]
- 3.Warram JH, Martin BC, Krolewski AS et al. Slow glucose removal rate and hyperinsulinemia precede the development of type II diabetes in the offspring of diabetic parents. Ann Intern Med 1990;113:909–15. [DOI] [PubMed] [Google Scholar]
- 4.Goldfine AB, Bouche C, Parker RA et al. Insulin resistance is a poor predictor of type 2 diabetes in individuals with no family history of disease. Proc Natl Acad Sci USA 2003;100:2724–9. 10.1073/pnas.0438009100 [DOI] [PMC free article] [PubMed] [Google Scholar]
- 5.DeFronzo RA, Tripathy D. Skeletal muscle insulin resistance is the primary defect in type 2 diabetes. Diabetes Care 2009;32(Suppl 2):S157–63. 10.2337/dc09-S302 [DOI] [PMC free article] [PubMed] [Google Scholar]
- 6.Morino K, Petersen KF, Dufour S et al. Reduced mitochondrial density and increased IRS-1 serine phosphorylation in muscle of insulin-resistant offspring of type 2 diabetic parents. J Clin Invest 2005;115:3587–93. 10.1172/JCI25151 [DOI] [PMC free article] [PubMed] [Google Scholar]
- 7.Rothman DL, Magnusson I, Cline G et al. Decreased muscle glucose transport/phosphorylation is an early defect in the pathogenesis of non-insulin-dependent diabetes mellitus. Proc Natl Acad Sci USA 1995;92:983–7. [DOI] [PMC free article] [PubMed] [Google Scholar]
- 8.Pendergrass M, Bertoldo A, Bonadonna R et al. Muscle glucose transport and phosphorylation in type 2 diabetic, obese nondiabetic, and genetically predisposed individuals. Am J Physiol Endocrinol Metab 2007;292:E92–100. 10.1152/ajpendo.00617.2005 [DOI] [PubMed] [Google Scholar]
- 9.Perseghin G, Price TB, Petersen KF et al. Increased glucose transport-phosphorylation and muscle glycogen synthesis after exercise training in insulin-resistant subjects. N Engl J Med 1996;335:1357–62. 10.1056/NEJM199610313351804 [DOI] [PubMed] [Google Scholar]
- 10.Perseghin G, Ghosh S, Gerow K et al. Metabolic defects in lean nondiabetic offspring of NIDDM parents: a cross-sectional study. Diabetes 1997;46:1001–9. [DOI] [PubMed] [Google Scholar]
- 11.Lattuada G, Costantino F, Caumo A et al. Reduced whole-body lipid oxidation is associated with insulin resistance, but not with intramyocellular lipid content in offspring of type 2 diabetic patients. Diabetologia 2005;48:741–7. 10.1007/s00125-005-1686-6 [DOI] [PubMed] [Google Scholar]
- 12.Petersen KF, Dufour S, Befroy D et al. Impaired mitochondrial activity in the insulin-resistant offspring of patients with type 2 diabetes. N Engl J Med 2004;350:664–71. 10.1056/NEJMoa031314 [DOI] [PMC free article] [PubMed] [Google Scholar]
- 13.Befroy DE, Petersen KF, Dufour S et al. Impaired mitochondrial substrate oxidation in muscle of insulin-resistant offspring of type 2 diabetic patients. Diabetes 2007;56:1376–81. 10.2337/db06-0783 [DOI] [PMC free article] [PubMed] [Google Scholar]
- 14.Jacob S, Machann J, Rett K et al. Association of increased intramyocellular lipid content with insulin resistance in lean nondiabetic offspring of type 2 diabetic subjects. Diabetes 1999;48:1113–9. [DOI] [PubMed] [Google Scholar]
- 15.Perseghin G, Scifo P, De Cobelli F et al. Intramyocellular triglyceride content is a determinant of in vivo insulin resistance in humans—a H-1-C-13 nuclear magnetic resonance spectroscopy assessment in offspring of type 2 diabetic parents. Diabetes 1999;48:1600–6. 10.2337/diabetes.48.8.1600 [DOI] [PubMed] [Google Scholar]
- 16.Lattuada G, Sereni LP, Ruggieri D et al. Postabsorptive and insulin-stimulated energy homeostasis and leucine turnover in offspring of type 2 diabetic patients. Diabetes Care 2004;27:2716–22. [DOI] [PubMed] [Google Scholar]
- 17.Guillet C, Delcourt I, Rance M et al. Changes in basal and insulin and amino acid response of whole body and skeletal muscle proteins in obese men. J Clin Endocrinol Metab 2009;94: 3044–50. 10.1210/jc.2008-2216 [DOI] [PubMed] [Google Scholar]
- 18.Luzi L, Castellino P, DeFronzo RA. Insulin and hyperaminoacidemia regulate by a different mechanism leucine turnover and oxidation in obesity. Am J Physiol 1996;270(2 Pt 1):E273–81. [DOI] [PubMed] [Google Scholar]
- 19.Fukagawa NK, Minaker KL, Rowe JW et al. Insulin-mediated reduction of whole body protein breakdown. Dose-response effects on leucine metabolism in postabsorptive men. J Clin Invest 1985;76:2306–11. 10.1172/JCI112240 [DOI] [PMC free article] [PubMed] [Google Scholar]
- 20.Pacy PJ, Nair KS, Ford C et al. Failure of insulin infusion to stimulate fractional muscle protein synthesis in type I diabetic patients. Anabolic effect of insulin and decreased proteolysis. Diabetes 1989;38:618–24. [DOI] [PubMed] [Google Scholar]
- 21.Tessari P, Trevisan R, Inchiostro S et al. Dose-response curves of effects of insulin on leucine kinetics in humans. Am J Physiol 1986;251(3 Pt 1):E334–42. [DOI] [PubMed] [Google Scholar]
- 22.Chevalier S, Marliss EB, Morais JA et al. Whole-body protein anabolic response is resistant to the action of insulin in obese women. Am J Clin Nutr 2005;82:355–65. [DOI] [PubMed] [Google Scholar]
- 23.Pereira S, Marliss EB, Morais JA et al. Insulin resistance of protein metabolism in type 2 diabetes. Diabetes 2008;57: 56–63. 10.2337/db07-0887 [DOI] [PubMed] [Google Scholar]
- 24.Chevalier S, Gougeon R, Kreisman SH et al. The hyperinsulinemic amino acid clamp increases whole-body protein synthesis in young subjects. Metab Clin Exp 2004;53:388–96. [DOI] [PubMed] [Google Scholar]
- 25.Castellino P, Luzi L, Simonson DC et al. Effect of insulin and plasma amino-acid-concentrations on leucine metabolism in man—role of substrate availability on estimates of whole-body protein-synthesis. J Clin Invest 1987;80:1784–93. 10.1172/JCI113272 [DOI] [PMC free article] [PubMed] [Google Scholar]
- 26.Heslin MJ, Newman E, Wolf RF et al. Effect of hyperinsulinemia on whole body and skeletal muscle leucine carbon kinetics in humans. Am J Physiol 1992;262(6 Pt 1):E911–8. [DOI] [PubMed] [Google Scholar]
- 27.Nygren J, Nair KS. Differential regulation of protein dynamics in splanchnic and skeletal muscle beds by insulin and amino acids in healthy human subjects. Diabetes 2003;52:1377–85. 10.2337/diabetes.52.6.1377 [DOI] [PubMed] [Google Scholar]
- 28.Bell JA, Fujita S, Volpi E et al. Short-term insulin and nutritional energy provision do not stimulate muscle protein synthesis if blood amino acid availability decreases. Am J Physiol Endocrinol Metab 2005;289:E999–1006. 10.1152/ajpendo.00170.2005 [DOI] [PMC free article] [PubMed] [Google Scholar]
- 29.Matthews DE, Schwarz HP, Yang RD et al. Relationship of plasma leucine and alpha-ketoisocaproate during a L-[1–13C]leucine infusion in man: a method for measuring human intracellular leucine tracer enrichment. Metab Clin Exp 1982;31:1105–12. [DOI] [PubMed] [Google Scholar]
- 30.Rooyackers OE, Nair KS. Hormonal regulation of human muscle protein metabolism. Annu Rev Nutr 1997;17:457–85. 10.1146/annurev.nutr.17.1.457 [DOI] [PubMed] [Google Scholar]
- 31.Millward DJ. Protein turnover in skeletal muscle. II. The effect of starvation and a protein-free diet on the synthesis and catabolism of skeletal muscle proteins in comparison to liver. Clin Sci 1970;39:591–603. [DOI] [PubMed] [Google Scholar]
- 32.Stoll B, Burrin DG, Henry J et al. Phenylalanine utilization by the gut and liver measured with intravenous and intragastric tracers in pigs. Am J Physiol 1997;273(6 Pt 1):G1208–17. [DOI] [PubMed] [Google Scholar]
- 33.Nair KS, Ford GC, Ekberg K et al. Protein dynamics in whole body and in splanchnic and leg tissues in type I diabetic patients. J Clin Invest 1995;95:2926–37. 10.1172/JCI118000 [DOI] [PMC free article] [PubMed] [Google Scholar]
- 34.Munro HN, Crim MC. The proteins and amino acids. In: Shils ME, Young VR, eds. Modern nutrition in health and disease. Philadelphia: (PA: ): Lea & Febiger, 1988:1–37. [Google Scholar]
- 35.Wang TJ, Larson MG, Vasan RS et al. Metabolite profiles and the risk of developing diabetes. Nat Med 2011;17:448–53. 10.1038/nm.2307 [DOI] [PMC free article] [PubMed] [Google Scholar]
- 36.Newgard CB, An J, Bain JR et al. A branched-chain amino acid-related metabolic signature that differentiates obese and lean humans and contributes to insulin resistance. Cell Metab 2009;9:311–26. 10.1016/j.cmet.2009.02.002 [DOI] [PMC free article] [PubMed] [Google Scholar]
- 37.Padberg I, Peter E, Gonzalez-Maldonado S et al. A new metabolomic signature in type-2 diabetes mellitus and its pathophysiology. PLoS One 2014;9:e85082 10.1371/journal.pone.0085082 [DOI] [PMC free article] [PubMed] [Google Scholar]
- 38.Barazzoni R, Meek SE, Ekberg K et al. Arterial KIC as marker of liver and muscle intracellular leucine pools in healthy and type 1 diabetic humans. Am J Physiol 1999;277(2 Pt 1):E238–44. [DOI] [PubMed] [Google Scholar]
- 39.Marliss EB, Chevalier S, Gougeon R et al. Elevations of plasma methylarginines in obesity and ageing are related to insulin sensitivity and rates of protein turnover. Diabetologia 2006;49:351–9. 10.1007/s00125-005-0066-6 [DOI] [PubMed] [Google Scholar]
- 40.Tessari P, Cecchet D, Artusi C et al. Roles of insulin, age, and asymmetric dimethylarginine on nitric oxide synthesis in vivo. Diabetes 2013;62:2699–708. 10.2337/db12-1127 [DOI] [PMC free article] [PubMed] [Google Scholar]
Associated Data
This section collects any data citations, data availability statements, or supplementary materials included in this article.
Supplementary Materials
bmjdrc-2016-000312supp_table.pdf (166.2KB, pdf)