

Abstract
Undifferentiated nasopharyngeal carcinoma (NPC) is 100% associated with Epstein‐Barr virus (EBV) as oncogenic driver. NPC is often diagnosed late due to initial vague complaints and obscured location. Prior studies suggest that measurement of EBV DNA load and RNA transcripts in nasopharyngeal (NP) brushings is useful for minimally invasive NPC diagnosis. However, whether these EBV markers relate to local virus replication or reflect tumor origin remains to be demonstrated. To resolve this, we analysed EBV‐DNA characteristics and quantified latent and lytic viral RNA transcripts in NP brushings and matching frozen NP‐biopsy specimens from patients suspected of having NPC.
We observed non‐fragmented and Cp‐promotor methylated EBV‐DNA in both NP brushings and biopsies suggestive of tumor origin. Using quantitative RT‐PCR we determined expression levels of 7 critical latent (EBER1, Qp‐EBNA1, EBNA2, BART, LMP1, LMP2, BARF1) and 5 lytic (Zta, Rta, TK, PK and VCA‐p18) RNA transcripts. Although latent and early lytic RNA transcripts were frequently detected in conjunction with high EBV viral load, in both brushings and biopsies the latent transcripts prevailed and reflected a typical NPC‐associated latency‐II transcription profile without EBNA2. Late lytic RNA transcripts were rare and detected at low levels mainly in NP brushings, suggestive of abortive viral reactivation rather than complete virus replication. EBV‐IgA serology (EBNA1, VCA, Zta) did not correlate to the level of viral reactivation in situ.
Overall, viral RNA profiling, DNA fragmentation and methylation analysis in NP brushings and parallel biopsies indicate that NP brush sampling provides a true and robust indicator of NPC tumor presence.
Keywords: nasopharyngeal brushing, EBV viral load, EBV RNA profiles, viral DNA methylation, EBV IgA serology
Short abstract
What's new?
Nasopharyngeal carcinoma (NPC) often is diagnosed at late stages, in part because physical examination of the nasopharyngeal (NP) space is difficult. Moreover, despite a strong association with Epstein‐Barr virus (EBV) infection, optimal EBV‐based diagnostic modalities for NPC are lacking. Here, EBV DNA load, methylation status and EBV latent and lytic RNA profiles obtained from NP brush biopsy were found to be robustly indicative of tumor presence at the site of initiation. EBV (immediate) early mRNAs were frequently detected, suggesting local abortive viral reactivation. Using the described EBV markers, NP brushing may be a practical minimally invasive approach for NPC diagnosis.
Abbreviations
- EBV
Epstein‐Barr virus
- MSP
methylation‐specific PCR
- NP
nasopharyngeal
- NPC
nasopharyngeal carcinoma
Nasopharyngeal carcinoma (NPC) is an epithelial cancer prevailing as endemic disease in southern China, Southeast Asia, the Arctic and the Mediterranean rim, including Middle East and Northern Africa.1, 2 Most endemic NPC cases classify as undifferentiated non‐keratinizing WHO type‐III tumors and EBV is implicated as the causal agent in the vast majority of cases.3 EBV infects most humans worldwide leading to a long‐term carrier status characterized by latent viral persistence in memory B‐cells in the circulation and virus shedding in saliva.4, 5, 6 Besides in circulating B‐cells, EBV is maintained in a small number of epithelial cells associating with lymphoid tissue of the Waldeyer's ring, in particular the tonsils and the posterior epithelium of the Rosenmuller's fossa.7, 8 Occasionally, most likely linked to host cell differentiation, EBV may reactivate into the lytic cycle to produce virus progeny, although this process may be interrupted leading to so‐called abortive replication.9, 10, 11, 12, 13, 14 During latency the viral episome is heavily methylated, limiting the number of viral transcripts being produced, whereas replicating genomes are unmethylated.3, 15 NPC tumor cells carry methylated clonal viral genomes and express the viral latency‐II transcription program comprising of abundant non‐coding small RNAs EBER1 and EBER2, mRNAs encoding EBNA1, LMP1, LMP2A, LMP2B and BARF1 proteins and so‐called BART RNAs yielding >40 microRNAs.16, 17, 18
During virus reactivation, two viral immediate early genes (BZLF1 and BRLF1) activate the lytic cascade resulting in expression of >50 non‐structural (early) and structural (late) proteins.3, 11, 12, 13, 14 In vivo EBV persistence and replication is barely detectable in oral and nasopharyngeal epithelia and glandular tissues of healthy EBV carriers, except in rare conditions such as Oral Hairy Leukoplakia.19, 20, 21, 22, 23 Yet, EBV is continuously shed into saliva, even in the absence of detectable B‐cells, implicating non‐glandular mucosal epithelia of the oro‐nasopharyngeal cavity as site of virus production.5, 6, 19, 20 NPC is commonly diagnosed at late stages due to non‐specific symptoms at early stage and a deep tumor location in the nasopharyngeal (NP) space, making NPC diagnosis by physical examination problematic.2, 3 A painful trans‐nasal biopsy and subsequent pathological examination is commonly needed for diagnosis. Cell‐free EBV DNA detected in peripheral blood of many but not all NPC patients, is thought to relate to DNA fragments released by apoptotic tumor cells.24, 25 However, circulating viral mRNA is virtually absent, excluding circulating tumor cells as the source of EBV‐DNA.25 NPC patients show elevated IgA and IgG antibody responses to multiple viral antigens, with IgA reactivity reflecting viral activity in the oro‐nasopharyngeal mucosal compartment.26, 27, 28 Aberrant IgA antibodies against viral lytic antigens (EA and VCA) are detectable at early stages of NPC and in populations at risk of developing NPC.29, 30, 31, 32 Late‐lytic antigens are essential for viral DNA replication, which is central to productive reactivation. An association between elevated IgA antibody titers, plasma EBV DNA levels and NPC risk is strong indicating that a reactivation of EBV infection plays a role in tumor development, therefore a combination of those EBV markers is suggested for NPC screening in high‐risk populations.33, 34
Molecular analysis of minimally invasive NP brushings that contain abnormal level of viral DNA and RNA provides an alternative and promising new approach for (early) NPC diagnosis.35, 36, 37, 38, 39, 40 The presence of latently EBV‐infected NPC tumor cells in NP brush specimens can be visualized by cytology.41 Furthermore, NP‐brush sampling allows assessment of tumor suppressor gene methylation, providing additional tumor markers.42, 43 In addition, following therapy, prevailing high levels of viral DNA in NP brushings is linked to poor response or recurrent disease.44
Despite the potential usefulness of EBV viral load values in NP brushings for NPC detection, the original source of high levels of EBV‐DNA concentration in NP brushings from NPC patients is not properly defined. In order to corroborate the minimally invasive NP brush method for robust use in NPC diagnosis, further evidence is needed to demonstrate that EBV‐markers in NP brushings directly reflect tumor origin. Here, we explored and confirmed the utility of NP brushing as an accurate and objective diagnostic tool for NPC detection by measuring EBV DNA load, EBV latent and lytic mRNA transcripts in a multi‐primed real time RT‐PCR approach and by viral DNA methylation analysis in NP brushings and parallel obtained frozen biopsies from the same location. The viral transcriptional activity and amount of EBV DNA were critically analysed and expressed by means of virus content and transcriptional activity on a “per infected cell” basis. Our data suggest that NP brushing is a representative non‐invasive tool that truly represents NPC tumor activity.
Material and Methods
Patients and biological samples
Samples were collected prospectively from patients presenting with signs and symptoms suspected of NPC at the Dr. Cipto Mangunkusumo Hospital, Universitas Indonesia in Jakarta. For this study, the biopsy specimen was dissected into two pieces; one half was immediately snap‐frozen in liquid nitrogen and the second half was fixed in buffered formalin for routine paraffin embedding and pathological examination. Biopsy, NP brushing, whole blood and serum sampling were carried out as described before.2, 30, 36
All specimens were stored in a −80°C freezer until shipment in dry ice to the department of Pathology, VU University Medical Center, Amsterdam, The Netherlands for DNA/RNA and serological analysis. Of the 89 NP brushings overall, 76 had biopsy‐proven EBV‐related NPC, eight were from healthy EBV carriers and five were proven to have other non‐EBV related head and neck diseases. From the 38 frozen biopsies used in mRNA analysis, 35 were NPC samples, two were taken from patient with tonsillitis and 1 was a biopsy from patient with chronic enlarged lymph node (CELN).
EBV DNA/RNA extraction
DNA and RNA from NP brushings were extracted simultaneously using silica‐based extraction procedure exactly as described before.45, 46 One milliliter of LB lysate was used as input for DNA/RNA isolation, and nucleic acids were eluted in 100 μl water. Reagents for silica DNA/RNA extraction were purchased as basic kit ingredients from BioMérieux (Boxtel, The Netherlands). DNA/RNA isolation from frozen tissue dissolved in Trizol (five times 10 μm sections as input) was performed according to the manufacturer's instructions (Invitrogen). DNA extracted from all materials was stored at −20°C and RNA extracts were kept at −80°C until use.
EBV DNA load quantification by quantitative real‐time PCR
The EBV DNA load in all NP brushings and parallel biopsies was determined by a quantitative LightCycler (LC, Roche) real‐time PCR targeting a conserved 99 bp region of BKRF1 gene encoding Epstein‐Barr virus Nuclear Antigen‐1 (EBNA‐1). A 213 bp LC‐based PCR assay targeting an overlapping region of EBNA1 was performed to distinguish fragmented and intact DNA in paired brush‐biopsy samples.25, 36, 45 The sequences of primers and probes used for EBV markers are listed in Table 1. The cutoff value was defined at 2,321 viral DNA copies per brush as described.36, 37 The amount of human diploid genome equivalents in brush‐biopsy specimens was measured by LC‐PCR detecting a 197 bp fragment of the human β‐globin gene.47 EBV DNA low and negative results in either NP brushings or biopsies were confirmed by spiking samples with 1,000 copies EBNA1 plasmid DNA to check for PCR inhibition. During LC‐PCR amplification, EBV DNA from EBV‐positive cell lines (C666.1 or Namalwa cells) was used as internal control. The EBV DNA load in NP brushings was expressed as copies of EBV genome per brush; whereas in frozen biopsy samples, it was expressed as copies of EBV genome per ml Trizol lysate (five times 10 µm biopsy sections/ml Trizol). Viral load in each sample was normalized to cellular β‐globin DNA quantity to estimate the relative amount of EBV DNA per cell. For each paired specimen the viral load was also expressed as number of copies of EBV genome per cell.
Table 1.
Sequences of the EBV specific primers and probes used in this study
| Name | Oligo | Sequence (5'–3') | Amplicon length (bp) | Melting temperature |
|---|---|---|---|---|
| Viral DNA load | ||||
| EBNA1 | QP1‐F | GCCGGTGTGTTCGTATATGG | 213 | |
| QP2‐R | CAAAACCTCAGCAAATATATGAG | |||
| QP3‐F | CCACAATGTCGTCTTACACC | 99 | ||
| QP4‐R | ATAACAGACAATGGACTCCCT | |||
| Donor‐probe | TCTCCCCTTTGGAATGGCCCCTG | |||
| Acceptor‐probe | ACCCGGCCCACAACCTG | |||
| EBV mRNA profile | ||||
| EBER1 | EBER1‐F | GAGGTTTTGCTAGGGAGGAGA | 141 | 86.6 |
| EBER1‐R | CGGACCACCAGCTGGTA | |||
| BARTs | BART‐F | AGAGACCAGGCTGCTAAACA | 237 | 88.4 |
| BART‐R | AACCAGCTTTCCTTTCCGAG | |||
| EBNA1‐QK | EBNA1‐F | GTGCGCTACCGGATGGCG | 236 | 87.0 |
| EBNA1‐R | CATTTCCAGGTCCTGTACCT | |||
| LMP1 | LMP1‐F | TGAGTGACTGGACTGGAGGA | 236 | 82.4 |
| LMP1‐R | GATACCTAAGACAAGTAAGCA | |||
| LMP2A | LMP2A‐F | AGGTACTCTTGGTGCAGCCC | 196 | 83.4 |
| LMP2A‐R | AGCATATAGGAACAGTCGTGCC | |||
| BARF1 | BARF1‐F | GCCTCTAACGCTGTCTGTCC | 183 | 87.4 |
| BARF1‐R | GAGAGGCTCCCATCCTTTTC | |||
| EBNA2 | EBNA2‐F | TACGCATTAGAGACCACTTTGAGCC | 196 | 84.7 |
| EBNA2‐R | AAGCGCGGGTGCTTAGAAGG | |||
| ZEBRA | ZEBRA‐F | CGCACACGGAAACCACAACAGC | 143 | 83.2 |
| ZEBRA‐R | GAAGCGACCTCACGGTAGTG | |||
| RTA | RTA‐F | TGATGATTCCTGCCACCATA | 218 | 86.6 |
| RTA‐R | GAGGACGGGATAGGTGAACA | |||
| TK | TK‐F | AGCTGAAgCGGCTAAGTGGGA | 150 | 84.4 |
| TK‐R | AGGCAGGTTTGATTACTGGTACA | |||
| PK | PK‐F | GCTGACTCCACCCACAAAAT | 155 | 84.8 |
| PK‐R | GAGGTCAGGCCCATGTCTAA | |||
| VCA‐p18 | VCAp18‐F | CCAACGCGCCATAGACAAGAG | 203 | 91.5 |
| VCAp18‐R | GAGGCTGCTAATAGATGAAGAAACA | |||
| Housekeeping genes | ||||
| Human b‐globin | b‐globin‐F | GGAGAAGTCTGCCGTTACTGC | 197 | |
| b‐globin‐R | TTGGTCTCCTTAAACCTGTCTTGT | |||
| Donor‐probe | CCAGGGCCTCACCACCAACTTC | |||
| Acceptor‐probe | CCACGTTCACCTTGCCCCACAG | |||
| U1A | U1A‐F | CAGTATGCCAAGACCGACTCAGA | 226 | 91.1 |
| U1A‐R | GGCCCGGCATGTGGTGCATAA | |||
| Methylation‐specific PCR (MSP) | ||||
| Methylated C‐promoter | M‐F | TAACGTTTTATTTGGGAGGAGC | 174 | |
| M‐R | AACAAAACGTAATTAATCCCGC | |||
| Unmethylated C‐promoter | U‐F | GAATAATGTTTTATTTGGGAGGAGT | 176 | |
| U‐R | AAACAAAACATAATTAATCCCACCC | |||
cDNA synthesis and quantitative RT‐PCR (qRT‐PCR)
Total RNA from 89 brush and 38 biopsy specimens were treated with DNase I (RQ1 RNase‐free DNase, Promega) and precipitated before being used as a template to synthesize cDNA. All necessary reagents for gene‐specific cDNA synthesis prior to quantitative (q)PCR including the protocol using a multi‐primed approach have been described previously.46 Of overall samples, 23 NP brushes and 2 biopsies, were excluded for further DNA/RNA analysis respectively, due to insufficient RNA quality, high genomic EBV DNA contamination in cDNA (insufficient RNA purity) or low EBV DNA per cell (limited number of tumor cells), leading to low EBER and/or negative BART and other latent transcripts.
Sixty‐three out of 76 NP brushes from NPC patients, three out of five NP brushes from other head and neck malignancies, 33 out of 35 parallel frozen NPC biopsies, and three non‐NPC frozen biopsies were tested for complete EBV expression profiling using a quantitative multi‐primed real time LC480 Reverse Transcription (RT)‐PCR. Absolute quantification of EBV RNA profiles of eight EBV latent (EBER1, BART, E1QK, EBNA2, LMP1, LMP2A, BARF1) and five lytic genes, consisting of the immediate early, early and late genes Zebra, Rta, PK,TK, VCAp18, was performed with a plasmid calibration for each single target as described elsewhere (Table 1).46, 48 Real time LC‐PCR reagents were purchased from Roche Diagnostics (Almere, The Netherlands). The qRT‐PCR quantified specific cDNA relative to a well‐validated plasmid pool containing all selected EBV latent and lytic genes in serial 1:2 dilutions in the same LC‐PCR run, including the use of appropriate positive and negative controls. Amplicon length (ranging from 140 to 270 bp) and reproducibility were carefully examined by agarose gel electrophoresis. A transcript with a specific melting temperature as defined by a standardized plasmid and its level above the detection limit in qRT‐PCR assay (800 copies per NP brush and 320 copies per ml Trizol NPC biopsy extract) was determined as positive. Furthermore, a transcript with a specific melting temperature yet having a very low expression level was identified as positive but unquantifiable.
As control for EBV RNA profiling each PCR amplification included cDNA prepared from RNA extracts of EBV‐positive cell lines (C666.1 or Namalwa) and RNA‐free water as a negative control. Control for integrity and stability of the stored RNA was performed by quantifying the absolute amount of human U1A housekeeping gene in each sample (values >107 copies/brush or biopsy were considered valid). The level of U1A transcripts was also used for RNA level normalization in addition to EBV BART mRNA which was defined as EBV‐specific housekeeping transcript. Negligible signal contribution from experimental artifacts such as primer dimers and left‐over genomic DNA in remaining RNA materials after DNAse treatment (defined by EBNA1 LC‐PCR) were critically corrected in order to assure accuracy for viral gene expression analysis. The amount of each EBV transcript per sample was expressed as amount of copies per brush in NP brushings or amount of copies per ml Trizol (per biopsy) in biopsies. The level of each transcript should be >2‐fold higher than the amount of cDNA genome. Normalization was also done against the viral DNA load to estimate the amount of each transcript per EBV genome.
EBV serology
Paired serum samples available for 63 NPC patients were analysed for IgA antibodies against EBV‐specific immunodominant epitopes of EBNA1, VCAp18 and Zebra using synthetic peptide‐based ELISA assays as detailed by us previously.25, 49, 50 The cutoff value (CoV) was defined as mean optical density (OD450) value of 20 healthy regional controls + 2× standard deviation.49, 50 The IgA‐ELISA CoV for EBNA1, Zebra and VCA‐p18 was 0,17, 0,28 and 0.35 OD450 units, respectively. All sera above CoV were considered positive.
Bisulfide modification and qualitative methylation‐specific PCR (MSP)
The methylation status of the C‐promoter (Cp) EBV‐DNA in paired brush‐biopsyspecimens was investigated by qualitative methylation‐specific PCR (MSP) analysis asdescribed previously.43, 51 Bisulfite‐modified DNA was amplified by two primer pairs specific for unmethylated (U) and methylated (M) Cp sequences at nucleotide positions 11041–11217 according to EBV B95.8 genome (GenBank: V01555.2. Table 1). EBV‐negative BJAB cell line with 10 ng virion DNA and used as a positive control and RNA‐free water as a negative control, respectively. Ten microliters of MSP product were analyzed on a 2% agarose gel.
Statistical analysis
Statistical analysis was executed by the SPSS version 16.0 (SPSS Inc.) and GraphPad Prism 6.0 (GraphPad Software, Inc., La Jolla, California, USA). EBV DNA values between the patient and control groups and the positive rates of individual EBV gene transcripts were compared by using the Mann‐Whitney test and Pearson correlation test. Linear regression was used to correlate the number of lytic transcripts with (a) the amount of EBV genome in NPC tumor biopsy and (b) level of EBV‐IgA antibody response. A p values below 0.05 was considered to be significant.
Results
We aimed to characterize EBV DNA and RNA markers in frozen NPC tumor tissue and matching NP brushings, that presumably contain material of the tumor surface. Paired NP brush‐biopsy specimens were collected prospectively from 33 patients suspected of having NPC, that were subsequently confirmed by pathological examination.37 Clinicopathological features and molecular analysis confirmed NPC presence which allowed us to perform a complete EBV DNA and RNA analysis. The clinical characteristics of 33 NPC patients with EBV markers in paired biopsy‐brush specimens are summarized in Table 2.
Table 2.
Clinical characteristics of 33 NPC patients with EBV markers in paired biopsy‐brush specimens
| ID | Age (years) | Gender | AJCC/UICC TNM status | AJCC/UICC tumor stage | EBV‐IgA ELISA | EBV DNA load (105) | Methylation status | ||||
|---|---|---|---|---|---|---|---|---|---|---|---|
| IgA‐EBNA1 | IgA‐VCAp18 | Copies/biopsy | Copies/brush | Copies/ml blood | Brush | Biopsy | |||||
| 1 | 36 | Male | T3N0M0 | 3 | 4.3 | 5.0 | 32.0 | 6.9 | 0.0 | M | M |
| 2 | 48 | Male | T3N1M0 | 3 | ND | ND | 201.0 | 20.4 | 0.0 | M | M |
| 3 | 23 | Female | T2N2M0 | 3 | 2.7 | 1.3 | 837.0 | 257.6 | 0.2 | M | M |
| 4 | 25 | Male | T2N1M0 | 2 | 2.5 | 8.0 | 100.4 | 36.2 | 0.1 | M | M |
| 5 | 48 | Female | T3N0M0 | 3 | 13.8 | 4.3 | 3.5 | 152.0 | 0.0 | M | M |
| 6 | 36 | Female | T1N1M0 | 2 | 8.8 | 4.3 | 2.5 | 57.8 | 0.2 | M | M |
| 7 | 46 | Male | T1N3M0 | 4B | 0.8 | 13.1 | 0.9 | 117.9 | 0.1 | M | M |
| 8 | 55 | Female | T3N1M0 | 3 | 6.9 | 7.9 | 495.0 | 22.7 | 0.0 | M | M |
| 9 | 28 | Male | T4N3M0 | 4B | 20.0 | 0.7 | 209.0 | 324.0 | 0.0 | M | M |
| 10 | 56 | Male | T2N2M0 | 3 | 8.2 | 4.2 | 0.7 | 623.2 | 0.0 | M | M |
| 11 | 45 | Male | T2N0M0 | 2 | 1.1 | 1.3 | 964.0 | 129.1 | 0.0 | M | M |
| 12 | 44 | Male | T3N1M0 | 3 | 29.1 | 5.4 | 262.0 | 1183.2 | 0.1 | M | M |
| 13 | 49 | Male | T2N1M0 | 2 | 1.8 | 1.2 | 28.7 | 74.6 | 0.0 | M | M |
| 14 | 44 | Male | T2N3M0 | 4B | 6.3 | 8.9 | 5.4 | 571.2 | 0.0 | M | M |
| 15 | 52 | Male | T4N3M0 | 4B | 6.9 | 2.5 | 0.5 | 1089.6 | 0.0 | M | M |
| 16 | 35 | Male | T2N3M0 | 4B | 11.8 | 21.6 | 566.0 | 924.8 | 0.9 | M | M |
| 17 | 33 | Male | T4N3M1 | 4C | 0.8 | 1.5 | 140.0 | 4216.0 | 0.6 | M | M |
| 18 | 45 | Female | T2N2M0 | 3 | 2.9 | 1.6 | 2.0 | 372.8 | 0.1 | M | M |
| 19 | 63 | Male | T4N0M1 | 4C | 4.2 | 1.3 | 199.0 | 108.3 | 0.0 | M | M |
| 20 | 47 | Female | T4N1M0 | 4A | 1.2 | 0.9 | 87.6 | 547.2 | 0.0 | M | M |
| 21 | 61 | Male | T2N0M0 | 2 | 2.8 | 1.8 | 872.0 | 57.5 | 0.0 | M | M |
| 22 | 32 | Male | T4N3M1 | 4C | 1.2 | 27.7 | 28.0 | 270.4 | 0.3 | M | M |
| 23 | 51 | Male | T1N0M0 | 1 | 2.1 | 1.1 | 3.2 | 34.9 | 0.0 | M | M |
| 24 | 55 | Male | T2N3M0 | 4B | 1.8 | 7.7 | 22.7 | 3416.0 | 0.9 | M | M |
| 25 | 55 | Female | T4N3M0 | 4B | 5.2 | 9.7 | 59.1 | 280.8 | 0.4 | (U) + M | M |
| 26 | 31 | Male | T2N2M0 | 3 | 1.9 | 8.6 | 89.4 | 105.1 | 0.0 | M | M |
| 27 | 31 | Male | T4N1M0 | 4A | 3.2 | 11.5 | 127.4 | 1612.8 | 0.0 | (U) + M | M |
| 28 | 43 | Male | T4N3M1 | 4C | 10.3 | 27.7 | 7.2 | 612.8 | 0.8 | M | M |
| 29 | 43 | Female | T4N3M0 | 4B | 4.9 | 7.7 | 6.8 | 69.7 | 0.5 | M | M |
| 30 | 36 | Male | T3N2M0 | 3 | ND | ND | 226.6 | 304.0 | 0.1 | M | M |
| 31 | 50 | Male | T2N3M0 | 4B | 4.5 | 6.9 | 891.0 | 571.2 | 0.0 | (U) + M | M |
| 32 | 32 | Male | T4N3M0 | 4B | 3.4 | 5.4 | 40.9 | 166.4 | 0.1 | M | M |
| 33 | 45 | Female | T3N2M0 | 3 | ND | ND | 3.8 | 69.8 | 0.7 | M | M |
EBV DNA load in NP brushings and corresponding frozen biopsies
Figure 1 a shows that NP brushings obtained from confirmed NPC patients at primary diagnosis (n = 76) are 100% positive for EBV DNA at levels above the CoV compared to non‐NPC controls (n = 13) (median NPC: 1.0x10⁷; range 4.0 × 10³ ‐ 4.2 × 10⁸ vs. median controls: 1.3 × 10³; range 0–6.3 × 10³, respectively (Mann‐Whitney test; p < 0.0001). We detected similarly high EBV DNA loads in corresponding fresh‐frozen NPC biopsy sections (n = 33; median, 5.9 × 10⁶; range 4.7 × 10⁴ to 9.6 × 10⁷) which agrees with data presented in previous studies.35, 36, 37, 38
Figure 1.
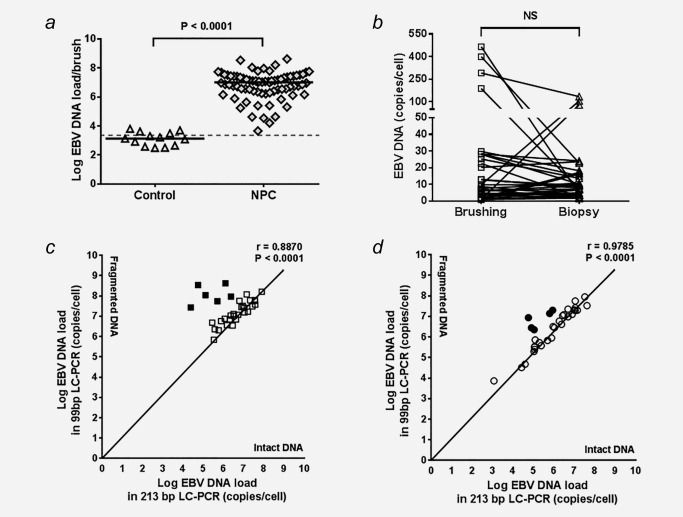
Epstein–Barr virus (EBV) DNA loads in nasopharyngeal (NP) brushings and biopsies of NPC patients. (a) A significant higher EBV DNA load was observed in NP brushing obtained from NPC patients (p < 0.0001), compared to healthy and non‐NPC controls. (b) No significant difference between NP brushing and biopsy was observed in amount of EBV genome per cell detected in 33 paired NPC samples, indicating that NP brush sampling was a reliable method. Comparison of intact and fragmented DNA in paired brush‐biopsy specimen as determined by the 213‐bp and 99‐bp EBV LC‐PCR shows that most of DNA obtained from NPC tumor seems to remain intact despite having fragmented DNA in six cases. (c) 27 out of 33 NP brushings and (d) 27 out of 33 paired biopsies obtained from NPC patients show intact DNA, respectively (Pearson correlation, p < 0.0001).
Next, we quantified the EBV genomes per cell in paired samples from 33 NPC patients by normalizing the EBV viral load to the cellular human β‐globin DNA load. The results show that the number of EBV genomes per cell in most of these paired samples is comparable between patients (<30 copies per cell; Wilcoxon t test; NS), with the exception of a few samples that seem to contain >50 copies per cell in either brushing or biopsy (Fig. 1 b). In order to define whether these high numbers represent intact EBV genomic DNA from tumor cells or chromosomal DNA fragmentation of tumor cells undergo apoptosis we performed a comparative EBV‐DNA PCR analysis.25 The results revealed the presence of intact EBV DNA in 27 (82%) of the 33 paired samples (Pearson correlation r = 0.8870 for brushing and r = 0.9785 for biopsy; p < 0.0001). In four (12%) paired brush‐biopsy samples, as well as in other two (6%) individual brushings and two (6%) individual biopsies, we detected higher levels of fragmented DNA that may indicate an apoptotic origin (Figs. 1 c and 1 d). Parallel analysis of EBV‐DNA load in corresponding whole blood samples of these four “high load” paired cases did not reveal high levels of circulating EBV DNA genomes or DNA fragments, suggesting apoptotic extrusion rather than internal apoptotic release into the blood (data not shown).
EBV RNA profile in NP brushings corresponds to the latency II profile in biopsies
It is generally considered that NPC tumor cells express an EBV latency type‐II profile, although sporadic lytic transcripts have been detected as well3, 11, 12, 16, 17 To confirm NP brushing as a valid diagnostic tool for NPC, it is important to show the pattern of EBV gene expression in upper and adjoining layers of the tumor collected by NP brushing is similar to the pattern of EBV RNA profile in a deep location of the tumor taken by a biopsy (Fig. 2). Patterns of observed viral gene expression in paired NPC brushings and biopsies are depicted in Figure 2 and Table 3.
Figure 2.
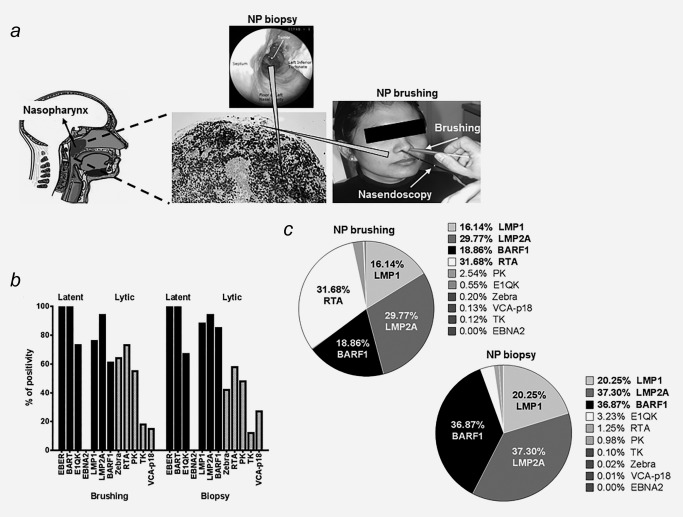
EBV gene expression in NP brushing and biopsy of NPC tumor. (a) Schematic presentation of specimen collection by brush (scratching the surface of the tumor and upper mucosa) and biopsy (removal deep tissue of suspected tumor) with nasal endoscopic guidance. (b) Positive detection rates of EBV latent and lytic transcripts in 33 paired brush‐biopsy specimens obtained from NPC patients. p‐values of each EBV transcripts are depicted in Table 3. (c) Percentage of EBV latent‐lytic transcripts levels relative to BART RNAs in paired 33 brush‐biopsy specimens. Parallel brush‐biopsy samples show similar pattern of LMP1, LMP2A and BARF1 mRNA expression levels, whereas Rta mRNA is more abundant in brushings compared to biopsy samples.
Table 3.
Detection of 12 EBV‐related genes in paired brush‐biopsy samples
| Positive cases | Positive cases of paired NPC (n = 33) | Median transcript | |||||
|---|---|---|---|---|---|---|---|
| Gene | NPC brushing n/n (%) | Brushing (%) | Biopsy (%) | p values | Positive brushing | Positive biopsy | p values |
| EBER1 | 63/63 (100) | 33/33 (100) | 33/33 (100) | – | 9.15e+07 | 2.45e+09 | – |
| BART | 63/63 (100) | 33/33 (100) | 33/33 (100) | – | 5.26e+05 | 5.54e+05 | – |
| EBNA1QK | 41/63 (65) | 24/33 (73) | 21/33 (64) | 0.8469 | 38.60 | 29.14 | 0.3119 |
| EBNA2 | 0/63 (0) | 0/33 (0) | 0/33 (0) | – | – | – | – |
| LMP1 | 51/63 (81) | 25/33 (76) | 29/33 (88) | 0.7166 | 1.43 | 2.29 | 0.3186 |
| LMP2A | 56/63 (89) | 31/33 (94) | 31/33 (94) | 1.0000 | 1.58 | 2.50 | 0.1232 |
| BARF1 | 48/63 (76) | 20/33 (61) | 28/33 (85) | 0.4482 | 5.76 | 1.51 | 0.0007* |
| Zebra | 32/63 (51) | 17/33 (52) | 14/33 (42) | 0.6704 | 10.39 | 15.01 | 0.6749 |
| RTA | 46/63 (73) | 24/33 (73) | 19/33 (58) | 0.5636 | 5.21 | 3.11 | 0.7879 |
| PK | 42/63 (67) | 18/33 (55) | 16/33 (48) | 0.8347 | 34.98 | 27.57 | 0.8417 |
| TK | 14/63 (22) | 6/33 (18) | 4/33 (12) | 0.7371 | 74.21 | 136.30 | 0.8952 |
| VCA‐p18 | 18/63 (29) | 5/33 (15) | 9/33 (27) | 0.3881 | 88.15 | 185.50 | 0.7888 |
Positive RNA detection ratio in comparison to EBER1 and BARTs RNA presence (100%).
p‐values of positive rates in paired brush‐biopsy specimens were obtained by using Fisher's Exact test.
p‐values for the level of positive transcript compared to the level of BART RNAs were obtained by using Mann‐Whitney test.
p values < 0.05 were considered statistically significant (*).
Complete EBV latent RNA transcripts (EBER1, BART, EBNA1, LMP1, LMP2A and BARF1) were detected in 20 out of 33 (61%) paired NPC specimens (Table 3). Quantitatively, latency transcripts for LMP1, LMP2 and BARF1 prevailed in both biopsies and brusings (Figs. 2 b and 2 c). EBNA2 transcripts could not be detected in any of NPC cases. In a subgroup of paired samples (4 to 24 out of 33 samples, depending on the transcript) additional lytic genes were detectable with immediate early and early genes (42–64% for Zebra, 58–73% for Rta and 48–55% for PK) found more frequent than other lytic markers (12–18% for TK and 15–27% for VCA‐p18, respectively). Samples with substantially elevated EBV genome levels (>106 copies per brush or per biopsy) tended to reveal qualitatively more broad viral gene expression compared to samples with low viral load (data not shown). We conclude that EBV RNA profile in NP brushings corresponds to the latency II profile in biopsies, with additional limited (abortive) lytic gene expression.
EBV RNA quantification in NP brushings resembles mRNA profiles of NPC tumor biopsies
EBER1 and BART transcripts were robustly detected in both 100% of the NP brush and biopsy samples. As expected, EBER transcripts are extremely abundant (median EBER1 copy numbers: 9.15 × 10⁷ in brushings and 2.45 × 10⁹ in biopsies) and similar to the cellular U1A transcript levels (median U1A: 6.73 × 10⁸ in brushings and 6.69 × 10⁷ in biopsies). Moreover, the BART RNA levels were equal to the levels of the majority of latency type‐II (LMP1, LMP2A, BARF1) transcripts (median BART: 4.75 × 10⁵ in brushings and 5.54 × 10⁵ in biopsies, respectively).
When we normalized viral mRNA expression in NPC biopsies and NP brushings to the amount of human housekeeping U1A mRNA, we calculated extremely low levels of all viral transcripts per cell. This is best explained by a low tumor/non‐tumor cell ratio in the samples (leukocyte infiltrate, stroma), typically for undifferentiated NPC. To better judge and compare the viral component between the NPC samples we also to normalized for EBV‐infected (tumor) cells using BART RNA levels. BART is considered an EBV housekeeping transcript in latency II‐infected cells and was detected in 100% of NPC cases reflecting tumor origin (Figs. 3a–3 c). We also defined the level of EBV gene expression per EBV DNA genome in each sample (Figs. 3 d–3 f).
Figure 3.
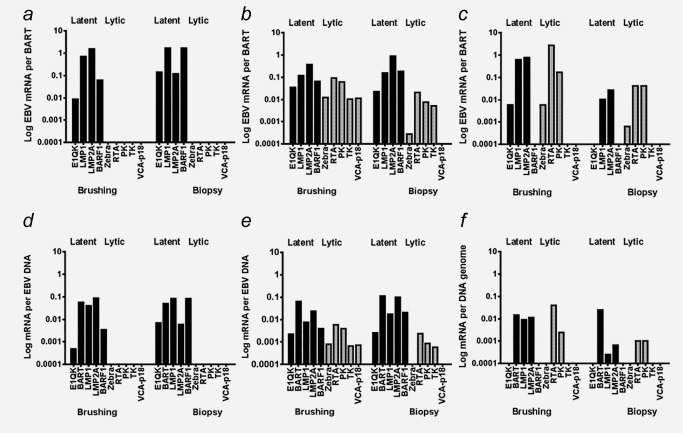
Expression of EBV gene profiles observed in brush‐biopsy pairs of NPC patients relative to BART RNAs (a,b,c) and EBV genome (d.e,f) were categorized into three groups respectively. The groups consist of (a, d) truly latent/persistent infection with only latent genes (three or more) have been expressed in high levels, (b, e) sporadic lytic infection with the expression of latent and three or more lytic (immediate early, early and late) transcripts were detectable in biopsies and the corresponding brushings, and (c, f) abortive lytic reactivation with both latent and lytic genes have been expressed, however only EBV immediate early and early lytic genes, but no late VCAp18 mRNA.
The transcriptional diversity in NPC EBV gene profiles in paired NPC specimens is illustrated by categorization of three groups based on expression type and level of genes; i.e. (I) latent/persistent infection, (II) sporadic lytic infection and (III) abortive lytic reactivation. Overall, parallel brushings and biopsies showed highly similar pattern of mRNA expression levels. Abortive EBV reactivation is sporadically seen in the surface of the tumor represented by the brushing (Fig. 2 c). We did not detect any lytic transcripts in five out of 33 of total paired samples, arbitrarily defined as group I. These however expressed high levels of at least three latent genes (commonly expressed LMP1 and LMP2A mRNA at 10–1000 copies, whereas per BARF1 mRNA at 1–1000 copies per 100 copies BART mRNA) in both biopsy and paired brushing (representative cases shown in Figs. 3 a and 3 d). These findings are in agreement with a previous independent study.36 By comparison, E1QK mRNA, representing Qp driven EBNA1 transcripts, was less frequently detected in paired brush‐biopsy samples and mostly present at very low expression levels (0.01–10 copies E1QK per 100 copies BART mRNA).
The second (II) group, showed expression of EBV lytic transcripts in both brushings and biopsies representing 13 out of 33 of the samples (representative cases shown in Figs. 3 b and 3 e). In these 12 samples, 3 or more lytic transcripts were detectable in biopsies and the corresponding brushings. However, the levels of EBV lytic mRNA markers (Zebra, Rta, PK, TK, VCAp18) were generally much lower (10–1000 fold; i.e., 0.01–1 copies per 100 copies BART mRNA) than the levels of EBV latent genes (EBNA1QK, LMP1, LMP2A, BARF1) in the same sample. The late‐lytic EBV transcript, VCAp18 mRNA, was barely expressed in NPC biopsies, suggesting that the full lytic EBV cycle is activated only sporadically.
In the third (III) group, 15 out of 33 samples, we detected EBV immediate early and early lytic gene expression, in the absence of late EBV lytic VCAp18 mRNA. Specifically we detected the presence Zebra and/or Rta, and PK with or without TK gene expression in both biopsy and paired brush sample (Figs. 3 c and 3 f). Similar with the second (II) group, levels of Zebra, Rta, PK or TK varied between 0.01–100 copies per 100 BART mRNA copies. Most brushings in this group had limited Zebra expression, but revealed higher levels of Rta mRNA ranging from 10–1000 copies per 100 copies BART mRNA. Rta mRNA is more frequently detected (12/15) and present at higher levels compared to Zebra mRNA (8/15). Because in this group PK and TK were barely expressed and VCAp18 mRNA was absent, we conclude that the reactivation patterns reflect abortive (partial) viral reactivation. This comprehensive quantitative analysis strongly suggests that both latent and lytic transcript expression in NPC biopsies is represented equally and reliably in NP brushings.
EBV (sporadic) reactivation is poorly related to EBV DNA genome levels
It is postulated that physiological signals trigger EBV reactivation and increase oral shedding.5, 6, 9, 10, 12 We wonder whether the observed sporadic EBV lytic reactivation might cause high viral loads in the mucosal layer, as collected in the brushings. To this end we compared the presence and number of detectable EBV lytic transcripts to the amount of EBV DNA per cell in a total of 57 NP brushings and 27 parallel primary tumors (Fig. 4). Six samples containing high levels of fragmented DNA (Figs. 1 c and 1 d) were discarded for this analysis. Interestingly, the detection of lytic transcripts indeed positively correlated with the levels of EBV DNA (copy number per cell) in the NP brushings (Fig. 4 a), while this was not observed for the biopsies (Fig. 4 b). This observation suggests that the sporadic lytic events are localized to the surface of NPC tumors which are sampled in the NP brushing. However, because expression of immediate early and early genes (1–4 lytic transcripts in NP brushings and 1–3 lytic transcripts in biopsies) prevailed over the complete late lytic genes including VCA‐p18 (3–5 lytic transcripts), it remains unclear what cell type or types contribute to the EBV‐DNA signal. Overall these data indicate that the superficial layer of NPC may sustain an abortive reactivation in infected tumor cells rather than a full viral replication as seen in healthy epithelial cells lining secondary lymphoid tissues in the nasopharynx such as the tonsils. We conclude that the EBV genome copies measured in the NP brushings most likely represent extruding tumor cells with reactivating EBV captured in the mucosa that are then scraped from the tumor surface.
Figure 4.
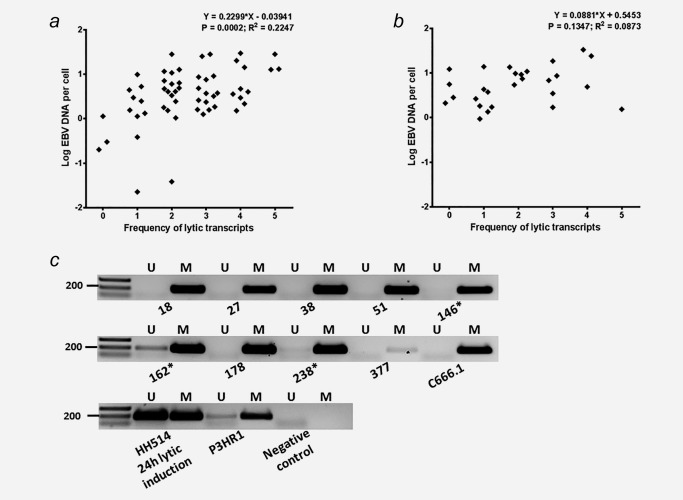
EBV (sporadic) reactivation in relation to EBV DNA genome level shows (a) a correlation trend in 57 NP brushings (Linear regression r = 0.2299 ± 0.0576; p = 0.0002), but (b) no significant correlation observed in parallel biopsies (Linear regression p = 0.1347). (c) All brush‐biopsy pairs reveal methylated EBV DNA at the latency‐associated C promoter (Cp) reflecting tumor origin (Table 2), whereas partly unmethylated Cp DNA is detected in only 3 NP brushings indicated by (*). Heavily methylated EBV genome of C666.1 cells, mixed methylated and unmethylated EBV DNA of lytically induced HH514 cells and partly unmethylated EBV genomes of P3HR1 cells were used as positive controls.
EBV genome in NP brushings is predominantly methylated
In order to distinguish non‐methylated EBV virion DNA from methylated tumor‐associated EBV DNA we then analysed the methylation status of the C promoter (Cp) region at nt 11041–11217 on the EBV genome in all 33 biopsies and paired NP brushings.3, 15, 19 We found methylated Cp DNA in 100% of the biopsy samples and only partially unmethylated Cp DNA in 3 NP brushings (Table 2, Fig. 4 c). The results are compatible with the tumor origin of EBV‐DNA in the NP‐brush specimens and indicate presence of only sporadic low level lytic replication in the superficial layers of some tumors, as collected with the NP brushing. No correlation was found between EBV‐DNA load and methylation status of EBV‐DNA (Table 2), eliminating viral lytic replication as source of EBV DNA and confirming the predominant tumor cell origin of DNA in the NP brushings.
EBV antibody responses is not correlated to EBV (sporadic/partial) reactivation
We hypothesized that reactivation of EBV lytic cycle gene expression within the NPC tumor milieu might stimulate mucosal antibody responses against immunodominant epitopes of the tumor‐released latent antigen (EBNA1) and the early plus late lytic cycle proteins (Zebra and VCA‐p18). Therefore we analyzed EBV antigen‐specific IgA seroreactivity by synthetic peptide‐based ELISA in 63 paired serum samples from NPC patients collected at primary intake in parallel to the NP‐brush and biopsy. All sera (100%) showed elevated IgA antibody responses above cutoff against EBNA1 and VCA‐p18. IgA‐EBNA1 antibody reactivity is unrelated to the presence and level of EBV latent gene expression (data not shown) or lytic gene expression in NP brushings (Fig. 5 a; Kruskal‐Wallis/Dunn's test, NS). IgA‐EBNA1 reactivity is also unrelated to the EBV DNA load in NP brushings (data not shown). Aberrant IgA antibodies to VCA‐p18 (Fig. 5 b), reflecting exposure to late lytic gene products of EBV was also unrelated to the presence and number of lytic transcripts in NP brushings (Kruskal‐Wallis/Dunn's test, NS), despite high levels of Zebra and Rta mRNA or high EBV genomes per cell equivalent being present in in some cases. Elevated IgA‐Zebra antibody levels were also detectable in most patients, but the level of IgA‐ZEBRA reactivity is neither related to the number of lytic transcripts in brushings nor to the expression level of immediate early genes Zebra and Rta (data not shown). Thus, overall the EBV IgA antibody responses are independent and quantitatively unrelated to local EBV reactivation as detectable in NPC brushings and biopsy tissues.
Figure 5.
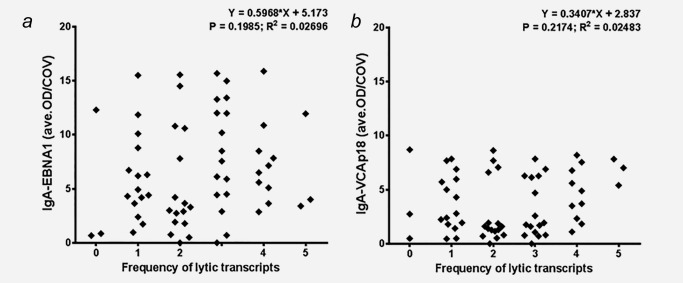
EBV (sporadic/partial) reactivation is unrelated to aberrant IgA antibodies either against (a) EBNA1 (Linear regression p = 0.1985) or (b) VCA‐p18 (Linear regression p = 0.2174), respectively.
Discussion
The NP brushing has been proposed as an alternative for the invasive and painful biopsy in detecting the presence of NPC at the primary site of tumor development.35, 36, 37, 38, 39, 40 NP brushings collected from NPC patients carry high levels of EBV DNA and carcinoma‐specific BARF1 mRNA reflecting the presence of viable tumor cells in the NP epithelium (Fig. 2 a).17, 35, 36, 41 Methylation analysis of defined cellular tumor suppressor genes can confirm the presence of tumor cells in NP‐brushings.3, 42, 43, 52 Furthermore, changes in brush EBV DNA levels directly reflect the tumor response to treatment and can be used to identify local recurrent disease.37, 40, 44 Our data confirm and extend previous studies revealing highly elevated EBV loads in NP swabs or brushings from NPC‐patients as compared to controls.35, 36, 37, 38, 39, 40 We found that the number of viral genomes per cell as well as the pattern of overall EBV latent and lytic gene expression profiles are comparable in parallel brush‐biopsy specimens, confirming the diagnostic value of NP‐brushings.3, 36
Prior molecular analysis of NPC tumor biopsies mainly revealed EBV gene products reflecting the latency type‐II transcription profile with no or limited viral lytic activity.3, 11, 16, 17, 53 Some EBV infected tumor cells may express lytic gene products sporadically due to epithelial cell differentiation leading to either full or abortive viral reactivation, which remains to be defined.9, 10, 11, 12, 13 In this study we analysed multiple EBV genes reflecting latent and lytic viral activity in NP brushing and biopsy specimens, sampled under nasendoscopic guidance during primary diagnostic assessment at the site of suspected NPC presence. Both NPC brush and biopsy samples revealed abundant EBV latency‐II gene transcripts, without EBNA2 mRNA (Figs. 2, 3).
Quantitative EBV transcript profiling revealed that LMP1, LMP2A and BARF1 mRNAs are most prevalent in up to 80% of cases in both brush and biopsy samples, consistent with prior reports.3, 16, 17, 52, 53 We recently confirmed that BARF1 also acts as early lytic transcript, activated by Rta.54 BARF1 mRNA is prevalent in overall brush‐biopsy samples irrespective of lytic gene expression, reflecting its character as latent transcript (Figs. 2, 3). Rta mRNA is expressed particularly in NP brushings (Fig. 2 c), reflecting initiation of lytic cycle in superficial tumor cells protruding into the mucosal layer, possibly enhancing BARF1 expression above the existing latency level (Figs. 2, 3 and Table 3). Therefore, we conclude that BARF1 mRNA mainly is a latency‐associated gene product in NPC and forms a suitable NPC marker, as suggested before.17, 36 The high and stable expression of BARTs in NPC biopsies and brushings is consistent with prior data and classifies the BART transcript as EBV housekeeping gene, suitable for internal EBV‐specific normalization of RNA profiles.34, 53, 55, 56 Relative to BART RNA levels, EBV latency‐II transcripts prevail over immediate early and early lytic transcripts (Fig. 2 c). Late lytic transcripts are present sporadically and only at low level, reflecting limited and mostly abortive viral replication in the mucosal tumor surface.
Profiling of EBV lytic infection in NP brushings showed a more heterogeneous pattern than previously appreciated. The higher frequency of (immediate) early mRNAs, and the low level or absence of late lytic transcripts in most samples suggest that the majority of EBV reactivations may be defective (abortive reactivation). Lack of full virion production is strongly confirmed by the absence of unmethylated virion DNA in all biopsies and brushings except 3 brush samples showing partially unmethylated DNA (Table 2, Fig. 4 c). The cases with extremely high copy number of EBV genomes per cell in brush and biopsy may reflect accumulation of apoptotic fragments shed from mucosal epithelial cells, involving a unique cellular mechanism called epithelial extrusion.57 Epithelial cell migration is induced by LMP1 and dying cells may be extruded during NPC tumorigenesis. However whether a high level of fragmented EBV DNA in NP brushings is related to epithelial extrusion remains unknown.58, 59
Highly abundant viral DNA content in NP brushings is considered to derive from tumor cells collected at the site of primary tumor formation. Alternatively, viral DNA may derive from new virions produced by latently infected tumor cells undergoing EBV replication switch at superficial mucosal epithelia. In healthy EBV carriers, the virus reactivates in the oropharynx, continuously releasing virions into the saliva, even in the absence of circulating B cells.5, 6, 20 The role of oro‐/nasopharyngeal epithelial cells in EBV lytic infection is controversial except in rare conditions such as Oral Hairy Leukoplakia where productive EBV replication occurs in the superficial differentiating epithelial layers.21, 22, 23 The predominance of methylated EBV Cp‐DNA sequences in NP brushings, supports the notion that EBV DNA in the brush originates from tumor cells expelled into the NP mucosal layers, rather than from locally produced virions (Table 2, Fig. 4 c).
Fragmented EBV DNA derived from apoptotic tumor cells is also considered to disperse into the peripheral blood as detected in many but not all NPC patients.24, 25 Intact (infectious) virions and full length viral genomes are not detected in the circulation of NPC patients. Our data indicate that latent, abortive or full lytic EBV gene expression profile in either biopsy or NP brushing of the same patient are not related to the viral loads (Fig. 4) nor to circulating anti EBV‐IgA antibody levels (Fig. 5). This suggests that EBV‐IgA responses are triggered by viral replicative events outside the tumor tissue preceding and progressing in parallel with tumor formation. This is in line with the observation that elevated VCA‐IgA levels are generally present prior to appearance of a detectable tumor mass.
Previously we and others showed that the molecular diversity of EBV‐reactive IgG and IgA responses varies greatly among NPC patients, reflecting heterogeneous EBV antigen exposure during NPC development.26, 27, 28, 29, 30 We suggest that VCA‐IgA reactivity reflects loco‐regional virus replication events outside the initiating tumor mass, potentially contributing to tumor initiation by providing infectious EBV to infect susceptible cells capable of maintaining the viral genome, as recently identified.60, 61 Recently, the combination of EBV IgA serology with EBV‐DNA load analysis in NP brushings has been proposed as preferred method for population screening programs to identify early stage NPC.36, 38, 39, 40
Whether active virus replication also occurs in sporadic malignant epithelial cells or in submucosal lymphoid cells remains unclear since histochemical staining failed to reveal a cellular niche of local lytic producer cells.12, 19 The exact location of epithelial cells as the natural site of viral replication in the oro‐nasopharyngeal region remains unanswered. The data in this study confirm the validity of using NP brushing to assess aberrant EBV biomarkers reflecting NPC presence and activity at the site of tumor initiation.
Conclusions
NP brushing may provide an effective and practical minimal invasive tool for NPC diagnosis, with EBV providing valid tumor markers in the form of viral DNA load or specific RNA. These findings may encourage the transfer of NP brush based diagnostics to the clinic.
Acknowledgements
The authors thank Zendy Dharma for EBER‐RISH staining and providing the image of NPC tissue. They thank Tamarah de Jong and Joyce Lubbers for critical discussion on data analysis.
References
- 1. Chang ET, Adami HO. The enigmatic epidemiology of nasopharyngeal carcinoma. Cancer Epidemiol Biomarkers Prev 2006; 15:1765–77. [DOI] [PubMed] [Google Scholar]
- 2. Adham M, Kurniawan AN, Muhtadi AI, et al. Nasopharyngeal carcinoma in Indonesia: epidemiology, incidence, signs, and symptoms at presentation. Chin J Cancer 2012; 31:185–96. [DOI] [PMC free article] [PubMed] [Google Scholar]
- 3. Tao Q, Chan AT. Nasopharyngeal carcinoma: molecular pathogenesis and therapeutic developments. Expert Rev Mol Med 2007; 9:1–24. [DOI] [PubMed] [Google Scholar]
- 4. Hochberg D, Middeldorp JM, Catalina M, et al. Demonstration of the Burkitt's lymphoma Epstein‐Barr virus phenotype in dividing latently infected memory cells in vivo. Proc Natl Acad Sci U S A 2004; 101:239–44. [DOI] [PMC free article] [PubMed] [Google Scholar]
- 5. Hadinoto V, Shapiro M, Sun CC, et al. The dynamics of EBV shedding implicate a central role for epithelial cells in amplifying viral output. PLoS Pathog 2009; 5:e1000496 [DOI] [PMC free article] [PubMed] [Google Scholar]
- 6. Perera RA, Samaranayake LP, Tsang CS. Shedding dynamics of Epstein‐Barr virus: a type 1 carcinogen. Arch Oral Biol 2010; 55:639–47. [DOI] [PubMed] [Google Scholar]
- 7. Pegtel DM, Middeldorp J, Thorley‐Lawson DA. Epstein‐Barr virus infection in ex vivo tonsil epithelial cell cultures of asymptomatic carriers. J Virol 2004; 78:12613–24. [DOI] [PMC free article] [PubMed] [Google Scholar]
- 8. Hudnall SD, Ge Y, Wei L, et al. Distribution and phenotype of Epstein‐Barr virus‐infected cells in human pharyngeal tonsils. Mod Pathol 2005; 18:519–27. [DOI] [PubMed] [Google Scholar]
- 9. Reusch JA, Nawandar DM, Wright KL, et al. Cellular differentiation regulator BLIMP1 induces Epstein‐Barr virus lytic reactivation in epithelial and B cells by activating transcription from both the R and Z promoters. J Virol 2015; 89:1731–43. [DOI] [PMC free article] [PubMed] [Google Scholar]
- 10. Nawandar DM, Wang A, Makielski K, et al. Differentiation‐dependent KLF4 expression promotes lytic Epstein‐Barr virus Infection in epithelial cells. PLoS Pathog 2015; 11:e1005195 [DOI] [PMC free article] [PubMed] [Google Scholar]
- 11. Martel‐Renoir D, Grunewald V, Touitou R, et al. Qualitative analysis of the expression of Epstein‐Barr virus lytic genes in nasopharyngeal carcinoma biopsies. J Gen Virol 1995; 76:1401–8. [DOI] [PubMed] [Google Scholar]
- 12. Zhang JX, Chen HL, Zong YS, et al. Epstein‐Barr virus expression within keratinizing nasopharyngeal carcinoma. J Med Virol 1998; 55:227–33. [DOI] [PubMed] [Google Scholar]
- 13. Shannon‐Lowe C, Adland E, Bell AI, et al. M, Features distinguishing Epstein‐Barr virus infections of epithelial cells and B cells: viral genome expression, genome maintenance, and genome amplification. J Virol 2009; 83:7749–60. [DOI] [PMC free article] [PubMed] [Google Scholar]
- 14. Kalla M, Hammerschmidt W. Human B cells on their route to latent infection–early but transient expression of lytic genes of Epstein‐Barr virus. Eur J Cell Biol 2012; 91:65–9. [DOI] [PubMed] [Google Scholar]
- 15. Woellmer A, Hammerschmidt W. Epstein‐Barr virus and host cell methylation: regulation of latency, replication and virus reactivation. Curr Opin Virol 2013; 3:260–5. [DOI] [PMC free article] [PubMed] [Google Scholar]
- 16. Brooks L, Yao QY, Rickinson AB, et al. Epstein‐Barr virus latent gene transcription in nasopharyngeal carcinoma cells: co‐expression of EBNA1, LMP1, and LMP2 transcripts. J Virol 1992; 66:2689–97. [DOI] [PMC free article] [PubMed] [Google Scholar]
- 17. Seto E, Yang L, Middeldorp J, et al. Epstein‐Barr virus (EBV)‐encoded BARF1 gene is expressed in nasopharyngeal carcinoma and EBV‐associated gastric carcinoma tissues in the absence of lytic gene expression. J Med Virol 2005; 76:82–8. [DOI] [PubMed] [Google Scholar]
- 18. Cosmopoulos K, Pegtel M, Hawkins J, et al. Comprehensive profiling of Epstein‐Barr virus microRNAs in nasopharyngeal carcinoma. J Virol 2009; 83:2357–67. [DOI] [PMC free article] [PubMed] [Google Scholar]
- 19. Tao Q, Srivastava G, Chan AC, et al. Evidence for lytic infection by Epstein‐Barr virus in mucosal lymphocytes instead of nasopharyngeal epithelial cells in normal individuals. J Med Virol 1995; 45:71–7. [DOI] [PubMed] [Google Scholar]
- 20. Hoover SE, Kawada J, Wilson W, et al. Oropharyngeal shedding of Epstein‐Barr virus in the absence of circulating B cells. J Infect Dis 2008; 198:318–23. [DOI] [PMC free article] [PubMed] [Google Scholar]
- 21. Herrmann K, Frangou P, Middeldorp J, et al. G, Epstein‐Barr virus replication in tongue epithelial cells. J Gen Virol 2002; 83:2995–8. [DOI] [PubMed] [Google Scholar]
- 22. Frangou P, Buettner M, Niedobitek G. Epstein‐Barr virus (EBV) infection in epithelial cells in vivo: rare detection of EBV replication in tongue mucosa but not in salivary glands. J Infect Dis 2005; 191:238–42. [DOI] [PubMed] [Google Scholar]
- 23. Webster‐Cyriaque J, Middeldorp J, Raab‐Traub N. Hairy leukoplakia: an unusual combination of transforming and permissive Epstein‐Barr virus infections. J Virol 2000; 74:7610–8. [DOI] [PMC free article] [PubMed] [Google Scholar]
- 24. Chan KC, Zhang J, Chan AT, et al. YM, Molecular characterisation of circulating EBV DNA in the plasma of nasopharyngeal carcinoma and lymphoma patients. Cancer Res 2003; 63:2028–32. [PubMed] [Google Scholar]
- 25. Stevens SJ, Verkuijlen SA, Hariwiyanto B, et al. Diagnostic value of measuring Epstein‐Barr virus (EBV) DNA load and carcinoma‐specific viral mRNA in relation to anti‐EBV immunoglobulin A (IgA) and IgG antibody levels in blood of nasopharyngeal carcinoma patients from Indonesia. J Clin Microbiol 2005; 43:3066–73. [DOI] [PMC free article] [PubMed] [Google Scholar]
- 26. Cheng WM, Chan KH, Chen HL, et al. Assessing the risk of nasopharyngeal carcinoma on the basis of EBV antibody spectrum. Int J Cancer 2002; 97:489–92. [DOI] [PubMed] [Google Scholar]
- 27. Fachiroh J, Schouten T, Hariwiyanto B, et al. Molecular diversity of Epstein‐Barr virus IgG and IgA antibody responses in nasopharyngeal carcinoma: a comparison of Indonesian, Chinese, and European subjects. J Infect Dis 2004; 190:53–62. [DOI] [PubMed] [Google Scholar]
- 28. Chang C, Middeldorp J, Yu KJ, et al. Characterization of ELISA detection of broad‐spectrum anti‐Epstein‐Barr virus antibodies associated with nasopharyngeal carcinoma. J Med Virol 2013; 85:524–9. [DOI] [PMC free article] [PubMed] [Google Scholar]
- 29. Ji MF, Wang DK, Yu YL, et al. MH, Sustained elevation of Epstein‐Barr virus antibody levels preceding clinical onset of nasopharyngeal carcinoma. Br J Cancer 2007; 96:623–30. [DOI] [PMC free article] [PubMed] [Google Scholar]
- 30. Cao SM, Liu Z, Jia WH, et al. MH, Fluctuations of Epstein‐Barr virus serological antibodies and risk for nasopharyngeal carcinoma: a prospective screening study with a 20‐year follow‐up. PLoS One 2011; 6:e19100 [DOI] [PMC free article] [PubMed] [Google Scholar]
- 31. Liu Z, Ji MF, Huang QH, et al. Two Epstein‐Barr virus‐related serologic antibody tests in nasopharyngeal carcinoma screening: results from the initial phase of a cluster randomized controlled trial in Southern China. Am J Epidemiol 2013; 177:242–50. [DOI] [PubMed] [Google Scholar]
- 32. Hutajulu SH, Ng N, Jati BR, et al. Seroreactivity against Epstein‐Barr virus (EBV) among first‐degree relatives of sporadic EBV‐associated nasopharyngeal carcinoma in Indonesia. J Med Virol 2012; 84:768–76. [DOI] [PubMed] [Google Scholar]
- 33. Leung SF, Tam JS, Chan AT, et al. Improved accuracy of detection of nasopharyngeal carcinoma by combined application of circulating Epstein‐Barr virus DNA and anti‐Epstein‐Barr viral capsid antigen IgA antibody. Clin Chem 2004; 50:339–45. [DOI] [PubMed] [Google Scholar]
- 34. Ji MF, Huang QH, Yu X, et al. Evaluation of plasma Epstein‐Barr virus DNA load to distinguish nasopharyngeal carcinoma patients from healthy high‐risk populations in Southern China. Cancer 2014; 120:1353–60. [DOI] [PubMed] [Google Scholar]
- 35. Tune CE, Liavaag PG, Freeman JL, et al. Nasopharyngeal brush biopsies and detection of nasopharyngeal cancer in a high‐risk population. J Natl Cancer Inst 1999; 91:796–800. [DOI] [PubMed] [Google Scholar]
- 36. Stevens SJ, Verkuijlen SA, Hariwiyanto B, et al. Non‐invasive diagnosis of nasopharyngeal carcinoma: nasopharyngeal brushings reveal high Epstein‐Barr virus DNA load and carcinoma‐specific viral BARF1 mRNA. Int J Cancer 2006; 119:608–14. [DOI] [PubMed] [Google Scholar]
- 37. Adham M, Greijer AE, Verkuijlen SA, et al. Epstein‐Barr virus DNA load in nasopharyngeal brushings and whole blood in nasopharyngeal carcinoma patients before and after treatment. Clin Cancer Res 2013; 19:2175–86. [DOI] [PubMed] [Google Scholar]
- 38. Ng RH, Ngan R, Wei WI, et al. Trans‐oral brush biopsies and quantitative PCR for EBV DNA detection and screening of nasopharyngeal carcinoma. Otolaryngol Head Neck Surg 2014; 150:602–9. [DOI] [PubMed] [Google Scholar]
- 39. Chen Y, Zhao W, Lin L, et al. Nasopharyngeal Epstein‐Barr virus load: an efficient supplementary method for population‐based nasopharyngeal carcinoma screening. PLoS One 2015; 10:e0132669 [DOI] [PMC free article] [PubMed] [Google Scholar]
- 40. Zheng XH, Lu LX, Li XZ, et al. Quantification of EBV DNA load in nasopharyngeal brushing samples in the diagnosis of nasopharyngeal carcinoma in southern China. Cancer Sci 2015; 106:1196–201. [DOI] [PMC free article] [PubMed] [Google Scholar]
- 41. Jan YJ, Chen SJ, Wang J, et al. Liquid‐based cytology in diagnosing nasopharyngeal carcinoma. Am J Rhinol Allergy 2009; 23:422–5. [DOI] [PubMed] [Google Scholar]
- 42. Tong JH, Tsang RK, Lo KW, et al. Quantitative Epstein‐Barr virus DNA analysis and detection of gene promoter hypermethylation in nasopharyngeal (NP) brushing samples from patients with NP carcinoma. Clin Cancer Res 2002; 8:2612–9. [PubMed] [Google Scholar]
- 43. Hutajulu SH, Indrasari SR, Indrawati LP, et al. Epigenetic markers for early detection of nasopharyngeal carcinoma in a high risk population. Mol Cancer 2011; 10:48 [DOI] [PMC free article] [PubMed] [Google Scholar]
- 44. Stoker SD, Wildeman MA, Novalic Z, et al. Can Epstein‐Barr virus DNA load in nasopharyngeal brushings or whole blood predict recurrent nasopharyngeal carcinoma in a non‐endemic region? A prospective nationwide study of the Dutch Head and Neck Oncology Cooperative Group. Eur Arch Otorhinolaryngol 2016;273:1557–67. [DOI] [PubMed] [Google Scholar]
- 45. Stevens SJ, Verkuijlen SA, Middeldorp JM. Quantitative detection of Epstein‐Barr virus DNA in clinical specimens by rapid real‐time PCR targeting a highly conserved region of EBNA‐1. Methods Mol Biol 2005; 292:15–26. [DOI] [PubMed] [Google Scholar]
- 46. Stevens SJ, Brink AA, Middeldorp JM. Profiling of Epstein‐Barr virus latent RNA expression in clinical specimens by gene‐specific multiprimed cDNA synthesis and PCR. Methods Mol Biol 2005; 292:27–38. [DOI] [PubMed] [Google Scholar]
- 47. Hesselink AT, van den Brule AJ, Groothuismink ZM, et al. Comparison of three different PCR methods for quantifying human papillomavirus type 16 DNA in cervical scrape specimens. J Clin Microbiol 2005; 43:4868–71. [DOI] [PMC free article] [PubMed] [Google Scholar]
- 48. Wildeman MA, Novalic Z, Verkuijlen SA, et al. Cytolytic virus activation therapy for Epstein‐Barr virus‐driven tumors. Clin Cancer Res 2012; 18:5061–70. [DOI] [PubMed] [Google Scholar]
- 49. Fachiroh J, Paramita DK, Hariwiyanto B, et al. Single‐assay combination of Epstein‐Barr Virus (EBV) EBNA1‐ and viral capsid antigen‐p18‐derived synthetic peptides for measuring anti‐EBV immunoglobulin G (IgG) and IgA antibody levels in sera from nasopharyngeal carcinoma patients: options for field screening. J Clin Microbiol 2006; 44:1459–67. [DOI] [PMC free article] [PubMed] [Google Scholar]
- 50. Paramita DK, Fachiroh J, Haryana SM, et al. JM, Two‐step Epstein‐Barr virus immunoglobulin A enzyme‐linked immunosorbent assay system for serological screening and confirmation of nasopharyngeal carcinoma. Clin Vaccine Immunol 2009; 16:706–11. [DOI] [PMC free article] [PubMed] [Google Scholar]
- 51. Tao Q, Swinnen LJ, Yang J, et al. Methylation status of the Epstein‐Barr virus major latent promoter C in iatrogenic B cell lympho‐proliferative disease. A PCR‐based analysis. Am J Pathol 1999; 155:619–25. [DOI] [PMC free article] [PubMed] [Google Scholar]
- 52. Hu C, Wei W, Chen X, et al. A global view of the oncogenic landscape in nasopharyngeal carcinoma: an integrated analysis at the genetic and expression levels. PLoS One 2012; 7:e41055 [DOI] [PMC free article] [PubMed] [Google Scholar]
- 53. Bruce JP, Yip K, Bratman SV, et al. Nasopharyngeal Cancer: molecular Landscape. J Clin Oncol 2015; 33:3346–55. [DOI] [PubMed] [Google Scholar]
- 54. Hoebe EK, Wille C, Hopmans ES, et al. Epstein‐Barr virus transcription activator R upregulates BARF1 expression by direct binding to its promoter, independent of methylation. J Virol 2012; 86:11322–32. [DOI] [PMC free article] [PubMed] [Google Scholar]
- 55. van Beek J, Brink AA, Vervoort MB, et al. In vivo transcription of the Epstein‐Barr virus (EBV) BamHI‐A region without associated in vivo BARF0 protein expression in multiple EBV‐associated disorders. J Gen Virol 2003; 84:2647–59. [DOI] [PubMed] [Google Scholar]
- 56. Marquitz AR, Mathur A, Edwards RH, et al. Host gene expression is regulated by two types of noncoding RNAs transcribed from the Epstein‐Barr virus BamHI a rightward transcript region. J Virol 2015; 89:11256–68. [DOI] [PMC free article] [PubMed] [Google Scholar]
- 57. Andrade D, Rosenblatt J. Apoptotic regulation of epithelial cellular extrusion. Apoptosis 2011; 16:491–501. [DOI] [PMC free article] [PubMed] [Google Scholar]
- 58. Hogan C, Dupré‐Crochet S, Norman M, et al. Characterization of the interface between normal and transformed epithelial cells. Nat Cell Biol 2009; 11:460–7. [DOI] [PubMed] [Google Scholar]
- 59. Liu HP, Chen CC, Wu CC, et al. Epstein‐Barr virus‐encoded LMP1 interacts with FGD4 to activate Cdc42 and thereby promote migration of nasopharyngeal carcinoma cells. PLoS Pathog 2012; 8:e1002690 [DOI] [PMC free article] [PubMed] [Google Scholar]
- 60. Tsang CM, Yip YL, Lo KW, et al. Cyclin D1 overexpression supports stable EBV infection in nasopharyngeal epithelial cells. Proc Natl Acad Sci USA 2012; 109:3473–82. [DOI] [PMC free article] [PubMed] [Google Scholar]
- 61. Rac J, Haas F, Schumacher A, et al. Telomerase activity impacts on Epstein‐Barr virus infection of AGS cells. PLoS One 2015; 10:e0123645. [DOI] [PMC free article] [PubMed] [Google Scholar]