

Abstract
Aims
Treatment with glucagon‐like peptide (GLP)‐1 receptor agonists or dipeptidyl peptidase (DPP)‐4 inhibitors might increase gallstone formation; however, the mechanisms involved are unknown. We aimed to assess the effects of these drugs on gallbladder volume and bile acid profile.
Materials and methods
A total of 57 type 2 diabetes patients (mean ± SD age, 62.8 ± 6.9 years; BMI, 31.8 ± 4.1 kg/m2; HbA1c, 7.3% ± 0.6%), treated with metformin and/or sulfonylureas, were included in this 12‐week randomized, placebo‐controlled, double‐blind, single‐centre trial between July 2013 and August 2015 at the VU University Medical Center, the Netherlands. Patients received the GLP‐1 receptor agonist liraglutide, the DPP‐4 inhibitor sitagliptin or matching placebo for 12 weeks. Gallbladder fasting volume and ejection fraction were measured using ultrasonography after a high‐fat meal. Serum bile acids were measured in the fasting and postprandial state and in faecal samples. The trial was registered at ClinicalTrials.gov (NCT01744236).
Results
Neither liraglutide nor sitagliptin had an effect on gallbladder fasting volume and ejection fraction (p > .05). Liraglutide increased serum levels of deoxycholic acid in the fasting state [0.20 µmol/L (95% CI 0.027‐0.376), p = 0.024] and postprandial state [AUC 40.71 (13.22‐68.21), p = 0.005] and in faeces [ratio 1.5 (1.03‐2.19); p = 0.035]. Sitagliptin had no effect on serum bile acids, but increased faecal levels of chenodeoxycholic acid [ratio 3.42 (1.33‐8.79), p = 0.012], cholic acid [ratio 3.32 (1.26‐8.87), p = 0.017] and ursodeoxycholic acid [ratio 3.81 (1.44‐10.14), p = 0.008].
Conclusions
Neither liraglutide nor sitagliptin has an effect on gallbladder volume. Observed changes in bile acids with liraglutide suggest alterations in the intestinal microbiome, while sitagliptin appears to increase hepatic bile acid production.
Keywords: bile acids, dipeptidyl peptidase 4, DPP‐4, gallbladder emptying, gastric emptying, glucagon‐like peptide 1, GLP‐1
1. INTRODUCTION
Since 2005 glucagon‐like peptide (GLP)‐1 based therapies, i.e. GLP‐1 receptor agonists and dipeptidyl peptidase (DPP)‐4 inhibitors, have been established treatment options in the management of type 2 diabetes. These drug classes exploit the insulinotropic and glucagonostatic effects of GLP‐1, thereby effectively lowering blood glucose.1 In addition, GLP‐1 (receptor agonists) inhibits gastric emptying, gastric acid secretion and other aspects of proximal gastrointestinal physiology.1 Interestingly, recent studies also suggest a role of GLP‐1‐based therapies in biliary physiology. Acute administration of the GLP‐1 receptor agonist exenatide markedly reduced cholecystokinin‐stimulated gallbladder emptying by ~40% in healthy volunteers.2 Moreover, serum bile acid levels are reduced in DPP‐4 deficient mice, compared to wild type mice, which is explained by a reduction in bile acid production and enhanced bile acid excretion.3 Finally, in rat hepatocyte cultures, both GLP‐1 peptide and exenatide reduce CYP7A1, the hepatic cytochrome which converts cholesterol to bile acids.3
The effects of GLP‐1 based therapies on gallbladder emptying and bile acid production could explain several observations. First, these actions may accelerate gallstone‐formation and explain reports of cholelithiasis and cholecystitis with the use of these agents.4, 5, 6, 7 In two recent large randomized clinical trials, liraglutide increased the risk of cholelithiasis by > 50%.4, 7 Moreover, reduced bile acid concentration in the small intestine decreases lipid digestion and absorption, which could contribute to the beneficial effects of GLP‐1‐based therapies on postprandial lipid profiles. Since bile acids are also important regulators of glucose homeostasis,8 a reduction in bile acid secretion could also have negative glycaemic effects.
The effects of GLP‐1‐based therapies on gallbladder motility and bile acid physiology have not been studied during prolonged treatment or in patients with type 2 diabetes. Therefore, we examined our hypothesis that the GLP‐1 receptor agonist liraglutide and the DPP‐4 inhibitor sitagliptin inhibit gallbladder emptying and reduce bile acid production in patients with type 2 diabetes.
2. MATERIALS AND METHODS
This was a randomized, placebo‐controlled, double‐blind, parallel‐group study in which patients received 12‐week treatment with liraglutide (Novo Nordisk A/S, Bagsvaerd, Denmark), sitagliptin (Merck & Co, Kenilworth, NJ, USA) or matching placebos. The full protocol has been published previously.9 The study was performed at the VU University Medical Center (VUmc), the Netherlands between July 2013 and August 2015 and was approved by the ethics review board of the VUmc. It is registered at clinicaltrials.gov (NCT01744236) and was conducted in accordance with the Declaration of Helsinki and the International Conference on Harmonisation of Good Clinical Practice. All participants provided written informed consent before participation.
2.1. Participants
We recruited 60 Caucasian patients with type 2 diabetes using newspaper advertisements. Patients were males or postmenopausal females (35‐75 years of age; BMI, 25‐40 kg/m2) and had an HbA1c of 6.5%‐9.0% (48‐75 mmol/mol). They were treated with a stable dose of metformin and/or sulfonylurea derivatives for at least 3 months. Relevant exclusion criteria were: current treatment with insulin or GLP‐1‐based therapy; cholecystectomy; history of hepatic, pancreatic, cardiovascular or renal disease; an estimated glomerular filtration rate < 60 mL/min/1.73 m2; allergy to any of the test substances; alcohol intake > 3 units/d.
2.2. Treatment and randomization
Eligible patients were randomly assigned to receive liraglutide 1.8 mg, sitagliptin 100 mg or placebo (1:1:1 allocation ratio; block size of six). Randomization was performed by the trial pharmacist using computer‐generated numbers, allowing patients and trial physicians to remain blinded to study‐group assignments. Because of the different administration routes of liraglutide (subcutaneous) and sitagliptin (oral), all subjects received pens for subcutaneous injections and oral capsules, filled with active drug or placebo. Prefilled pens with either liraglutide or placebo were provided by Novo Nordisk, while sitagliptin and placebo were encapsulated by ACE Pharmaceuticals (Zeewolde, the Netherlands). Study drugs were taken once daily, at the same time of day in the evening. Subcutaneous injections were started at a dose of 0.6 mg for the first week, 1.2 mg for the second week and 1.8 mg for the remaining 10 weeks. Based on tolerance to the study drug, the time between dose increments could be extended and the dose could be reduced.
2.3. Study end points and procedures
Endpoint measurements were performed at baseline (after a run‐in period of 4 weeks to ensure stable conditions) and after 12‐week treatment. As previously described,9 all biliary measurements were secondary endpoints. Gallbladder emptying was measured using meal‐stimulated ultrasonography. Bile acid physiology was assessed by fasting and by postprandial serum bile acids and faecal bile acids. Additionally, gastric emptying was measured using the acetaminophen absorption test,10 to allow correction for the possible influence of gastric emptying on biliary physiology.
Gallbladder ultrasonography, the acetaminophen absorption test and measurement of the serum bile acid profile were performed during a single visit before and after 12‐week treatment. Moreover, patients were asked to bring a stool sample, as described below. Before each visit, patients were instructed to refrain from using alcohol or nicotine for at least 12 hours. Patients were instructed to arrive at the clinical research unit of the Diabetes Center VUmc in the fasting state, delaying all morning medication apart from metformin. An intravenous catheter was placed in an antecubital vein on the left arm, after which participants assumed a supine position during the entire visit. Gallbladder volume was measured and blood samples were taken. Then, a high‐fat mixed meal was given, which consisted of two slices of whole‐wheat bread with 20 g of butter and 250 mL of semi‐skimmed milk (total of 22.4 g fat), after which the tests were repeated.
2.3.1. Gallbladder ultrasonography
Gallbladder volume was measured at 15‐minute intervals, starting before the meal and continuing 180 minutes after the meal. Sonographic gallbladder images were obtained using a 3.5 MHz Siemens 4C1 curved abdominal transducer on a Sequoia Acuson ultrasound device (Siemens Healthcare GmbH, Erlangen, Germany). The maximal length, width and height of the gallbladder were obtained and recorded from longitudinal and axial cross‐sectional images. Per time moment, measurements were performed in triplicate, and the largest diameters were used for calculations. Gallbladder volume was calculated using the volume of an ellipsoid: 0.52 × length (cm) × width (cm) × height (cm).11 The smallest postprandial gallbladder volume was termed the residual volume (RV). The ejection fraction (EF) was calculated for each postprandial time point using the formula: (fasting volume – volume at corresponding time point)/fasting volume × 100. The maximum EF was calculated as: (fasting volume – RV)/fasting volume × 100.12, 13 Finally, the area under the curve (AUC) of gallbladder volume was calculated.
2.3.2. Serum bile acids
Levels of unconjugated and tauro‐ and glycine‐conjungated bile acids – chenodeoxycholic acid (CDCA), tauro‐CDCA (TCDCA), glycine‐CDCA (GCDCA), cholic acid (CA), tauro‐GCA (TCA), glycine‐CA (GCA), deoxycholic acid (DCA), tauro‐DCA (TDCA), glycine‐DCA (GDCA), litocholic acid (LCA), tauro‐LCA (TLCA), glycine‐LCA (GLCA), ursodeoxcycholic acid (UDCA), tauro‐UDCA (TUDCA) and glycine‐UDCA (GUDCA) – were measured in serum samples drawn from intravenous catheters before meal ingestion, and 30, 60 and 120 minutes thereafter. The bile acid profile was assessed as described previously.14 In short, serum samples were purified by centrifugation, evaporation and filtration. Then, quantitative determination of bile acids was performed using a Nexera X2 Ultra High Performance Liquid Chromatography system (Shimadzu, Kyoto, Japan), coupled to a Sciex QTRAP 4500 MD triple quadrupole mass spectrometer (Sciex, Framingham, MA, USA) (UHPLC‐MS/MS). Bile acids were separated with an Acquity UPLC BEH C18 Column equipped with an Acquity UPLC BEH C18 VanGuard Pre‐Column (Waters, Milford, MA, USA). The peak area was calculated for each serum sample and related to the peak area of an internal standard (D4‐labeled bile acids). Bile acid levels below the detection limit of 0.05 μM were classified as 0.025 μM. For statistical analyses, the AUC and incremental AUC (iAUC) were calculated using the trapezoid rule. Moreover, the sum of primary (CA and CDCA) and secondary (DCA, LCA, UDCA) bile acids and the sum of conjugated and unconjugated bile acids were calculated.
2.3.3. Faecal bile acids and neutral sterols
Levels of unconjugated bile acids (CDCA, CA, DCA, LCA and iso‐LCA) and neutral sterols (cholesterol, dihydrocholesterol and coprostanol) were measured in stool samples, using sample tubes with a scoop in the screw‐top. Patients were carefully instructed on collection techniques (to avoid contamination), storage in a dark and cool place and transport to the clinical research unit. Within two days of collection, samples were frozen at −80°C. Bile acids and neutral sterols were analysed as described previously.15 After lyophilization and homogenization of faeces, bile acids and neutral sterols were determined by capillary gas chromatography on an Agilent gas chromatograph (HP 6890), equipped with a 25 m × 0.25 mm (0.2 µm stationary phase) CP‐Sil‐19‐fused silica column (Varian, Middelburg, the Netherlands) and a flame ionisation detector. Bile acid levels below the detection limit of 2 nmol were classified as 1 nmol.
2.3.4. Gastric emptying
To measure gastric emptying, 1.5 g liquid acetaminophen (62.5 mL Daro Paracetamol, Remark Groep, Rogat, the Netherlands) was added to the mixed meal. Prior to the meal, and every 30 minutes following the meal up to 180 minutes, serum was collected. After centrifugation, serum was stored at −80°C until analysis. Serum acetaminophen levels were determined using an enzymatic immunoassay on an Architect 4000 (Abbott Laboratories, Abbott Park, IL, USA). The absolute area under the curve (AUC) was calculated, and the maximal acetaminophen concentration (Cmax) and the time to reach Cmax (Tmax) were noted.
2.3.5. Laboratory measurements
Venous blood glucose was measured in all blood samples using an YSI‐2300 STAT Glucose analyser (YSI Life Sciences, Yellow Springs, OH, USA). HbA1c, triglycerides, cholesterol, high‐density lipoprotein cholesterol (HDL‐C) and low‐density lipoprotein cholesterol (LDL‐C) were assayed by conventional methods at the Department of Clinical Chemistry in our hospital.16
2.4. Sample size, data management and statistical analysis
As current data are part of a larger study,9 of which the biliary effects were included as secondary endpoints, no a-priori power calculation was performed. However, when using numbers from the study in healthy subjects,2 where acute exenatide administration reduced ejection fraction (36.5%, SD ~15%), we calculated that 14 participants per group would be sufficient (parallel‐group design, α 0.05, power (1 − β) 80%).
All data were double‐entered into an electronic data management system (OpenClinica LLC, version 3.3, Waltham, MA, USA) and exported to the study database. To test treatment effects versus placebo, multivariable regression models were used on the per‐protocol population. Treatment with liraglutide or sitagliptin was added as a dummy‐variable, while baseline variables of the tested endpoint were included as covariate to correct for baseline differences between the treatment arms. Results of these tests are presented as treatment‐induced effect with 95% CI, corrected for baseline values. Because faecal bile acids demonstrated a non‐Gaussian distribution, log‐transformation was applied before analysis, and the anti‐log back transformation of the results is shown. Correlations between treatment‐induced changes in bile acids, weight and metabolic parameters were measured using the Pearson correlation technique. Because metformin is known to alter bile acid metabolism,17 additional sub‐analyses were performed, where a daily dose of metformin was added to the regression models as covariate. No corrections for multiple testing were performed, to decrease the risk of false‐negative findings in this hypothesis‐generating study. All analyses were performed using SPSS 22.0 (IBM SPSS Inc., Chicago, IL, USA), and a two‐sided p‐value < 0.05 was considered statistically significant.
3. RESULTS
3.1. Study population
After inclusion but before randomization, two patients withdrew informed consent and two patients were excluded because of incidental findings (malignancy). Thus, 56 patients were randomized to liraglutide (n = 19), sitagliptin (n = 20) or placebo (n = 17) (Figure S1, Supporting Information). Treatment was well tolerated, with adverse effects in equal numbers among treatment groups, apart from gastrointestinal disturbances (nausea, diarrhoea; present in 12 liraglutide‐treated patients, in two sitagliptin‐treated patients and in none of the placebo‐treated patients). In the sitagliptin‐group, one patient withdrew from the trial because of dizziness and pollakisuria. Per‐protocol baseline characteristics were similar among the three groups (Table 1).
Table 1.
Subject baseline characteristics
| Parameter | Sitagliptin (n = 19) | Liraglutide (n = 19) | Placebo (n = 17) |
|---|---|---|---|
| Age (years) | 61.7 ± 6.8 | 60.5 ± 7.2 | 65.8 ± 5.8 |
| Male sex [n (%)] | 16 (84.2%) | 14 (73.7%) | 13 (76.5%) |
| Weight (kg) | 99.4 ± 17.6 | 105.9 ± 17.2 | 95.8 ± 9.8 |
| BMI (kg/m2) | 31.5 ± 4.3 | 33.3 ± 4.5 | 30.6 ± 2.9 |
| FPG (mmol/L) | 8.0 ± 0.9 | 8.3 ± 1.4 | 8.9 ± 2.0 |
| HbA1c (%) | 7.1 ± 0.5 | 7.4 ± 0.7 | 7.5 ± 0.7 |
| HbA1c (mmol/mol) | 53.8 ± 5.6 | 57.1 ± 7.3 | 58.2 ± 7.9 |
| Duration of T2D (years) | 8.1 ± 5.8 | 7.7 ± 4.5 | 8.2 ± 4.8 |
| Metformin use [n (%)] | 18 (94.7%) | 19 (100%) | 15 (88.2%) |
| Sulfonylurea use [n (%)] | 9 (47.4%) | 7 (36.8%) | 8 (47.1%) |
| Systolic BP (mm Hg) | 132.5 ± 12.4 | 136.6 ± 17.0 | 137.6 ± 14.9 |
| Diastolic BP (mm Hg) | 75.2 ± 7.4 | 76.9 ± 5.4 | 76.4 ± 6.8 |
Data are presented as means ± SD for continuous data, and number (percent of total) for count data. No statistically significant between‐group differences were observed using anova and Chi‐square tests. BMI, body mass index; BP, blood pressure; FPG, fasting plasma glucose; T2D, type 2 diabetes.
3.2. Gallbladder emptying
Neither treatment influenced fasting volume, RV, maximal EF or the AUC of gallbladder volume, compared with placebo (p > .05) (Figure 1).
Figure 1.
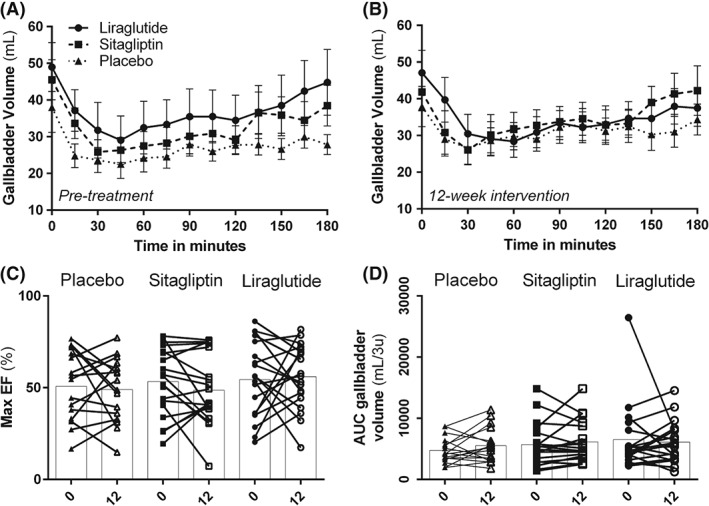
Gallbladder emptying. Gallbladder volume as measured using ultrasonography; A, before intervention and B, after 12‐week treatment with placebo, sitagliptin or liraglutide. Measurements were performed in the fasting state and after a high‐fat mixed meal; C, maximal ejection fraction (EF) at baseline and after 12‐week treatment; D, area under the curve of the gallbladder volume at baseline and after 12‐week treatment. No significant effects were observed.
3.3. Serum bile acids
Liraglutide increased fasting serum levels of DCA compared with placebo [0.20 µmol/L (95% CI 0.027‐0.376), p = .024] (Figure 2). Moreover, the postprandial AUC of DCA increased with liraglutide [40.71 µmol/l/2 h (95% CI 13.22‐68.21), p = .005). Other serum individual bile acids, total bile acids, total conjugated and unconjugated bile acids and total tauro‐ and glycine‐conjugated bile acids were not different between treatment groups (p > .05).
Figure 2.
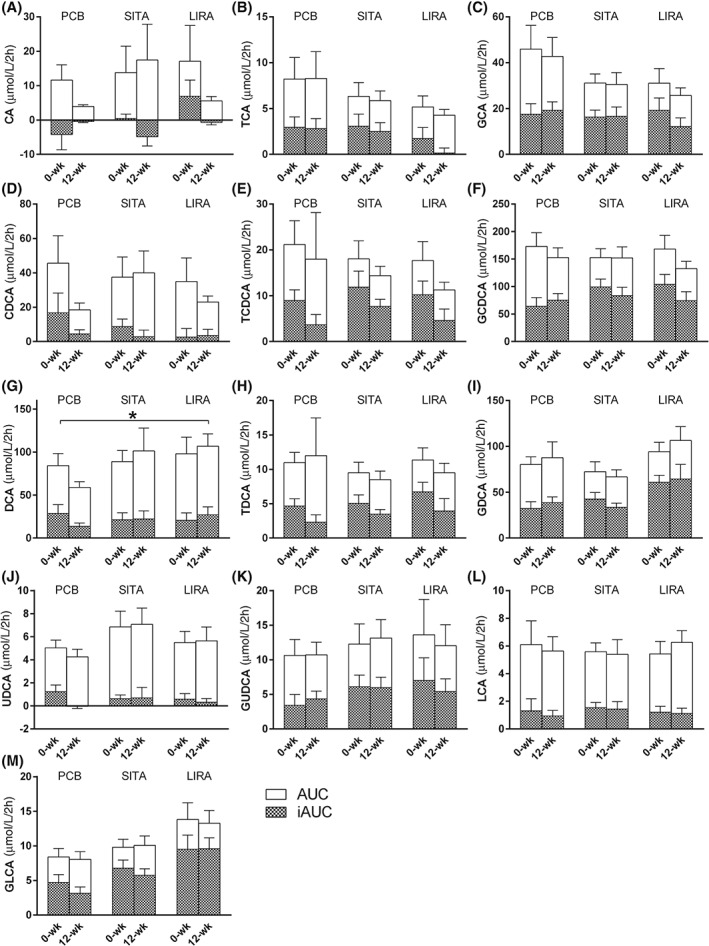
Bile acids in serum. Area under the curve (AUC) and incremental‐AUC (iAUC) for the postprandial serum bile acids before and after 12‐week treatment with placebo (PCB), sitagliptin (SITA) or liraglutide (LIRA). Data are presented as µmol/l/2 h. A, cholic acid (CA); B, taurocholic acid (TCA); C, glycocholic acid (GCA); D, chenodeoxycholic acid (CDCA); E, tauro chenodeoxycholic acid (TCDCA); F, glycochenodeoxycholic acid (GCDCA); G, deoxycholic acid (DCA); H, taurodeoxycholic acid (TDCA); I, glycodeoxycholic acid (GDCA); J, ursodeoxycholic acid (UDCA); K, glyco‐ursodeoxycholic acid (GUDCA); L, litocholic acid (LCA); and M, glycinelitocholic acid (GLCA). Tauro‐ursodeoxycholic acid (TUDCA) and taurolithocholic acid (TLCA) are not depicted, as most values were below the detection limit. All data are presented as mean with standard error of the mean. Asterisks (*) indicate statistically significant differences (p < .05) between treatment and placebo, corrected for baseline differences.
3.4. Faecal bile acids
Compared with placebo, both liraglutide [ratio 1.36 (95% CI 0.97‐1.91), p = .071] and sitagliptin [ratio 1.36 (95% CI 0.97‐1.91), p = .077] tended to increase faecal total bile acids. Liraglutide increased DCA [ratio 1.5 (95% CI 1.03‐2.19); p = .035], without affecting other bile acids (Figure 3). Sitagliptin increased CDCA [ratio 3.42 (95% CI 1.33‐8.79), p = .012] and CA [ratio 3.32 (95% CI 1.26‐8.87), p = .017]. Moreover, sitagliptin increased UDCA levels [ratio 3.81 (95% CI 1.44‐10.14), p = .008]. Neither therapy affected the amount of faecal neutral sterols or total sterols (p > .05).
Figure 3.
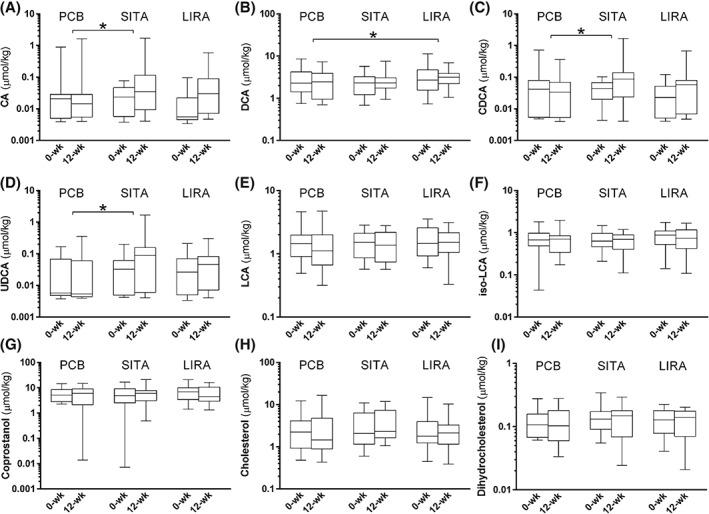
Bile acids in faeces. Faecal bile acids and neutral sterols after 12‐weeks of treatment with placebo (PCB), sitagliptin (SITA) or liraglutide (LIRA). A, cholic acid (CA); B, chenodeoxycholic acid (CDCA); C, deoxycholic acid (DCA); D, ursodeoxycholic acid (UDCA); E, lithocholic acid (LCA); F, iso‐lithocholic acid (iso‐LCA); G, coprostanol; H, cholesterol; and I, dihydrocholesterol. All data are presented as median with interquartile range (box) and total range (whiskers). A logarithmic scale was chosen for the y‐axis because of the wide range of values. Asterisks (*) indicate statistically significant differences (p < .05) between treatment and placebo, corrected for baseline differences.
3.5. Additional effects
Liraglutide or sitagliptin did not change acetaminophen Cmax, Tmax or AUC, compared to placebo (Figure S2, Supporting Information). No effects of liraglutide or sitagliptin were observed on fasting triglycerides, total cholesterol, HDL‐C and LDL‐C levels. Liraglutide tended to reduce weight by 1.7 kg (95% CI −3.6‐0.3; p = .09), while body weight was stable with sitagliptin [−0.8 (−2.7 to 1.0); p = .374]. Liraglutide decreased HbA1c by 1.3% (−1.7 to −0.9; p < .001) or 14.1 mmol/mol (−18.7 to −9.4), while sitagliptin lowered HbA1c by 0.8% (−1.4 to −0.4; p = .001) or 8.6 mmol/mol (−13.4 to −3.8). Both liraglutide and sitagliptin reduced fasting glucose [1.5 mmol/L (−2.3 to −0.8), p < .001 and 0.9 mmol/L (−1.7 to −0.2), p = .015, respectively] and postprandial glucose AUC [390.9 (−569.6 to −212.4), p < .001 and 230.2 (−416.7 to −43.8), p = .017, respectively] of glucose, compared with placebo. After exclusion of two outliers (placebo n = 1, sitagliptin n = 1), the change in the AUC of DCA and glucose was significantly correlated (R −0.353, p = .011; Figure S3, Supporting Information). No other statistically significant correlations between changes in faecal CA, CDCA, DCA and UDCA, serum DCA, and weight, HbA1c, and fasting and postprandial glucose were observed. Finally, correction for the use of metformin did not yield different results (data not shown).
4. DISCUSSION
In the current study we observed no effects of 12‐week treatment with liraglutide or sitagliptin on gallbladder emptying. Liraglutide increased both plasma and faecal levels of the secondary bile acid DCA. Sitagliptin increased faecal excretion of the primary bile acids CA and CDCA, and the secondary bile acid UDCA, without affecting fasting or postprandial serum bile acid levels.
We observed no effect on gallbladder emptying with a GLP‐1 receptor agonist or DPP‐4 inhibitor. This finding contrasts with a previous study by Keller et al., where acute administration of exenatide strongly reduced gallbladder emptying in healthy volunteers.2 This discrepancy can be explained by several factors. First, gallbladder emptying was triggered directly by CCK‐infusion in that study, while we used high‐fat meal stimulation. Consequently, other (intestinal) factors activated by meal‐ingestion could have influenced the effect of GLP‐1 based therapies in the current real‐life situation. Second, patients with type 2 diabetes frequently have reduced gallbladder emptying compared with healthy volunteers (~50% vs. ~75%, respectively).18 Potentially, a lower baseline emptying rate prevents a significant effect of an intervention. Finally, as is clearly established for the effects of GLP‐1 receptor agonists on gastric emptying rate, tachyphylaxis may occur with long‐acting (e.g. liraglutide), but not with short‐acting (e.g. exenatide) agents.1 The lack of effect of liraglutide on gastric emptying in the current study underlines this hypothesis. The DPP‐4 inhibitor sitagliptin had no effect on gallbladder emptying, which is in line with the current paradigm that these agents have little to no effect on proximal gastro‐intestinal motility.19
The effects of liraglutide and sitagliptin on bile acids differed. Physiologically, the liver produces the primary bile acids CDCA and CA, while the intestinal microbiome converts these into the secondary bile acids DCA, UDCA and LCA. Liraglutide increased the secondary bile acid DCA in serum and faeces. Because DCA originates by microbial 7‐dehydroxylation of the primary bile acid CA, in the absence of other changes in bile acid profile, the most probable explanation of this liraglutide‐induced increase in DCA levels is an alteration in intestinal microbiota. The excess of DCA is both excreted in faeces and absorbed as part of the enterohepatic circulation. While these data suggest changes in microbiota, effects of GLP‐1‐based therapies on the intestinal microbiome remain unstudied.
Sitagliptin significantly increased faecal levels of CA, CDCA and UDCA, and a similar pattern was seen with DCA and (iso‐)LCA. Interestingly, serum levels of these bile acids also increased, although this did not reach statistical significance. In the steady state, faecal bile acid secretion is a direct measure of body bile acid synthesis. Because bile acids are produced only in the liver, the increase in faecal bile acids indicates augmentation of hepatic bile acid production. In a recent study by Nunez et al., sitagliptin had no effect on serum bile acid levels and C4‐levels as proxy for bile acid synthesis in 13 patients with type 2 diabetes.20 Faecal bile acid excretion was not reported by Nunez et al., precluding a direct comparison of their data with those of the present study.
Several reports have suggested that both GLP‐1 receptor agonists and DPP‐4 inhibitors may increase the development of cholelithiasis.4, 5, 6, 7 In general, any factor that contributes to impaired gallbladder function, bile cholesterol supersaturation or precipitation might cause gallstone formation. Our data suggest that changes in gallbladder emptying are not involved in the pathophysiology of cholelithiasis with GLP‐1‐based therapies. However, although we did not measure biliary bile acid levels, the liraglutide‐induced increase in serum and faecal DCA levels leads to the speculation of increased biliary levels, which is a known inducer of cholesterol hypersecretion and gall stone formation.21 Since DCA did not increase during sitagliptin‐treatment, other (indirect) factors may be involved. Weight loss and dietary alterations are well‐recognized risk factors for gallstone development. However, while these occur during GLP‐1 receptor agonist treatment, they are not present during DPP‐4 inhibitor treatment, and as such, are probably not involved. Finally, a direct drug‐induced increase in biliary cholesterol excretion could be involved, similar to drug‐classes like fibrates.22 While in hepatocytes of DPP‐4 deficient mice an increase in mRNA of the cholesterol‐transporter (ABCG8) is found,3 suggestive of increased biliary cholesterol excretion, we found no differences in faecal cholesterol or neutral sterol levels between treatment groups.
From a metabolic perspective, increased levels of bile acids could be relevant. Accumulating data suggest that bile acids improve metabolism through activation of the farnesoid X receptor (FXR) and G protein‐coupled bile acid receptor 1 (or TGR5).16 FXR stimulation reduces hepatic gluconeogenesis and improves insulin sensitivity, while TGR5 activation increases energy expenditure and insulin sensitivity. However, most of these data stem from animal studies, and the only clinical study with a TGR5 agonist found no consistent effect on metabolic parameters.23 Nevertheless, since liraglutide treatment reduces hepatic gluconeogenesis and improves insulin sensitivity and energy expenditure,24, 25 it would be of interest to study whether bile acids may have mediated some of these effects. Although our study was not designed to specifically test this hypothesis, we did observe an inverse correlation between the postprandial DCA‐curve and postprandial glucose‐curve.
An increase in bile acids could induce adverse effects. For example, an excess of faecal bile acids could induce bile acid diarrhoea. Diarrhoea occurs frequently with liraglutide, yet is not a common side effect of sitagliptin.26 Mechanisms underlying the drug‐associated diarrhoea have not been studied, although some suggest that an osmotic factor is involved.27 However, since DCA has the highest potency to cause bile acid diarrhoea,28 this could explain the discrepancy between liraglutide and sitagliptin. Increased faecal bile acid concentration could also increase the risk of colon carcinoma, as especially DCA has been implicated in tumorigenesis.29 However, no signal for colon carcinoma has arisen from large clinical trials to date.
Metformin reduces serum bile acids and increases the intestinal bile acid pool, probably by reduction of ileal bile acid reuptake.30 Although metformin use was stable in the current study, evenly distributed across the groups, and did not affect the effects of the GLP‐1‐based therapies on bile acid composition, an interaction between the various drugs cannot be excluded. Unfortunately, we were not able to test this hypothesis, since only three patients were not using metformin, which fits daily clinical practice.
This study has some limitations that need to be recognized. First, for practical reasons, we did not use gold standard tests for gallbladder and gastric emptying (scintigraphy) or bile acid physiology (isotope‐measured kinetics). Second, since no active comparator was used, the effects of liraglutide and sitagliptin through glucose lowering cannot be excluded. However, the current trial aimed to assess real‐life effects of GLP‐1‐based therapies, disregarding whether these effects are caused by or beyond glucose lowering. Third, we did not measure the pharmacokinetics of liraglutide or (over‐encapsulated) sitagliptin in this study. For the latter, capsules were used which fully degrade within 10 minutes of ingestion, without affecting the pharmacokinetics of the included tablets itself. Fourth, although none of the collected faecal samples were watery diarrhoea, we did not collect data on precise stool consistency and stool frequency, which could theoretically have influenced the results of the faecal tests. Finally, although the study was adequately powered to assess the hypothesis, the groups were not fit for specific subgroup analyses.
To conclude, while liraglutide and sitagliptin have no effect on gallbladder emptying, both agents increase levels of bile acids, although differentially. The increase in faecal and serum bile acids during liraglutide treatment suggests alteration of intestinal microbiome, while sitagliptin appears to increase hepatic bile acid production.
Supporting information
Figure S1. Patient flowchart.
Figure S2. Gastric emptying.
Figure S3. Correlations between treatment‐induced changes in deoxycholic acid (DCA) and postprandial glucose.
ACKNOWLEDGMENTS
We thank all participants for their time and commitment to the demanding research protocol. Furthermore, we would like to thank J. Boerop for her indispensable practical assistance during the visits.
Conflict of interest
Through M.H.H. Kramer and M. Diamant, the VU University Medical Center received research grants from AstraZeneca, Boehringer Ingelheim, Novo Nordisk and Sanofi. M. Nieuwdorp received lecture fees from Eli Lilly, Sanofi and MSD. All other authors declare that there is no duality of interest associated with their contribution to this manuscript.
Author Contributions
M.M. Smits developed the study protocol, performed the measurements and analyses and wrote the manuscript. L. Tonneijck and M.H.A. Muskiet performed measurements and contributed to the discussion and manuscript writing. M. Diamant developed the study protocol. T. Hoekstra, M.H.H. Kramer, M. Nieuwdorp, A.K. Groen, D.L. Cahen and D.H. van Raalte contributed to the discussion and edited the manuscript. All authors had full access to all of the data and can take responsibility for the integrity of the data and the accuracy of the data analysis.
Smits MM, Tonneijck L, Muskiet MHA, Hoekstra T, Kramer MHH, Diamant M, Nieuwdorp M, Groen AK, Cahen DL and van Raalte DH. Biliary effects of liraglutide and sitagliptin, a 12‐week randomized placebo‐controlled trial in type 2 diabetes patients, Diabetes Obes Metab 2016, 18, 1217–1225. DOI:10.1111/dom.12748
Funding information: The research leading to these results was funded in part by the European Community's Seventh Framework Programme (FP7/2007‐2013), under grant agreement n° 282521 ‐ the SAFEGUARD project. Novo Nordisk kindly provided pre‐filled liraglutide and liraglutide‐placebo pens. The researchers were independent from the funders. The funders had no role in study design; in the collection, analysis, and interpretation of data; in the writing of the report; nor in the decision to submit the article for publication.
REFERENCES
- 1. Smits MM, Tonneijck L, Muskiet MHA, et al. Gastrointestinal actions of GLP‐1 based therapies: glycaemic control beyond the pancreas. Diabetes Obes Metab. 2016;18(2):178–185. [DOI] [PubMed] [Google Scholar]
- 2. Keller J, Trautmann ME, Haber H, et al. Effect of exenatide on cholecystokinin‐induced gallbladder emptying in fasting healthy subjects. Regul Pept. 2012;179(1‐3):77–83. [DOI] [PubMed] [Google Scholar]
- 3. Ben‐Shlomo S, Shlomo S, Ben, Zvibel I, et al. Dipeptidyl peptidase 4‐deficient rats have improved bile secretory function in high fat diet‐induced steatosis. Dig Dis Sci. 2013;58(1):172–178. [DOI] [PubMed] [Google Scholar]
- 4. Pi‐Sunyer X, Astrup A, Fujioka K, et al. A randomized, controlled trial of 3.0 mg of liraglutide in weight management. N Engl J Med. 2015;373(1):11–22. [DOI] [PubMed] [Google Scholar]
- 5. Korkmaz H, Araz M, Alkan S, Akarsu E. Liraglutide‐related cholelithiasis. Aging Clin Exp Res. 2015;27(5):751–753. [DOI] [PubMed] [Google Scholar]
- 6. Pizzimenti V, Giandalia A, Cucinotta D, et al. Incretin‐based therapy and acute cholecystitis: a review of case reports and EudraVigilance spontaneous adverse drug reaction reporting database. J Clin Pharm Ther. 2016;41(2):116–118. [DOI] [PubMed] [Google Scholar]
- 7. Marso SP, Daniels GH, Brown‐Frandsen K, et al. Liraglutide and cardiovascular outcomes in type 2 diabetes. N Engl J Med. 2016;375:311–322. [DOI] [PMC free article] [PubMed] [Google Scholar]
- 8. Kuipers F, Bloks VW, Groen AK. Beyond intestinal soap‐‐bile acids in metabolic control. Nat Rev Endocrinol. 2014;10(8):488–498. [DOI] [PubMed] [Google Scholar]
- 9. Smits MM, Tonneijck L, Muskiet MHA, et al. Cardiovascular, renal and gastrointestinal effects of incretin‐based therapies: an acute and 12‐week randomised, double‐blind, placebo‐controlled, mechanistic intervention trial in type 2 diabetes. BMJ Open. 2015;5(11):e009579. [DOI] [PMC free article] [PubMed] [Google Scholar]
- 10. Glerup H, Bluhme H, Villadsen GE, et al. Gastric emptying: a comparison of three methods. Scand J Gastroenterol. 2007;42(10):1182–1186. [DOI] [PubMed] [Google Scholar]
- 11. Dodds WJ, Groh WJ, Darweesh RM, et al. Sonographic measurement of gallbladder volume. AJR Am J Roentgenol. 1985;145(5):1009–1011. [DOI] [PubMed] [Google Scholar]
- 12. Sari R, Balci MK, Coban E, Karayalcin U. Sonographic evaluation of gallbladder volume and ejection fraction in obese women without gallstones. J Clin Ultrasound. 2003;31(7):352–357. [DOI] [PubMed] [Google Scholar]
- 13. Bastouly M, Arasaki CH, Ferreira JB, et al. Early changes in postprandial gallbladder emptying in morbidly obese patients undergoing Roux‐en‐Y gastric bypass: correlation with the occurrence of biliary sludge and gallstones. Obes Surg. 2009;19(1):22–28. [DOI] [PubMed] [Google Scholar]
- 14. Vrieze A, Out C, Fuentes S, et al. Impact of oral vancomycin on gut microbiota, bile acid metabolism, and insulin sensitivity. J Hepatol. 2014;60(4):824–831. [DOI] [PubMed] [Google Scholar]
- 15. van Meer H, Boehm G, Stellaard F, et al. Prebiotic oligosaccharides and the enterohepatic circulation of bile salts in rats. Am J Physiol Gastrointest Liver Physiol. 2008;294(2):G540–G547. [DOI] [PubMed] [Google Scholar]
- 16. Schaap FG, Trauner M, Jansen PLM. Bile acid receptors as targets for drug development. Nat Rev Gastroenterol Hepatol. 2014;11(1):55–67. [DOI] [PubMed] [Google Scholar]
- 17. Napolitano A, Miller S, Nicholls AW, et al. Novel gut‐based pharmacology of metformin in patients with type 2 diabetes mellitus. PLoS One. 2014;9(7):e100778. [DOI] [PMC free article] [PubMed] [Google Scholar]
- 18. Stone BG, Gavaler JS, Belle SH, et al. Impairment of gallbladder emptying in diabetes mellitus. Gastroenterology. 1988;95(1):170–176. [DOI] [PubMed] [Google Scholar]
- 19. Smits MM, van Raalte DH, Tonneijck L, et al. GLP‐1 based therapies: clinical implications for gastroenterologists. Gut. 2016;65(4):702–711. [DOI] [PubMed] [Google Scholar]
- 20. Nunez DJ, Yao X, Lin J, et al. Glucose and lipid effects of the ileal apical sodium‐dependent bile acid transporter inhibitor GSK2330672: double‐blind randomized trials with type 2 diabetes subjects taking metformin. Diabetes Obes Metab. 2016;18(7):654–662. [DOI] [PubMed] [Google Scholar]
- 21. Carulli N, Loria P, Bertolotti M, et al. Effects of acute changes of bile acid pool composition on biliary lipid secretion. J Clin Invest. 1984;74(2):614–624. [DOI] [PMC free article] [PubMed] [Google Scholar]
- 22. Davidson MH, Armani A, McKenney JM, Jacobson TA. Safety considerations with fibrate therapy. Am J Cardiol. 2007;99(6A):3C–18C. [DOI] [PubMed] [Google Scholar]
- 23. Hodge RJ, Lin J, Vasist Johnson LS, et al. Safety, pharmacokinetics, and pharmacodynamic effects of a selective TGR5 agonist, SB‐756050, in type 2 diabetes. Clin Pharmacol Drug Dev. 2013;2(3):213–222. [DOI] [PubMed] [Google Scholar]
- 24. van Can J, Sloth B, Jensen CB, et al. Effects of the once‐daily GLP‐1 analog liraglutide on gastric emptying, glycemic parameters, appetite and energy metabolism in obese, non‐diabetic adults. Int J Obes. 2014;38(6):784–793. [DOI] [PMC free article] [PubMed] [Google Scholar]
- 25. Jinnouchi H, Sugiyama S, Yoshida A, et al. Liraglutide, a glucagon‐like peptide‐1 analog, increased insulin sensitivity assessed by hyperinsulinemic‐euglycemic clamp examination in patients with uncontrolled type 2 diabetes mellitus. J Diabetes Res. 2015;2015:706416. [DOI] [PMC free article] [PubMed] [Google Scholar]
- 26. Pratley RE, Nauck M, Bailey T, et al. Liraglutide versus sitagliptin for patients with type 2 diabetes who did not have adequate glycaemic control with metformin: a 26‐week, randomised, parallel‐group, open‐label trial. Lancet. 2010;375(9724):1447–1456. [DOI] [PubMed] [Google Scholar]
- 27. Gutzwiller J‐P, Hruz P, Huber AR, et al. Glucagon‐like peptide‐1 is involved in sodium and water homeostasis in humans. Digestion. 2006;73(2‐3):142–150. [DOI] [PubMed] [Google Scholar]
- 28. Mekjian HS, Phillips SF, Hofmann AF. Colonic secretion of water and electrolytes induced by bile acids: perfusion studies in man. J Clin Invest. 1971;50(8):1569–1577. [DOI] [PMC free article] [PubMed] [Google Scholar]
- 29. Devkota S, Turnbaugh PJ. Cancer: an acidic link. Nature. 2013;499(7456):37–38. [DOI] [PubMed] [Google Scholar]
- 30. McCreight LJ, Bailey CJ, Pearson ER. Metformin and the gastrointestinal tract. Diabetologia. 2016;59(3):426–435. [DOI] [PMC free article] [PubMed] [Google Scholar]
Associated Data
This section collects any data citations, data availability statements, or supplementary materials included in this article.
Supplementary Materials
Figure S1. Patient flowchart.
Figure S2. Gastric emptying.
Figure S3. Correlations between treatment‐induced changes in deoxycholic acid (DCA) and postprandial glucose.