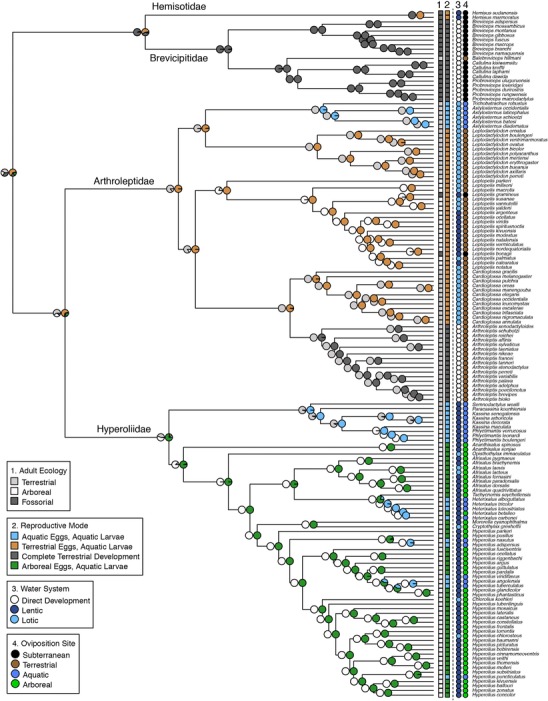
Figure 2.

Mapping of ecological, habitat, and reproductive character states onto the expanded sampling time‐calibrated phylogeny of Afrobatrachians. Boxes represent characters used for ancestral state reconstructions, with pie charts at nodes representing posterior probabilities of character states. Circles represent characters used for correlated evolution analyses. Numbers above boxes or circles match to character legends.
