

Abstract
Plasmacytoid dendritic cells (pDCs) have been shown to induce tolerance to innocuous antigens. Their migratory properties allow them to take up antigens from the periphery and transport them to the draining lymph nodes or to the thymus. However, pDC‐T‐cell interaction in the primary and secondary lymphoid organs still remains poorly defined. In this study, we show that resting pDCs loaded with exogenous antigen could induce tolerance when transferred intralymphatically into a single lymph node of wild‐type C57BL/6 mice. However, this was a result of antigen transfer from pDCs to endogenous antigen presenting cells and subsequent abortive proliferation of cognate CD4+ T cells. pDCs could not directly induce the proliferation of CD4+ T cells, as observed in mice lacking MHC class II gene. Moreover, pDCs failed to make physical contacts with OT‐II cells as revealed by two‐photon imaging. Thus, the role of resting pDCs in tolerance induction seems to be independent of its direct interaction with cognate CD4+ T cells.
Keywords: Antigen presentation, Antigen transfer, Delayed‐type hypersensitivity, Intralymphatic migration, Resting pDCs, Tolerance, Two‐photon imaging
Introduction
The induction of central and peripheral tolerance represents powerful mechanisms which ensure that potentially self‐reactive lymphocytes are prevented from attacking the body's own cells. The majority of single positive T cells are deleted in the thymus during T‐cell development as they are reactive to self‐antigens 1. However, this deletion is limited to those antigens actually expressed in or transported to the thymus. Thus, to ensure that T cells arriving in the periphery do not react to innocuous environmental antigens, dendritic cells (DCs) continually present these as well as self‐antigens to T cells in secondary lymphoid organs (SLOs) such as lymph nodes (LNs). In the absence of co‐stimulation this leads to the functional silencing of cognate T cells or to their conversion into regulatory T cells 2, 3. Thus by continuous antigen presentation, DCs maintain peripheral tolerance and ensure T cell‐ homeostasis 4, 5. Among different subsets of DCs, plasmacytoid DCs (pDCs) have been implicated to induce peripheral tolerance. In several models, such as cardiac allografts and asthmatic challenge, it was shown that pDCs can take up antigen from the periphery and migrate to the draining LN 6, 7. However, little is known about the nature of the interactions between pDCs, naïve CD4+ T cells and potentially additional cells in the LNs leading to tolerance induction. To induce tolerance, it seems plausible that resting pDCs might interact directly with cognate T cells. However, it has been suggested that different subsets of DCs cooperate to induce both tolerance and immunity 8. For example, it has been suggested that migratory DCs carry antigen from the skin to LN while LN‐resident DCs present it to T cells 9. Thus it seems to be possible that resting pDCs might cargo peripheral antigens to LNs and that LN‐resident antigen‐presenting cells (APCs) present it.
The migratory properties of pDCs are not well understood. Under homeostatic conditions pDCs are found in SLOs such as spleen and LN. Similar to B cells and T cells, resting pDCs enter the LNs from the blood stream through specialized high endothelial venules (HEV) 10, 11, 12. In the steady state, pDCs are also present in the peripheral tissues such as lung, liver, gut, but are largely absent in the skin, however in the presence of inflammatory conditions such as in psoriasis or viral infections, pDCs can accumulate in the skin 7, 13, 14, 15, 16. Although pDCs have been shown to take up antigens from peripheral tissues and transport them to draining LNs, their migration through the afferent lymph vessels is unclear 6, 7. pDCs were found in the lymph vessels of sheeps and pigs, however in rats pDCs were not detectable in the lymph vessels draining toward the mesenteric LN neither in steady‐state conditions nor when the rats were given resiquimod, a TLR‐7 ligand known to mobilize pDCs 17, 18. Thus it remains elusive if and under what conditions pDCs can migrate from the periphery to the draining LN via the afferent lymph vessels.
Since several studies addressing tolerance induction using adoptively transferred pDCs have used wild type (WT) recipients known to harbor various DC subsets in LNs able to act as antigen recipients and presenters, it seems possible that the role of resting pDCs in tolerance induction might be more complicated than so far anticipated 14, 19. In the present study, we adoptively transferred antigen‐loaded, in vitro differentiated pDCs via intralymphatic (i.l.) delivery in lymph vessels draining toward the popliteal or brachial LN 20. Recipients also received by intravenous (i.v.) injection CD4+ T cells carrying a transgenic TCR (OT‐II cells). While pDC transfer into WT recipients resulted in abortive OT‐II cell proliferation and tolerance induction, OT‐II cells were completely neglected in mice lacking MHC class II. Furthermore, two‐photon microscopy revealed lack of physical contact between OT‐II cells and antigen‐loaded pDCs in WT and MHC class II deficient B6‐Aa0IAa0 mice. Thus it seems, while pDCs can carry and transfer antigen to the LNs, they rely on endogenous APCs to prime T cells to a tolerogenic state.
Results
Resting pDCs induce abortive proliferation of cognate CD4+ T cells
To investigate how resting pDCs induce functional silencing of cognate T cells, we checked if ova‐loaded resting pDCs could induce the proliferation of MHC class II restricted CD4+ T cells carrying a transgenic TCR specific for an epitope (amino acids 323–339) of ova (termed OT‐II here). We therefore i.v. transferred efluor670‐labeled OT‐II cells into B6 recipients that i.l. received at the same day ova‐loaded resting pDCs into the afferent lymph vessel draining to the popliteal LN. Resting pDCs were generated in vitro as described (Supporting Information Fig. 1). Alternatively, as a positive control group, some mice received i.l. BMDCs loaded with ova and stimulated with LPS, a TLR4 ligand. Recipient mice were orally administered FTY720 to block the egress of T cells from the popliteal LNs. Mice were sacrificed at different time points, the popliteal LNs were removed and quantitatively assed for the presence of proliferating OT‐II cells (Fig. 1A). Interestingly, resting pDCs induced proliferation of OT‐II cells by d4 to a degree similar to the one observed following transfer of activated BMDCs (Fig. 1B). However, analyzing the expansion kinetics of OT‐II cells after transfer of resting pDCs, we failed to observe an increase of OT‐II cell count from d4 to d6 and noticed a nearly complete loss of these cells by d11. In contrast, following activated BMDC transfer, OT‐II cell counts increased until d11 (Fig. 1C). OT‐II cells in both groups underwent complete proliferation in the draining LN, as revealed by their proliferation profiles on d6 and d11 whereas in a nondraining LN, i.e. inguinal LN they remained nonproliferated (Supporting Information Fig. 3). These data indicate that resting pDCs induce an abortive proliferation of cognate CD4+ T cells.
Figure 1.
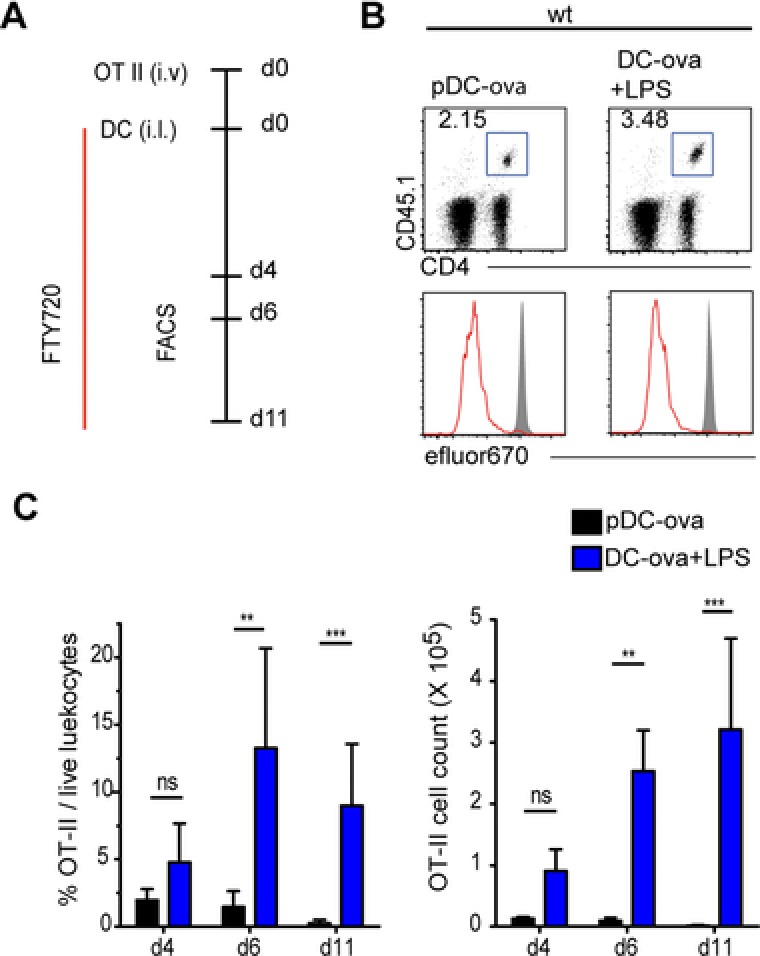
pDCs induce abortive proliferation of cognate CD4+ T cells in WT recipients. (A) Immunization scheme: WT mice received i.v. efluor670‐labeled OT‐II cells and by i.l. transfer ova‐loaded, resting pDCs, or LPS‐stimulated BMDCs. On the day of adoptive transfer mice were given an oral gavage of FTY720 and from the next day mice received FTY720 in drinking water until they were sacrificed. (B) Proliferation profiles of OT‐II cells isolated from popliteal LNs on d4. OT‐II cells were gated as DAPI− CD45.1+ CD4+. Shaded curves depict control proliferation profiles of OT‐II cells isolated form nondraining LN of the same mouse. Results from one representative of at least four experiments are shown. (C) Percentage and number of OT‐II cells in the popliteal LN at the indicated days after adoptive transfer of resting pDCs (black) or LPS‐stimulated BMDCs (blue). Data are shown as mean + SD; n = 4–8 LNs analyzed per time point pooled from five to nine experiments per group. ** p < 0.01, *** p < 0.001; Dunn's multiple comparison.
Resting pDCs rely on LN‐resident APCs to induce T‐cell proliferation
Migratory DCs are capable to transfer antigen to LN‐resident DCs, for induction of tolerance and immunity 8, 9. Similarly, it seems possible that LN‐resident DCs also play a role in tolerance induction toward antigens cargoed to LNs by migratory pDCs. To test if resting pDCs could directly prime OT‐II cells without the assistance of endogenous APCs, we developed an in vitro as well as an in vivo model. In in vitro experiments ova‐loaded resting pDCs were put together with OT‐II cells in a 1:5 ratio. As a control group ova‐loaded, LPS‐stimulated BMDCs were also put together with OT‐II cells in the same ratio. We also used the nonstimulated cDC fraction of the in vitro generated Flt‐3L DCs in our assay. Resting pDCs entirely failed to induce proliferation of OT‐II cells (Fig. 2A). In contrast, activated BMDCs induced strong proliferation of all OT‐II cells by d4 (Fig. 2A). To exclude potential effects of the Flt‐3L overexpression system, we also used pDCs that were isolated from the bone marrow (BM) of untreated WT mice. BM‐derived pDCs also failed to induce any proliferation of OT‐II cells (Supporting Information Fig. 4). pDCs stimulated with R848, a TLR‐7 ligand induced little proliferation of OT‐II cells but could not induce robust expansion (Fig. 2A and B). In contrast, nonstimulated cDCs induced the strongest proliferation and expansion of OT‐II cells among all the different DC types tested.
Figure 2.
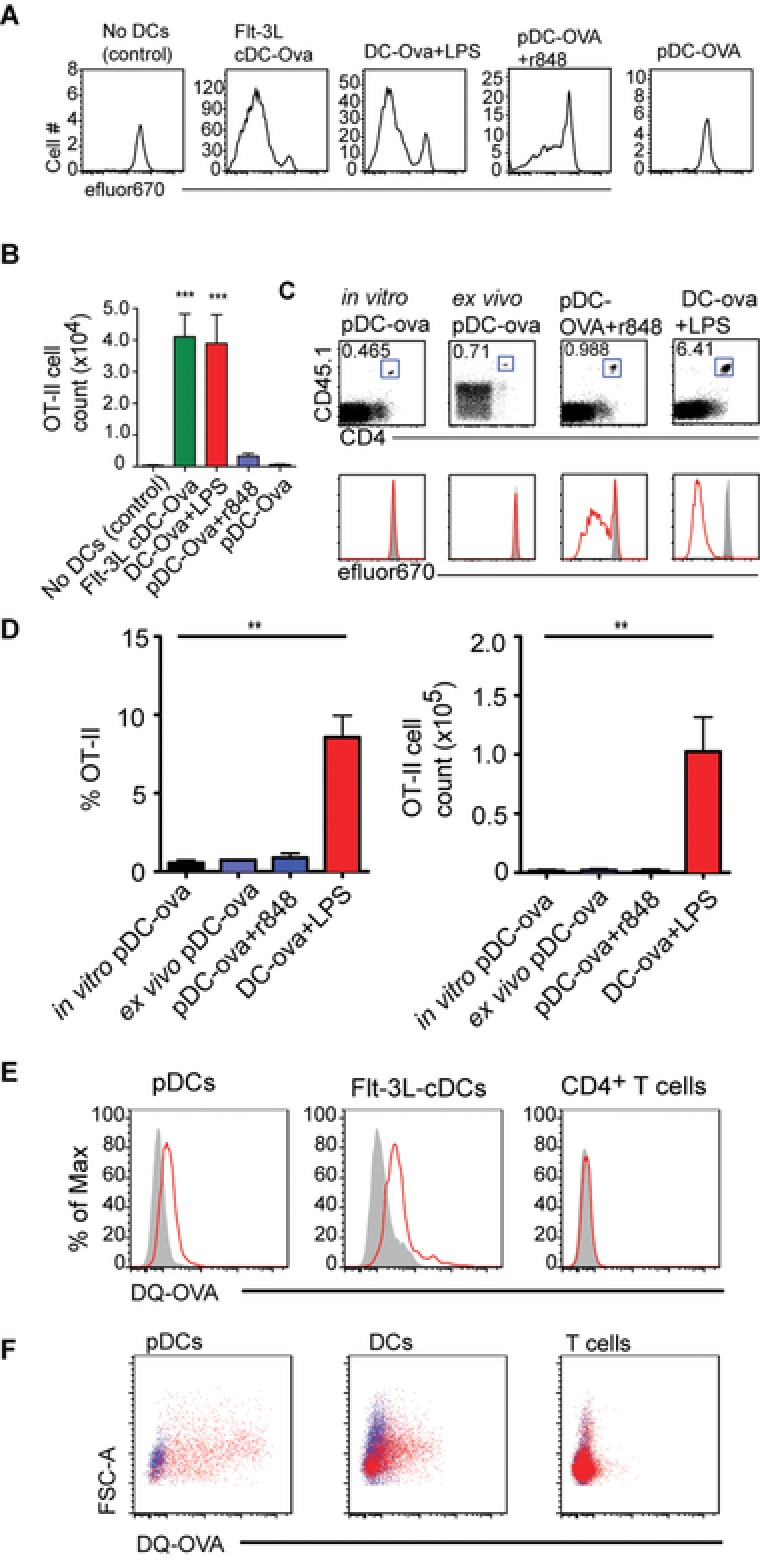
Resting pDCs can process exogenous soluble antigen but cannot prime CD4+ T cells. (A) Proliferation profiles of OT‐II cells that were cultured with indicated DC type, 4 days earlier. The first plot represents negative control wherein OT‐II cells were cultured without any DCs. Plots are gated on all live DAPI− CD45.1+ CD4+ OT‐II cells. (B) Number of OT‐II cells was determined by putting a fixed number of fluorescent latex beads in every sample. Data are shown as mean + SEM and are pooled from two experiments comprising seven replicates for each group. Every group compared with negative control group by Dunn's multiple comparison, *** p < 0.001. (C) Proliferation profiles of transferred OT‐II cells isolated from popliteal LNs of MHCII‐deficient mice that were additionally given by i.l transfer ova‐loaded, resting in vitro pDCs (in vitro pDC‐ova) or resting ex vivo pDCs (ex vivo pDC‐ova) or R848 stimulated in vitro pDCs (pDC‐ova + r848) or (LPS‐stimulated BMDCs (DC‐ova + LPS), 4 days earlier. On the day of adoptive transfer mice were given an oral gavage of FTY720 and from the next day mice received FTY720 in drinking water until they were sacrificed. OT‐II cells were gated as DAPI− CD45.1+ CD4+. Shaded curves depict control proliferation profiles of OT‐II cells isolated from nondraining inguinal LN of the same mouse. Results of one representative of two to five experiments per group are shown. (D) Percentage and number of OT‐II cells in the popliteal LNs. Data are shown as mean + SD (n = 4–10 LNs) and are pooled from two to eight independent experiments per group. ** p < 0.01; Dunn's multiple comparison. (E) Resting pDCs or Flt‐3L cDCs or CD4+ T cells (isolated from the LNs of WT mice), were cultured in the presence of DQ‐OVA and then analyzed by flow cytometry. Data shown are representative of two independent experiments. (F) WT mice were injected with DQ‐OVA s.c. 24 h postinjection the right brachial or popliteal LNs were harvested and single‐cell isolates were stained to check for the uptake of DQ‐OVA (red dots) in indicated cell populations. Blue dots represent cells from the counterlateral LNs. pDCs were gated as DAPI− CD11cint pDCA‐1+ cells, DCs were DAPI− pDCA‐1−CD11c+ cells, and T cells were gated as DAPI− CD11c− CD3+ cells. Data shown are representative of two independent experiments.
For in vivo experiments we used the same experimental regime as described for Figure 1 but used MHCII‐deficient mice as recipients to exclude antigen presentation by endogenous APCs. Resting pDCs entirely failed to induce proliferation of OT‐II cells whereas activated DCs induced strong proliferation of all OT‐II cells (Fig. 2C and D). We also used pDCs ex vivo generated in mice by subcutaneous (s.c.) application of BL16FL tumor cells overexpressing Flt‐3 ligand. Applying pDCs purified from the spleen and LNs of such donors and loaded with ova we also failed to observe proliferation of OT‐II cells in MHCII‐deficient recipients (Fig. 2C and D). As observed in the in vitro proliferation assays, R848‐stimulated pDCs could only induce minimal proliferation of OT‐II cells that could not lead to significant expansion.
Analyzing the expression profile of molecules involved and antigen presentation and costimulation on pDCs, we detected low levels of MHCII, CD40, CD80, and CD86 on resting pDCs while high levels were present on activated DCs (Supporting Information Fig. 2). These data indicate that resting pDCs fail to directly prime cognate CD4+ T cells since they do not possess adequate machinery required for T‐cell priming, such as MHCII molecules and cannot deliver costimulatory signals via CD40, CD80, or CD86. We further checked, whether resting pDCs can even process exogenous soluble antigen. For this, we used DQ‐OVA, a self‐quenched conjugate of ova that emits fluorescence when processed in acidic conditions. If a cell population could process DQ‐OVA in acidic endosomes, it should emit fluorescence above background. pDCs loaded with DQ‐OVA emitted fluorescence that was above background level. The unspecific background fluorescence was determined by loading pDCs with DQ‐OVA at 4°C, since at 4°C cells cannot process antigens. As positive controls, cDCs sorted from in vitro generated Flt‐3L DCs were also employed in this assay. As negative controls CD4+ T cells were used, since CD4+ T cells do not internalize antigens. The shift in fluorescence from background for both cDCs and pDCs was comparable, whereas CD4+ T cells emitted the same amount of fluorescent light when cultured at 4°C or 37°C (Fig. 2E). Thus, the results of this assay suggest that pDCs are proficient to internalize and process soluble antigen. To corroborate these results in vivo we injected DQ‐OVA s.c. into the legs of WT mice and checked for its uptake and processing in different immune cell populations, i.e. pDCs, DCs, and T cells in the draining LNs, i.e. popliteal or brachial. Similar stainings were performed for cells isolates from the contralateral LNs to estimate the background fluorescence. While only a very low frequency of T cells was labeled with low efficiency, which reflects unspecific labeling, a significant fraction of DCs and pDCs were labeled. pDCs were labeled even more efficiently than DCs, which reflects that s.c. injected DQ‐OVA is accessible to and digested by LN pDCs (Fig. 2F). Thus, although pDCs can digest exogenous soluble antigens, they cannot present it efficiently to induce the proliferation of cognate CD4+ T cells.
Blood and afferent lymph derived resting pDCs do not migrate to the LN paracortex
We next addressed the positioning of resting pDCs within LNs following i.l. and i.v. transfer. Following i.v. transfer resting pDCs localized in the sinus area in the LNs (Fig. 3A). After i.l. application only few of the injected resting pDCs could be detected in the popliteal LN. Even the few cells that entered failed to migrate to the deep paracortex but instead localized near the medullary or subcapsular sinus (Fig. 3B). Thus the localization of pDCs following i.v. and i.l. transfer was similar suggesting that pDCs find a preferred niche around the sinus area. To directly compare the homing capacity of resting pDCs with that of activated BMDCs, genetically labeled resting pDCs and genetically labeled activated BMDCs were injected i.l. into the vessel draining the popliteal LN at a 3:1 ratio. Eighteen hours after injection, recipient mice were sacrificed and popliteal LN excised to determine by immunohistology the localization of injected cells. As expected, activated BMDCs efficiently entered the LN parenchyma and migrated into the T‐cell zone (Fig. 3C). In comparison, the number of resting pDCs that entered the LN parenchyma was severely reduced (Fig. 3C and D). Moreover, these cells were largely impaired in their ability to migrate into the T‐cell zone and localized in areas close to the sinus system and in interfollicular regions (Fig. 3C and D).
Figure 3.
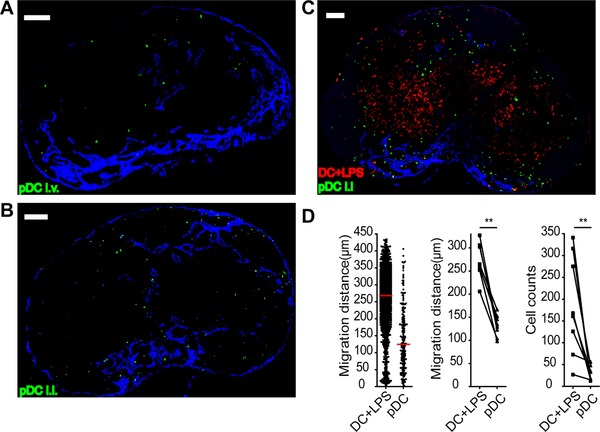
Resting pDCs home to sinus areas in the LNs. Immunohistology of popliteal LN of WT mice that were sacrificed 18 h after (A) i.v. injection of >5 × 10⁶ resting GFP+ pDCs (green) or (B) i.l. injection of 5 × 10⁴ resting GFP+ pDCs (green) or (C) i.l. injection of resting GFP+ pDCs (green) together with LPS‐stimulated CFP+ BMDCs (red) at a 3:1 ratio (total of 105 cells). (A–C) Data shown are representative of sections from six to eight LNs obtained in two independent experiments. Scale bar, 100 μm. (D) Migration distance from LN sinus of pDCs and LPS‐stimulated BMDCs (left; red bar, median), median migration distance of cell type/section (middle) and cell type count/section (right). Data shown are derived from LN sections from eight LNs analyzed in two independent experiments. **p < 0.01; one‐tailed Wilcoxon signed‐rank test.
Resting pDCs do not physically engage cognate CD4+ T cells
Physical cognate interactions of T cells and APCs are a prerequisite for activation or tolerization of T cells 21. Studies on pDC–T‐cell interactions are scarce and so far have only been addressed in vivo in the spleen 22. We studied the interactions of antigen‐loaded resting pDCs with OT‐II cells in LNs by two‐photon microscopy. OT‐II cells, labeled with the fluorescent dye TAMRA, were transferred i.v. and genetically labeled ova‐loaded, resting pDCs or activated BMDCs were transferred i.l. into recipients that were sacrificed after 12 h. Explanted LNs were mounted in a temperature‐controlled perfusion chamber and used for two‐photon imaging. As we learned from our homing experiments that resting pDCs are impaired from homing into the deep paracortex, we imaged primarily the interfollicular areas where pDCs and OT‐II cells resided in close proximity to each other. Studying WT as well as MHCII‐deficient recipients, OT‐II cells did not form any stable contacts with resting pDCs despite their close spatial proximity (Fig. 4A, Supporting Information Video 1). Depending on whether activated BMDCs or resting pDCs were transferred, OT‐II cells displayed different intranodal migration behavior. Compared to resting pDCs, OT‐II cells showed a considerably reduced migration velocity when activated BMDCs were used in both WT and MHCII‐deficient recipients, (Fig. 4B). Likewise, determining the arrest coefficient, a parameter that expresses the percentage of time a cell is considered to be nonmotile (i.e., displaying an instantaneous velocity <3 μm/min), also reflected that OT‐II cells were arrested to a higher degree in both recipient strains when activated DCs, rather than resting pDCs, were adoptively transferred (Fig. 4C). However, it should be noted that we occasionally observed clustering of OT‐II cells in WT recipients but not to the transferred resting pDCs, but to presumably resident APCs (Supporting Information Video 2). To confirm this, we immunostained LN sections of WT mice that received labeled OT‐II cells i.v. and GFP+ ova‐loaded pDCs i.l. We observed that OT‐II cells clustered around the CD11c+ DCs and these clusters were often spatially proximal to the injected pDCs (Supporting Information Fig. 5). These data indicated that that even in the absence of direct contacts with pDCs, OT‐II cells can get arrested by endogenous DCs that receive the antigen from resting pDCs.
Figure 4.
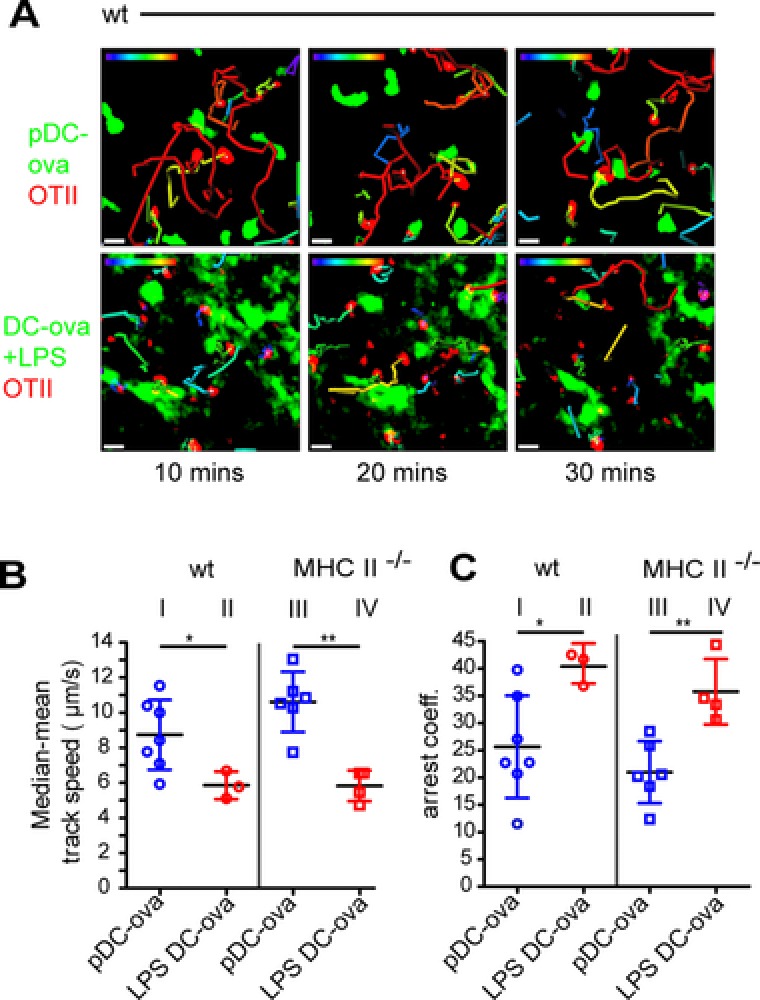
Resting pDCs do not physically interact with cognate CD4+ T cells. WT or MHCII‐deficient recipients received TAMRA‐labeled OT‐II cells (red) by i.v. and resting, ova‐loaded GFP+ pDCs (pDC‐ova, green) or LPS‐stimulated, ova‐loaded, LPS‐stimulated GFP+ DCs (LPS DC‐ova) by i.l. adoptive transfer. Popliteal/brachial LNs were excised 12–18 h later and interactions between OT‐II cells and DCs were imaged for 1 h by two‐photon microscopy. (A) “Snapshots” at time points indicated during time‐lapse recording. Images depict maximum intensity projections along the z axis (top view) through image stacks comprising a volume of 125 × 125 × 30 μm (X × Y × Z). Cell tracks depicting the path for the last 10 min are color coded for displacement over time (blue = 0 μm; red = 20 μm). Results of one representative of three to six time‐lapse recordings for each group are shown. Scale bar, 10 μm. OT‐II cell track speed (B) and arrest coefficients (C) in the presence of ova‐loaded, resting pDCs, or LPS‐stimulated DCs in WT or MHCII‐deficient recipients as indicated. Symbols represent movies, bars show mean ± SD; data pooled from two to four independent experiments per group. *p < 0.05, **p < 0.001; one‐tailed Mann–Whitney test.
Cargoing antigen to LNs is not an exclusive function of pDCs
Since it became clear that pDCs can transfer antigen to endogenous APCs in WT recipients, we tested if this phenomenon is specific for pDCs or whether other migrating immune cells are also able to cargo antigen to LNs. In the same experimental setup described for Figure 1, we injected i.l. purified CD4+ T cells, loaded with ova, in both WT and MHCII‐deficient recipients. In MHCII‐deficient recipients, ova‐loaded CD4+ T cells failed to induce proliferation of OT‐II cells (Fig. 5A), however induced complete proliferation of OT‐II cells in WT recipients by day 4 (Fig. 5A). pDCs and CD4+ T cells induce to the same extent CD4+ T‐cell proliferation and expansion by carrying and delivering antigen to endogenous APCs (Fig. 5B). Moreover, adoptive transfer of CD4+ T cells derived from act‐m‐ova mice, which express a membrane‐bound form of ova also allowed for transfer of ova to endogenous APCs and resulted in the proliferation of OT‐II cells (Supporting Information Fig. 6).
Figure 5.
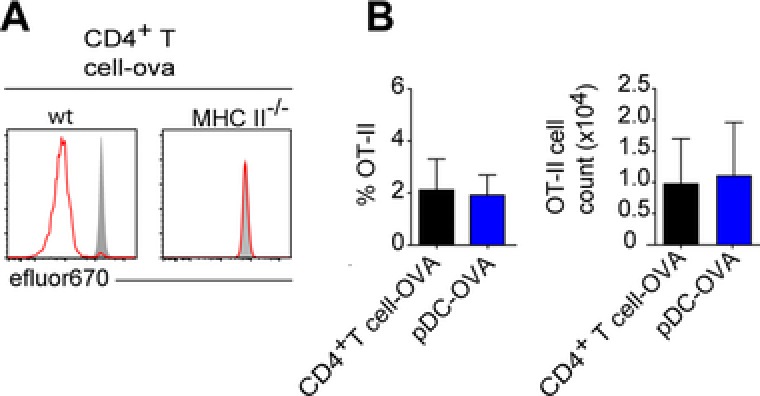
Immune cells including nonantigen presenting cells can transfer antigen to APCs in LNs. (A) Proliferation profiles of transferred OT‐II cells from brachial/popliteal LN of WT or MHCII‐deficient mice that were additionally given by i.l. transfer and ova‐loaded CD4+ T cells, 4 days earlier. On the day of adoptive transfer mice were given an oral gavage of FTY720 and from the next day mice received FTY720 in drinking water until they were sacrificed. OT‐II cells were gated as DAPI− CD45.1+ CD4+. Shaded curves depict control proliferation profiles of OT‐II cells isolated form nondraining inguinal LN of the same mouse. Results of one representative of two to nine experiments per group are shown. (B) Frequency of OT‐II cells of live leukocytes and OT‐II cell counts in the popliteal/brachial LN. Data are shown as mean + SD; n = 4–9 popliteal or brachial LNs pooled from two to nine independent experiments. Dunn's multiple comparison.
Transfer of antigen leads to tolerance in the steady state
Since we observed that antigen handover by pDCs can lead to abortive proliferation of CD4+ T cells, we tested whether this results in tolerance toward subsequent immune challenge with the cognate antigen. For this, we used a model of delayed type hypersensitivity (DTH; Fig. 6A). In the absence of tolerance induction WT mice receive LPS‐stimulated ova‐loaded BMDCs at day 6, an s.c. ear application of ova at day 12 and show a profound ear swelling at day 14. However, when mice received additional adoptive i.l. transfer of ova‐loaded pDCs at day 0, ear swelling was drastically reduced (Fig. 6B). Since antigen‐loaded CD4+ T cells also induced T‐cell proliferation following i.l. transfer, we tested if CD4+ T cells could also induce tolerance in the DTH model. Indeed, i.l. injection of ova‐loaded CD4+ T cells could induce tolerance to the same degree as resting pDCs (Fig. 6B). These data suggest that LN‐resident APCs play a key role for tolerance induction and that adoptively transferred immune cells, irrespective of their origin can handover antigen to these cells. These finding are of considerable importance when interpreting tolerance studies that use adoptive cell transfer in MHC‐proficient recipients.
Figure 6.
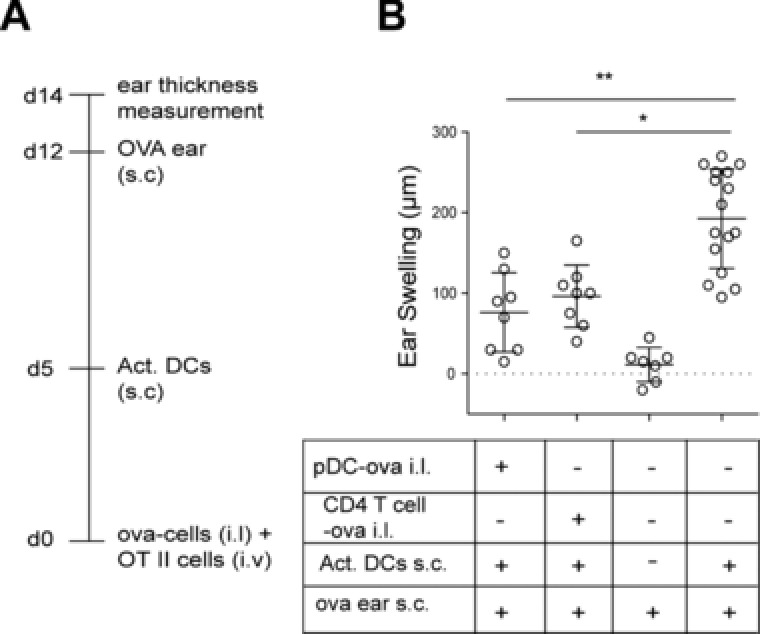
Transfer of cell‐associated antigen leads to tolerance in the steady state. (A) Immunization scheme. WT mice either i.l. received ova‐loaded pDCs or ova‐loaded CD4+ T cells or were left untreated. Six days later, mice were s.c. immunized by ova‐loaded LPS‐stimulated DCs. As negative controls, some mice received neither ova‐loaded cells at day 0 nor ova‐loaded, LPS‐stimulated DCs at day 6. At day 12 ear thickness was measured before mice received ova s.c. in the ear. Ear thickness was again analyzed at day 14. (B) Increase in ear thickness between days 12 and 14 in groups of mice treated as indicated. Circles represent ears. Bars indicated mean ± SD; pooled data from two to five independent experiments per group. * p < 0.05, ** p < 0.01; Dunn's multiple comparison.
Discussion
pDCs can egress from the blood to home to SLOs 10, 12. However, it is still unclear whether these cells can enter LNs arriving via afferent lymphatics. In rats, pDCs could not be found in the efferent and pseudoafferent intestinal and hepatic lymph vessels, while it was detected in the lymph vessels of pigs and sheeps 17, 18. Owing to the small size of the vessels and potential low frequencies, pDCs are hardly detected in lymph vessels in mice. Following s.c. injection, pDCs could not be located in the draining LN, but it remained unclear whether the cells failed to enter terminal lymphatics or failed to egress from lymph into the LN parenchyma after arriving at the subcapsular sinus 22. Thus to address if lymph‐derived pDCs can home into LNs we adoptively transferred resting pDCs by i.l. delivery into the lymphatic vessel draining toward the popliteal LN. The in vitro derived pDCs used in this study resemble pDCs found in peripheral tissues, especially with regard to the expression CCR7 and costimulatory molecules. In fact this phenotype is conserved across species as pDCs from human blood as well as lymph of sheep show a similar phenotype. Using this approach we show that resting pDCs failed to a large degree to enter the LN parenchyma while few of them were located in the subcapsular and medullary sinuses. These finding indicate, that in contrast to steady‐state trafficking DCs, resting, lymph‐derived pDCs are largely excluded from homing into the T‐cell zone of draining LNs 23.
In contrast, TLR‐7 ligand‐stimulated pDCs homed more efficiently to LNs and also entered the T‐cell zone showing a preference for interfollicular areas (data not shown). Since TLR‐7 ligands induce upregulation of CCR7 on pDCs these findings suggest that CCR7 is indispensable for afferent lymph LN homing as described before for skin‐derived DCs 24, 25. Thus, the migration from periphery such as skin to the draining LN does not seem to represent a LN homing route frequently taken by resting pDCs. However, in case of inflammation such as in viral infection or autoimmunity, activated lymph‐derived pDCs might possess the potential to home to draining LNs via afferent lymphatics and contribute antigen presentation and immune responses.
Conventional subsets of DCs are known to contribute to peripheral tolerance by continually presenting self‐ or environmental antigens to cognate T cells, however the antigen presentation capacity of nonstimulated, resting pDCs is unclear 26. Several lines of evidence of the present study suggest that resting pDCs did not directly engage cognate CD4+ T cells. Resting pDCs failed to induce any proliferation of cognate CD4+ T cells in MHCII‐deficient recipients. Moreover, as revealed by two‐photon microscopy, pDCs do not engage in any contacts with CD4+ T cells that would be a prerequisite for TCR activation or their conversion of naïve CD4+ T cells into regulatory T cells or the deletion of CD4+ T cells 27. As resting pDCs have a very low expression of MHCII and costimulatory molecules, it seems that in a nonactivated steady‐state resting pDCs do not have the adequate machinery to engage and prime cognate T cells. A study has suggested that in vitro generated pDCs and ex vivo isolated pDCs have different expression of MHC II molecules. Thus, it seems likely that in vitro differentiated pDCs behave differently from pDCs that develop naturally in tissues. To compare these pDC populations, we performed experiments with in vitro derived pDCs, and pDCs isolated from the BM of untreated WT mice. The results of the T‐cell priming assay obtained with these two pDC population however were very similar suggesting that the cells we used primarily in this study are suited to reflect a true in vivo situation.
Considering several reports suggesting that pDCs are indispensable for peripheral tolerance induction, we tested the hypothesis that pDCs might be more involved in carrying rather than presenting antigen 7, 14, 28, 29. Using MHCII‐deficient recipients, results of the present study very much support this idea. When adoptively transferred into WT recipients resting, antigen‐loaded pDCs induced abortive T‐cell proliferation and subsequent tolerance while no sign of pDC–T‐cell interactions, neither by functional readout nor by two‐photon microscopy could be observed in MHCII‐deficient recipients. These findings strongly indicate that LN‐resident APCs actually take over antigen from pDCs.
The intranodal positioning of resting pDCs following i.l. transfer largely excludes them from the T‐cell paracortex that is the putative site for antigen presentation by DCs in the LNs. While it might seem that the lack of spatial proximity between pDCs and CD4+ T cells could be a reason for lack of CD4+ T‐cell priming by pDCs in vivo, some results of this study suggest otherwise. The results of in vitro proliferation assay, wherein the migration of DCs does not play a role, also corroborate the result of the in vivo assay, suggesting that resting pDCs cannot prime CD4+ T cells. Moreover, in the ex vivo two‐photon imaging experiments we did observe spatial proximity between resting pDCs and OT‐II cells, however could not detect any stable contacts. These results suggest that resting pDCs fail to engage and prime CD4+ T cells even when they can get spatially close to them.
Using two‐photon microscopy and immunohistology we observed clusters of OT‐II cells during the priming state in draining LNs when WT mice were given ova‐loaded pDCs. However, OT‐II cells clustered around the endogenous CD11c+ DCs rather than the injected pDCs. These clusters localized in the outer paracortex. Most clusters were also proximal to the injected pDCs. This suggests that pDCs transfer antigen to the DCs spatially proximal to them and the positioning of pDCs, i.e. in the cortical region, does not prevent them from transferring antigen. Our experiments suggest that the transfer of antigen is not an exclusive function of pDCs but cells that do not have any antigen presentation function such as CD4+ T cells can also transfer antigen to endogenous APCs in WT recipients. However, antigen transfer is more relevant for resting pDCs in a physiological setting as results of our as well as some other studies suggest that resting pDCs are able to internalize antigens and cargo them to the draining LN. The exact mechanism by which pDCs can internalize exogenous antigen is still a matter of contention. pDCs are not known to be inefficient at macropinocytosis. However, it has been shown that they can internalize antigen via receptor‐mediated endocytosis using receptors such as BDCA‐2 (CLEC4C), Siglec‐H, or DCIR (CLEC4A) 26. Thus, while CD4+ T cells might transfer cell‐associated antigen to other APCs, resting pDCs have the potential to internalize exogenous antigen and can transfer them to endogenous APCs.
Antigen transfer between DC subsets has been previously demonstrated 9. However, the exact mechanism of antigen transfer still remains elusive. Several ways by which antigen transfer occurs could be envisaged, for example trogocytosis or exosome release 30. Cell‐associated antigen could also be transferred as a result of cell death 31. However, it is difficult to ascertain whether one or multiple mechanism are responsible for antigen transfer demonstrated in the present study.
Altogether our study strongly suggests that abortive proliferation of cognate T cells and subsequent tolerance can be achieved by transfer of antigen by pDCs. Different approaches to address DC function, such as passively loading DCs with antigen or targeting antigen to epitopes exclusively expressed by a particular DC subset, do not exclude the possibility of antigen transfer from one DC subset to another. It has been suggested that antigen exchange between DC subsets is crucial for immunity as well as tolerance 8, 9, 32. Our results emphasize on the phenomenon of antigen transfer and bring forth the importance of excluding antigen exchange when antigen presentation or tolerance induction properties of a particular APC need to be investigated.
Materials and methods
Mice
C756BL/6 mice were either bred at the Central Animal Facility of Hannover Medical School or were purchased from Charles River laboratories. All other transgenic or knockout strains were bred at the Central Animal Facility: B6.Cg‐Thy1a‐H2‐Aatm1Blt (termed here MHCII−/−), C57BL/6‐Tg(CAG‐EGFP)1Osb/J, expressing green fluorescent protein (GFP) under the control of a chicken β‐actin promotor (termed GFP‐mice), C57BL/6‐Tg(CAG‐ECFP), expressing cyan fluorescent protein (CFP) under the β‐actin promotor (termed CFP‐mice), B6.Cg‐Tg(TcraTcrb)425Cbn/J × B6.SJL‐Ptprca Pepcb/BoyJ mice (termed OT‐II), C57BL/6; B6.129P2(C)‐Ccr7tm1Rfor/J1, backcrossed on C57BL/6 for over 15 generations (termed Ccr7−/−), B6.Cg‐Tg(TcraTcrb)425Cbn/J, C57BL/6‐Tg(CAG‐OVA)916Jen/J expressing membrane‐bound chicken ovalbumin under control of the beta actin promoter (termed act‐m‐ova). All experiments have been approved by the institutional review board and the “Niedersächsisches Landesamt für Verbraucherschutz und Lebensmittelsicherheit”.
Antibodies and reagents
Anti‐B220 Cy5, anti‐B220 Cy3, anti‐CD62L Pacific Orange, anti‐CD4 Alexa488, anti‐IgD Cy5 and anti‐Lyve‐1 Cy3 were provided by E. Kremmer (Helmholtz Zentrum München, Munich, Germany). Anti‐CD4 PerCp, anti‐CD40 APC, anti‐CD80 APC, and anti‐CD45.1 PE were purchased from Bio‐legend. Anti‐CD11b PE‐Cy7, anti‐CD11c PE‐Cy7, anti‐CD3 PE, anti‐B220 PE, and anti‐CD45.1 FITC were purchased from eBioscience, San Diego, CA. Anti‐CD11b PE was purchased from Caltag Laboratories, Anti‐CD11c PE from BD Biosciences, and anti‐pDCA‐1 APC from Milteyni Biotec.
In vitro culture of pDCs and DCs
To generate pDCs in vitro, primary BM cells isolated from femur and tibia were cultured in RPMI 1640/10% FCS (+l‐glutamin/sodium‐pyruvate/penicillin/streptomycin/β‐mercaptoethanol) supplemented with Flt‐3L‐enriched supernatant from cultures of the Flt‐3L‐producing B16FL tumor cell line for 8–9 days. pDCs were sorted from a mixed population of DCs by FACS using anti‐B220 Cy5 and anti‐CD11b PECy7. pDCs were defined as the B220high and CD11bint population. BMDCs were generated similarly from primary BM cells cultured in RPMI 1640/10% FCS(+l‐glutamin/sodium‐pyruvate/penicillin/streptomycin/β‐mercaptoethanol) supplemented with GM‐CSF‐enriched supernatant from cultures of GM‐CSF‐transfected NIH.3T3 cells as described in 33. BMDCs represent conventional DCs.
For antigen loading, pDCs were loaded with 1mg/mL of endotoxin‐free ovalbumin protein (ova) (Invivogen). DCs were loaded with 1 mg/mL ova (Grade VI, Sigma) for 4. For activation, pDCs were stimulated with 1 μg/mL of R848 for 6 h and DCs were stimulated with 1 μg/mL LPS for 6 h. When required, pDCs or DCs were loaded with ova protein and stimulated with R848 or LPS respectively at mentioned concentrations.
In vivo expansion and MACS purification of pDC
C57BL/6 mice received 5–10 × 105 B16‐FL cells, a syngenic murine melanoma tumor cell line engineered to stably produce murine Flt3 ligand, by s.c. injection into the flanks, leading to the accumulation of DCs, including pDC, in LN and SPL 34. Depending on the speed of tumor growth, animals were sacrificed after 10–20 days, and LN and SPL were harvested. Untouched pDCs were isolated by MACS depletion using the Plasmacytoid Dendritic Cell Isolation Kit II in combination with an AutoMACS cell separator (Miltenyi). The target fraction contained 92–95% CD11cint PDCA‐1high (termed “ex vivo pDC”) after MACS separation.
Intralymphatic injection of cells
Preparation and canulation of popliteal LN afferent lymphatics of anesthetized mice were performed as described before 23. In some experiments brachial LN afferent lymphatics were prepared for injection. A total of 5 × 10⁴ pDCs or DCs, were injected for proliferation, tolerance, or intravital imaging studies. For coinjection of resting pDCs and activated DCs, 7.5 × 10⁴ resting GFP pDCs and 2.5 × 10⁴ activated CFP DCs were injected.
Isolation and transfer of transgenic CD4+ T cells
Single‐cell suspensions from spleen and LNs of CD45.1+ OT‐II mice were prepared and labeled for 10 min at 37°C with 3 mM cell proliferation dye eFluor 670 (eBioscience) or for 15 min at 37°C with 10 μM TAMRA (N,N,N′,N′‐tetramethyl‐5‐(and‐6‐)‐carboxyrhodamine succinimidyl ester (Invitrogen). OT‐II cells were isolated using the MACS CD4+ T‐cell isolation kit in combination with an AutoMACS separator (Miltenyi), yielding purities of >80% in all cases. For DTH experiments, 1 × 10⁵ efluor670‐labeled OT‐II cells were transferred i.v. into WT mice. For proliferation studies 2–4 × 10⁶ efluor670‐labeled OT‐II cells were transferred i.v. into WT or MHCII−/− mice. For intravital imaging 8–12 × 106 TAMRA‐labeled OT‐II cells were transferred intravenously into WT or MHCII−/− mice.
Intravital imaging of explanted LNs
LNs were excised and glued on a custom‐built perfusion chamber. During the imaging period, LNs were continuously superfused with prewarmed and oxygenated RPMI medium, thus providing a constant local temperature of 36.3–37°C and a pO2 of >75% of maximal saturation at all times. Two‐photon laser scanning microscopy was performed using an upright BX51‐WI microscope equipped with a 20× 0.95NA water immersion objective (Olympus), a TrimScope scanning unit (LaVision Biotech), and pulsed laser (Spectra‐Physics). For two‐photon excitation, the Ti:sapphire laser was set at 865 nm. Green (GFP) and red (TAMRA) fluorescence emission was split using 485 and 550 nm longpass filters and detected with nondescanned H6780 PMT detectors (Hamamatsu) fitted with 447/60, 535/50, and 610/75 bandpath filters, respectively. Z‐stacks of 21–31 images were acquired every 30 s for ∼ 1 h per time lapse recordings, providing imaging volumes 400 × 400 μm in XY and 100–150 μm in Z. Recorded images were analyzed using Imaris from Bitplane.
T‐cell proliferation assays
In vitro
A total of 5 × 10³ DCs with 2.5 × 10⁴ eFluor670‐labeled CD45.1+ OT‐II cells were put in culture for 4 days in RPMI 1640/10% FCS(+l‐glutamin/sodium‐pyruvate/penicillin/ streptomycin/β‐mercaptoethanol) in a total volume of 200 μL. After 4 days 100 μL was harvested and stained for FACS analysis. For counting of T cells, 1–2 × 10⁴ fluorescent counting beads were added before FACS acquisition.
In vivo
eFluor670‐labeled CD45.1+ OT‐II cells were transferred i.v. into WT or MHCII−/− recipients. On the same day, antigen‐loaded cells were transferred i.l. At designated time points mice were sacrificed and the LNs in which antigen‐loaded cells were injected were analyzed by flow cytometry. After gating on DAPI− leukocytes, the percentage and number of CD4+ CD45.1+ cells was calculated. To prevent the egress of proliferating T cells, mice were given FTY720 (6 μg) by oral gavage at day (d) 0 and from d1 onwards their drinking water had FTY720 (2–4 μg/mL).
Antigen uptake assay
In vitro
Cells were cultured in the presence of DQ‐OVA (10 μg/mL) at either 4o C or 37°C for 6 h.
In vivo
Fifty micrograms of DQ‐OVA was injected s.c. in the right foreleg or hind leg region.
Immunohistological analysis
LNs were fixed in PFA (2 plus 30% v/v sucrose) overnight and embedded and frozen In OCT. Eight micrometers of cryosections were blocked with 10% v/v rat serum in TBS‐T (Tris‐buffered saline + 0.05% v/v Tween 20) and stained with antibodies prepared in TBS‐T for 1 h. Nuclei were stained with DAPI. High‐resolution composite images were acquired with a Zeiss Axiovert 200M microscope.
Calculation of distance of cells from LN boundary
Cell distance from the LN boundary was measured as described 35. Boundaries of the LN were drawn manually. Cells were identified semiautomatically using Imaris. Using Image J plugins, “Analyze particles” and “Line graph,” coordinates of the LN boundary and cell spots were calculated. Using a “macro” of Visual Basic for Applications in Microsoft Excel the shortest distance of each cell from the LN boundary was calculated.
Induction and measurement of DTH responses
Seven days after activated DC transfer, mice were challenged by s.c. injection of 50 μg ova (Grade VI; Sigma‐Aldrich) in 20 μL PBS into the right ear pinna while 20 μL PBS without ova were injected into the left ear pinna for control purposes. Ear swelling was measured in a blinded fashion before and after 48 h injection with a custom‐built spring‐driven micrometer. Ova‐specific ear swelling was calculated as the following: (right ear thickness − left ear thickness)48 h − (right ear thickness − left ear thickness)0 h.
Statistical analyses
Statistical analyses were conducted using Prism4 (Graph Pad). For multiple groups one–way ANOVA was performed followed by a multiple comparison test.
Conflict of interest
The authors declare no financial or commercial conflict of interest.
Abbreviations:
- CFP
cyan fluorescent protein
- HEV
high endothelial venules
- i.l.
intralymphatic
- pDCs
plasmacytoid dendritic cells
- SLOs
secondary lymphoid organs
Supporting information
As a service to our authors and readers, this journal provides supporting information supplied by the authors. Such materials are peer reviewed and may be re‐organized for online delivery, but are not copy‐edited or typeset. Technical support issues arising from supporting information (other than missing files) should be addressed to the authors.
Plasmacytoid dendritic cells induce tolerance predominantly by cargoing antigen to lymph nodes.
eji3765‐sup‐0002‐movieS1
eji3765‐sup‐0003‐movieS2
eji3765‐sup‐0004‐figureS1‐S6
Acknowledgments
We thank Dr. Günter Bernhardt and Dr. Andreas Krueger for critically reading the manuscript. This work was supported by DFG‐grant SFB738‐B3 and ERC grant 322645‐LYMPHATICS‐HOMING to R.F.
References
- 1. van Meerwijk, J. P. , Marguerat, S. , Lees, R. K. , Germain, R. N. , Fowlkes, B. J. and MacDonald, H. R. , Quantitative impact of thymic clonal deletion on the T cell repertoire. J. Exp. Med. 1997. 185: 377–383. [DOI] [PMC free article] [PubMed] [Google Scholar]
- 2. Macian, F. , Im, S. H. , Garcia‐Cozar, F. J. and Rao, A. , T‐cell anergy. Curr. Opin. Immunol. 2004. 16: 209–216. [DOI] [PubMed] [Google Scholar]
- 3. Maldonado, R. A. and von Andrian, U. H. , How tolerogenic dendritic cells induce regulatory T cells. Adv. Immunol. 2010. 108: 111–165. [DOI] [PMC free article] [PubMed] [Google Scholar]
- 4. Steinman, R. M. , Hawiger, D. and Nussenzweig, M. C. , Tolerogenic dendritic cells. Annu. Rev. Immunol. 2003. 21: 685–711. [DOI] [PubMed] [Google Scholar]
- 5. Lewis, K. L. and Reizis, B. , Dendritic cells: arbiters of immunity and immunological tolerance. Cold Spring Harb Perspect Biol 2012. 4: a007401. [DOI] [PMC free article] [PubMed] [Google Scholar]
- 6. Ochando, J. C. , Homma, C. , Yang, Y. , Hidalgo, A. , Garin, A. , Tacke, F. , Angeli, V. et al, Alloantigen‐presenting plasmacytoid dendritic cells mediate tolerance to vascularized grafts. Nat. Immunol. 2006. 7: 652–662. [DOI] [PubMed] [Google Scholar]
- 7. de Heer, H. J. , Hammad, H. , Soullie, T. , Hijdra, D. , Vos, N. , Willart, M. A. , Hoogsteden, H. C. et al, Essential role of lung plasmacytoid dendritic cells in preventing asthmatic reactions to harmless inhaled antigen. J. Exp. Med. 2004. 200: 89–98. [DOI] [PMC free article] [PubMed] [Google Scholar]
- 8. Carbone, F. R. , Belz, G. T. and Heath, W. R. , Transfer of antigen between migrating and lymph node‐resident DCs in peripheral T‐cell tolerance and immunity. Trends Immunol. 2004. 25: 655–658. [DOI] [PubMed] [Google Scholar]
- 9. Allan, R. S. , Waithman, J. , Bedoui, S. , Jones, C. M. , Villadangos, J. A. , Zhan, Y. , Lew, A. M. et al, Migratory dendritic cells transfer antigen to a lymph node‐resident dendritic cell population for efficient CTL priming. Immunity 2006. 25: 153–162. [DOI] [PubMed] [Google Scholar]
- 10. Yoneyama, H. , Matsuno, K. , Zhang, Y. , Nishiwaki, T. , Kitabatake, M. , Ueha, S. , Narumi, S. , Morikawa, S. et al, Evidence for recruitment of plasmacytoid dendritic cell precursors to inflamed lymph nodes through high endothelial venules. Int. Immunol. 2004. 16: 915–928. [DOI] [PubMed] [Google Scholar]
- 11. Cella, M. , Jarrossay, D. , Facchetti, F. , Alebardi, O. , Nakajima, H. , Lanzavecchia, A. and Colonna, M. , Plasmacytoid monocytes migrate to inflamed lymph nodes and produce large amounts of type I interferon. Nat. Med. 1999. 5: 919–923. [DOI] [PubMed] [Google Scholar]
- 12. Diacovo, T. G. , Blasius, A. L. , Mak, T. W. , Cella, M. and Colonna, M. , Adhesive mechanisms governing interferon‐producing cell recruitment into lymph nodes. J. Exp. Med. 2005. 202: 687–696. [DOI] [PMC free article] [PubMed] [Google Scholar]
- 13. Wendland, M. , Czeloth, N. , Mach, N. , Malissen, B. , Kremmer, E. , Pabst, O. and Forster, R. , CCR9 is a homing receptor for plasmacytoid dendritic cells to the small intestine. Proc. Natl. Acad. Sci. U S A 2007. 104: 6347–6352. [DOI] [PMC free article] [PubMed] [Google Scholar]
- 14. Goubier, A. , Dubois, B. , Gheit, H. , Joubert, G. , Villard‐Truc, F. , Asselin‐Paturel, C. , Trinchieri, G. et al, Plasmacytoid dendritic cells mediate oral tolerance. Immunity 2008. 29: 464–475. [DOI] [PMC free article] [PubMed] [Google Scholar]
- 15. Nestle, F. O. , Conrad, C. , Tun‐Kyi, A. , Homey, B. , Gombert, M. , Boyman, O. , Burg, G. et al, Plasmacytoid predendritic cells initiate psoriasis through interferon‐alpha production. J. Exp. Med. 2005. 202: 135–143. [DOI] [PMC free article] [PubMed] [Google Scholar]
- 16. Gregorio, J. , Meller, S. , Conrad, C. , Di Nardo, A. , Homey, B. , Lauerma, A. , Arai, N. et al, Plasmacytoid dendritic cells sense skin injury and promote wound healing through type I interferons. J. Exp. Med. 2010. 207: 2921–2930. [DOI] [PMC free article] [PubMed] [Google Scholar]
- 17. Pascale, F. , Contreras, V. , Bonneau, M. , Courbet, A. , Chilmonczyk, S. , Bevilacqua, C. , Epardaud, M. et al, Plasmacytoid dendritic cells migrate in afferent skin lymph. J. Immunol. 2008. 180: 5963–5972. [DOI] [PubMed] [Google Scholar]
- 18. Yrlid, U. , Cerovic, V. , Milling, S. , Jenkins, C. D. , Zhang, J. , Crocker, P. R. , Klavinskis, L. S. et al, Plasmacytoid dendritic cells do not migrate in intestinal or hepatic lymph. J. Immunol. 2006. 177: 6115–6121. [DOI] [PubMed] [Google Scholar]
- 19. Hadeiba, H. , Lahl, K. , Edalati, A. , Oderup, C. , Habtezion, A. , Pachynski, R. , Nguyen, L. et al, Plasmacytoid dendritic cells transport peripheral antigens to the thymus to promote central tolerance. Immunity 2012. 36: 438–450. [DOI] [PMC free article] [PubMed] [Google Scholar]
- 20. Brawand, P. , Fitzpatrick, D. R. , Greenfield, B. W. , Brasel, K. , Maliszewski, C. R. and De Smedt, T. , Murine plasmacytoid pre‐dendritic cells generated from Flt3 ligand‐supplemented bone marrow cultures are immature APCs. J. Immunol. 2002. 169: 6711–6719. [DOI] [PubMed] [Google Scholar]
- 21. Bousso, P. , T‐cell activation by dendritic cells in the lymph node: lessons from the movies. Nat. Rev. Immunol. 2008. 8: 675–684. [DOI] [PubMed] [Google Scholar]
- 22. Mittelbrunn, M. , Martinez del Hoyo, G. , Lopez‐Bravo, M. , Martin‐Cofreces, N. B. , Scholer, A. , Hugues, S. , Fetler, L. et al, Imaging of plasmacytoid dendritic cell interactions with T cells. Blood 2009. 113: 75–84. [DOI] [PubMed] [Google Scholar]
- 23. Braun, A. , Worbs, T. , Moschovakis, G. L. , Halle, S. , Hoffmann, K. , Bolter, J. , Munk, A. et al, Afferent lymph‐derived T cells and DCs use different chemokine receptor CCR7‐dependent routes for entry into the lymph node and intranodal migration. Nat. Immunol. 2011. 12: 879–887. [DOI] [PubMed] [Google Scholar]
- 24. Ohl, L. , Mohaupt, M. , Czeloth, N. , Hintzen, G. , Kiafard, Z. , Zwirner, J. , Blankenstein, T. et al, CCR7 governs skin dendritic cell migration under inflammatory and steady‐state conditions. Immunity 2004. 21: 279–288. [DOI] [PubMed] [Google Scholar]
- 25. Penna, G. , Sozzani, S. and Adorini, L. , Cutting edge: selective usage of chemokine receptors by plasmacytoid dendritic cells. J. Immunol. 2001. 167: 1862–1866. [DOI] [PubMed] [Google Scholar]
- 26. Villadangos, J. A. and Young, L. , Antigen‐presentation properties of plasmacytoid dendritic cells. Immunity 2008. 29: 352–361. [DOI] [PubMed] [Google Scholar]
- 27. Shakhar, G. , Lindquist, R. L. , Skokos, D. , Dudziak, D. , Huang, J. H. , Nussenzweig, M. C. and Dustin, M. L. , Stable T cell‐dendritic cell interactions precede the development of both tolerance and immunity in vivo. Nat. Immunol. 2005. 6: 707–714. [DOI] [PMC free article] [PubMed] [Google Scholar]
- 28. Mouries, J. , Moron, G. , Schlecht, G. , Escriou, N. , Dadaglio, G. and Leclerc, C. , Plasmacytoid dendritic cells efficiently cross‐prime naive T cells in vivo after TLR activation. Blood 2008. 112: 3713–3722. [DOI] [PMC free article] [PubMed] [Google Scholar]
- 29. Hadeiba, H. , Sato, T. , Habtezion, A. , Oderup, C. , Pan, J. and Butcher, E. C. , CCR9 expression defines tolerogenic plasmacytoid dendritic cells able to suppress acute graft‐versus‐host disease. Nat. Immunol. 2008. 9: 1253–1260. [DOI] [PMC free article] [PubMed] [Google Scholar]
- 30. Nakayama, M. , Antigen Presentation by MHC‐Dressed Cells. Front Immunol 5: 672. [DOI] [PMC free article] [PubMed] [Google Scholar]
- 31. Inaba, K. , Turley, S. , Yamaide, F. , Iyoda, T. , Mahnke, K. , Inaba, M. , Pack, M. et al, Efficient presentation of phagocytosed cellular fragments on the major histocompatibility complex class II products of dendritic cells. J. Exp. Med. 1998. 188: 2163–2173. [DOI] [PMC free article] [PubMed] [Google Scholar]
- 32. Yewdall, A. W. , Drutman, S. B. , Jinwala, F. , Bahjat, K. S. and Bhardwaj, N. , CD8+ T cell priming by dendritic cell vaccines requires antigen transfer to endogenous antigen presenting cells. PLoS One 2010. 5: e11144. [DOI] [PMC free article] [PubMed] [Google Scholar]
- 33. Inaba, K. , Inaba, M. , Romani, N. , Aya, H. , Deguchi, M. , Ikehara, S. , Muramatsu, S. et al, Generation of large numbers of dendritic cells from mouse bone marrow cultures supplemented with granulocyte/macrophage colony‐stimulating factor. J. Exp. Med. 1992. 176: 1693–1702. [DOI] [PMC free article] [PubMed] [Google Scholar]
- 34. Mach, N. , Gillessen, S. , Wilson, S. B. , Sheehan, C. , Mihm, M. and Dranoff, G. , Differences in dendritic cells stimulated in vivo by tumors engineered to secrete granulocyte‐macrophage colony‐stimulating factor or Flt3‐ligand. Cancer. Res. 2000. 60: 3239–3246. [PubMed] [Google Scholar]
- 35. Ulvmar, M. H. , Werth, K. , Braun, A. , Kelay, P. , Hub, E. , Eller, K. , Chan, L. et al, The atypical chemokine receptor CCRL1 shapes functional CCL21 gradients in lymph nodes. Nat. Immunol. 2014. 15: 623–630. [DOI] [PubMed] [Google Scholar]
Associated Data
This section collects any data citations, data availability statements, or supplementary materials included in this article.
Supplementary Materials
As a service to our authors and readers, this journal provides supporting information supplied by the authors. Such materials are peer reviewed and may be re‐organized for online delivery, but are not copy‐edited or typeset. Technical support issues arising from supporting information (other than missing files) should be addressed to the authors.
Plasmacytoid dendritic cells induce tolerance predominantly by cargoing antigen to lymph nodes.
eji3765‐sup‐0002‐movieS1
eji3765‐sup‐0003‐movieS2
eji3765‐sup‐0004‐figureS1‐S6