Abstract
To differentiate subtypes of microglia (MG), we developed a novel monoclonal antibody, 9F5, against one subtype (type 1) of rat primary MG. The 9F5 showed high selectivity for this cell type in Western blot and immunocytochemical analyses and no cross‐reaction with rat peritoneal macrophages (Mφ). We identified the antigen molecule for 9F5: the 50‐ to 70‐kDa fragments of rat glycoprotein nonmetastatic melanoma protein B (GPNMB)/osteoactivin, which started at Lys170. In addition, 9F5 immunoreactivity with GPNMB depended on the activity of furin‐like protease(s). More important, rat type 1 MG expressed the GPNMB fragments, but type 2 MG and Mφ did not, although all these cells expressed mRNA and the full‐length protein for GPNMB. These results suggest that 9F5 reactivity with MG depends greatly on cleavage of GPNMB and that type 1 MG, in contrast to type 2 MG and Mφ, may have furin‐like protease(s) for GPNMB cleavage. In neonatal rat brain, amoeboid 9F5+ MG were observed in specific brain areas including forebrain subventricular zone, corpus callosum, and retina. Double‐immunοstaining with 9F5 antibody and anti‐Iba1 antibody, which reacts with MG throughout the CNS, revealed that 9F5+ MG were a portion of Iba1+ MG, suggesting that MG subtype(s) exist in vivo. We propose that 9F5 is a useful tool to discriminate between rat type 1 MG and other subtypes of MG/Mφ and to reveal the role of the GPNMB fragments during developing brain. GLIA 2016;64:1938–1961
Keywords: development, GPNMB/osteoactivin, microglial heterogeneity, retinal pigment epithelium
Introduction
Microglia (MG) are immune cells in the CNS and can protect it against infection and injuries via phagocytosis, antigen presentation, and cytokine secretion (Kreutzberg, 1996). During development, MG invade CNS tissue at very early stages, before or simultaneously with neurogenesis (Dalmau et al., 1997). Evidence now suggests that MG at such developmental stages may be associated with the need to phagocytose debris and apoptotic neurons after brain development and to deliver growth factors and cytokines to support cell proliferation and neuronal organization (Bessis et al., 2007; Cuadros and Navascues, 1998; Hanisch, 2002; Streit, 2001). MG are also involved in synaptic pruning in developing mouse brain (Paolicelli et al., 2011; Stevens et al., 2007).
Recent reports suggest that two or more subtypes of MG may exist in the CNS. Andjelkovic et al. (1998) suggested that MG have a dual origin, the first being yolk‐sac macrophages (Mφ) during the nonvascularized prenatal stage, followed by the second, as circulating monocytes engraft in the postnatal brain. Independent studies have also suggested this hypothesis (for review, see Chan et al., 2007), and fate‐mapping analysis revealed that almost all MG in adult brain derive from yolk‐sac Mφ (Ginhoux et al., 2010). Apart from arguments about the origins of MG, several additional papers reported on MG heterogeneity. In the absence of pathological situations, human MG that are positive for MHC class II and CD4 are preferentially found in white matter, rather than gray matter, brain regions (Hayes et al., 1987). Rat hippocampal MG express higher levels of mRNAs for tumor necrosis factor‐α, CD4, and Fcγ receptor type II (CD32) than do MG from the diencephalon, tegmentum, cerebellum, and cerebral cortex (Ren et al., 1999). Bulloch et al. (2008) showed that CD11c+ dendritic cells reside among the heterogeneous MG population in normal mouse brain. These results strongly suggest that heterogeneity of MG subtypes exists in the CNS.
We previously demonstrated that interleukin (IL)−4‐stimulated uptake and degradation of β‐amyloid peptide were selectively enhanced in one MG subtype, i.e., type 2 MG, but not in type 1 MG that express CD40 (Shimizu et al., 2008). We also showed a marked induction of inducible nitric oxide synthase and tumor necrosis factor‐α in type 1 MG compared with type 2 MG under inflammatory conditions (Kawahara et al., 2009). These results suggest that these two MG subtypes may play different neuro‐immunomodulatory roles in diseased brains. However, the lineages and functions of these subtypes in the brain remain largely unknown. The lack of specific tools to differentiate such subtypes is a key issue for these investigations. In addition, the characterization of MG is even more difficult than that of neurons and other glial cells because MG share several antigens with peripheral Mφ (e.g., CD11b, CD68, Iba1, and others). Therefore, developing tools to differentiate MG and Mφ accurately and easily is necessary.
Here, we report the development of a novel monoclonal antibody, 9F5, which not only showed no cross‐reactivity with peritoneal Mφ but also recognized a fraction of the total MG population. We also determined that the antigen protein for 9F5 consists of fragments of rat transmembrane glycoprotein nonmetastatic melanoma protein B(GPNMB)/osteoactivin processed by furin‐like protease(s). Type 1 MG but neither type 2 MG nor Mφ expressed the antigen molecule for 9F5. By using 9F5 antibody, we demonstrated the existence of truncated GPNMB+ MG in vivo.
Materials and Methods
Animals
Wistar rats and BALB/c mice were obtained from Kyudo and Japan SLC, respectively. Gpnmb mutant mice [Gpnmb^tm1(Gfp)Mcf] were generated as described in Supporting Information. The day after overnight mating was considered embryonic day 0 (E0), and the day of birth was designated postnatal day 0 (P0). Animals were treated according to the Guidelines of the Institutional Animal Care and Use Committee of Kumamoto University and UNITECK and the Animal Care Committee of Niigata University of Pharmacy and Applied Life Sciences.
Cell Culture
Primary type 1 and type 2 MG were harvested from primary mixed glial cell cultures prepared from neonatal Wistar rat pups as previously reported (Sawada et al., 1990; Shimizu et al., 2008; Suzumura et al., 1987). Type 1 MG were stimulated with Escherichia coli lipopolysaccharide (LPS; 0.1 µg ml−1; serotype 0127:B8; Sigma–Aldrich) for 24 hr, and type 2 MG were stimulated with rat IL‐4 (5 ng ml−1; PeproTech EC) for 96 hr. These MG were stored at −80°C until use. Primary rat neurons, astrocytes, and neuroepithelial cells were prepared and cultured as described previously (Nakashima et al., 1999; Tajiri et al., 2004). Primary rat peritoneal Mφ and thioglycolate‐elicited Mφ were obtained as described previously (Woo et al., 1990). The murine MG cell lines Ra2, 6‐3, and MG5 were maintained as described previously (Kanzawa et al., 2000; Ohsawa et al., 1997). Monkey kidney COS‐7 cells and human HEK293 cells were cultured in Dulbecco's modified Eagle's medium supplemented with 10% fetal bovine serum. Rat primary type 1 MG was treated with rat recombinant IL‐12 (10 ng ml−1; R&D Systems).
Establishment of Mouse Hybridoma Clones
Female BALB/c mice (6 weeks old, n = 8) were immunized with an intraperitoneal injection of four kinds of rat primary MG (type 1 MG, LPS‐stimulated type 1 MG, type 2 MG, or IL‐4‐stimulated type 2 MG) (1 ×10⁷ cells/mouse, two mice per group) emulsified in an equal volume of Freund's complete adjuvant. After 3 weeks, the immunization was repeated five times at 2‐week intervals with the cells (5 ×10⁶ cells/mouse per immunization) in Freund's incomplete adjuvant. Three days after the final injection, the spleens were removed and splenocytes were fused with P3U1 myeloma cells by using polyethylene glycol 1500 (Roche Molecular Biochemicals) according to an established procedure (Koehler and Milstein, 1975). Hybridoma cells corresponding to supernatants that had positive reactions to lysates of rat MG and negative reactions to lysates of rat Mφ were cloned by using the limiting dilution procedure. One monoclonal antibody identified in this study was designated 9F5 and was determined to be IgG1 by using IgFast, the Mouse Monoclonal Antibody Isotyping Kit (BioCytex). The 9F5 was purified from ascites by precipitation with 40% saturated ammonium sulfate and separation via protein A‐Sepharose column chromatography (GE Healthcare UK). For some experiments, 9F5 antibody was biotinylated via EZ‐Link Sulfo‐NHS‐LC‐biotin (Pierce Biotechnology) according to the manufacturer's recommendations.
Immunoblot Analysis
Immunoblot analysis was performed as described previously (Kawahara et al., 2009). The blotted membraneswere incubated with one of the following antibodies: 9F5 (1 µg ml−1), ED1 (1 µg ml−1; MCA341GA; Serotec), rabbit anti‐Iba1 (1 µg ml−1;019‐19741; Wako), goat anti‐GPNMB (1 µg ml−1;AF2330; R&D Systems), rabbit anti‐furin (1:500; PA1‐062; Affinity BioReagents), goat anti‐CD40 (1:100; T‐20; Santa CruzBiotechnology), goat anti‐CD86 (1:500; 421340; Genezyme Techne), or mouse anti‐β‐actin (1:2,000; AC15; Sigma–Aldrich) antibodies.
To determine the amount of N‐linked glycosylation, the cell lysate from rat type 1 MG was first denatured in 1% sodium dodecyl sulfate (SDS) (5 min, 60°C). Deglycosylation was then performed with 60 U ml−1 peptide‐N‐glycosidase F (PNGase F;Boehringer Mannheim) in phosphate buffer [0.2M Na2HPO4‐NaOH (pH 7.5) containing 10 mM EDTA, 0.5% NonidetP‐40, and protease inhibitors] for 24 hr at 37°C (SDS concentration during the PNGase F incubation: 0.05%). O‐Glycan chains were analyzed via digestion with α‐2,3,6,8,9‐neuraminidase (sialidase; Calbiochem) and endo‐α‐N‐acetylgalactosaminidase (O‐glycosidase; Calbiochem), according to the manufacturer's instructions. Removal of sugar chains was analyzed by using SDS‐PAGE and immunoblotting as described above.
Immunocytochemical Analysis
Mixed glial cells prepared from neonatal Wistar rat brains (P1) were plated on eight‐well Lab‐Tek chamber slides (Nalge Nunc International) and cultured for 10 days. Rat type 1 MG, type 2 MG, and peritoneal Mφ were plated on the chamber slides and cultured for 1 day. The cells were then incubated with 9F5 (1 µg ml−1; mouse IgG1), rabbit anti‐Iba1 (2.5 µg ml−1; Wako), or the isotype matched controls. Alexa Fluor 488‐ or 594‐labeled second antibody (1:500; Molecular Probes) was used. For double‐staining with 9F5 and anti‐lysosomal‐associated membrane protein‐1 (LAMP‐1; 1 µg ml−1; Ly1C6, mouse IgG1;Stressgen Bioreagents), the Zenon labeling kit (Molecular Probes) was used. Stained cells were observed with a confocal laser scanning microscope (Fluoview, Olympus).
Plasmids and Transfection
The rat Gpnmb cDNA clone was isolated via RT‐PCR with total RNA from rat type 1 MG. PCR was carried out with rat Gpnmb primers corresponding to nucleotides 53‐1860 (GenBank, accession no. BC061725). The product obtained was inserted into pGEM‐T easy vector (Promega Corp.) to yield pGEM‐T‐rGpnmb. To construct pcDNA3.1‐Gpnmb, Gpnmb cDNA was released by EcoRI digestion and then subcloned into the EcoRI site of pcDNA3.1 (+; Invitrogen). Expression plasmids for rat α1‐PDX, a variant of α1‐antitrypsin (AVPM352/RVPR352), and murine furin were used (Tsuji et al., 2002). The α1‐PDX cDNA and furin cDNA were subcloned into the BamHI/EcoRI sites and into the HindIII/XbaI sites of pcDNA3.1(+), respectively. Small interfering RNA (siRNA) targeting for human furin (21 oligonucleotides; Pesu et al., 2006) was obtained from Sigma–Aldrich. COS‐7 cells were transfected with plasmids via Effectene Transfection Reagent (QIAGEN) according to the manufacturer's protocol. HEK293 cells were cotransfected with plasmids and siRNA by using TransMessenger Transfection Reagent (QIAGEN). As a negative control, the same amount of insert‐less plasmid was transfected.
For the immunostaining assay, at 72 hr after transfection, cells were fixed in 4% paraformaldehyde in PBS for 10 min and treated with PBS containing 0.05% Triton X‐100. Cells were then incubated with 9F5 (1 µg ml−1) and goat anti‐GPNMB antibody (AF2330, 1 µg ml−1) and then with Alexa Fluor488‐ or 594‐labeled antibodies against mouse or goat immunoglobulins (1:500; Molecular Probes).
Fluorescence intensities were quantified as described previously (Kawahara et al., 2012). After photomicrographs were imported into the Scion Image system (NIH), they were quantified via NIH ImageJ software (National Institutes of Health; http://rsb.info.nih.gov/nih-image/). A manually set threshold intensity was kept constant, and the number of pixels in 9F5‐ and anti‐GPNMB antibody‐immunostained cells in an area measuring 400 × 400 µm2 was determined. At least three areas were quantified per one transfection. The total data for three or four experiments were expressed as means ± SEM.
RNA Blot Analysis
The total RNA from cells and rat brain were prepared by using the Isogen reagent (Nippon Gene) according to the manufacturer's recommendations. After electrophoresis through formaldehyde‐containing agarose gels, RNAs were transferred to nylon membranes. Digoxigenin‐labeled antisense RNA probes were synthesized, via a transcription kit (Roche Molecular Biochemicals), from rat Gpnmb cDNA at nucleotide positions 1208‐1860 (GenBank, accession no. BC061725) and rat Glyceraldehyde‐3‐phosphate dehydrogenase cDNA at nucleotide positions 239–1042 (GenBank, accession no. M17701). Hybridization, washing, and chemiluminescent detection of the membranes were performed as recommended by Roche Diagnostics. Filters were analyzed with LAS‐1000 Plus (Fuji Photo Film).
Immunoprecipitation and Amino Acid Sequence Analysis
Antibodies were bound to Protein G‐Sepharose 4 Fast Flow gel (GE Healthcare) by incubating 10 µl of ascites fluid (diluted 1:10 in Tris‐buffered saline) with 30 µl of the swollen gel in buffer A [10 mM Tris‐HCl (pH 7.2), 150 mM NaCl and 0.1% (v/v) Triton X‐100] for 2 hr. The gel was washed with buffer A before adding lysates of type 1 MG for overnight incubation at 4°C. After the sample was washed with buffer A, immunoprecipitated proteins were extracted from the gel with a sampling buffer for SDS‐PAGE [50 mM Tris‐HCl (pH 6.8), 4% (w/v) SDS, and 12% (v/v) glycerol] for 10 min at 60°C and were separated by SDS‐PAGE and then transferred to PVDF membranes. The blotted membranes were stained with Coomassie Brilliant Blue R250, and the major bands with an estimated molecular weight (mol wt) of 50–70 kDa were extracted and analyzed by using a microsequencer (Procise 492; Perkin Elmer Applied Biosystems).
Immunohistochemical Analysis
Wistar rats and mice were anesthetized with pentobarbital and perfused through the left cardiac ventricle with 4% paraformaldehyde in PBS. The brains were removed and cryoprotected in sucrose. Frozen sections (20 µm) were cut on a cryostat and thaw‐mounted on glass microscope slides (S9445; Matsunami Glass Industries). Fixed sections were incubated at room temperature for 1 hr in 5% normal goat serum in PBS, followed by overnight incubation in one of the following antibodies: 9F5 (1 µg ml−1), biotin‐conjugated 9F5 (1 µg ml−1), anti‐Iba1 (2.5 µg ml−1), rabbit anti‐NG2 (0.5 µg ml−1; AB5320; Chemicon International), mouse anti‐nestin (1:2,000; Rat‐401; Chemicon International), goat anti‐glial fibrillary acidic protein(GFAP) (2 µg ml−1; sc‐6170;Santa Cruz Biotechnology), rabbit anti‐laminin (2.5 µg ml−1; L9393; Sigma–Aldrich), anti‐MITF (1:30; C5 + D5; GeneTex), or goat anti‐GPNMB (1 µg ml−1; AF2330; R&D systems) antibodies. The sections were washed in PBS three times for 10 min each time, followed by a 2‐hr incubation with Alexa Fluor488‐ or 594‐labeledsecondary antibodies, or Alexa Fluor488‐ or 594‐labeled streptavidin (1:400; Molecular Probes). The specimens were examined with the confocal laser scanning microscope (Fluoview FV‐300, Olympus; LSM700, Carl Zeiss).
The extravidin‐biotin peroxidase technique was used for some sections tovisualize the label. Endogen peroxidase activity was eliminated from these sections by incubating them with 0.3% hydrogen peroxide in methanol for 15 min. The sections were incubated at room temperature for 1 hr in 5% normal goat serum in PBS and then reacted with 9F5 (1 µg ml−1), ED1 (2.5 µg ml−1), OX6 (5 µg ml−1; MCA46GA; Serotec), or anti‐Iba1 (2.5 µg ml−1) at room temperature for 2 hr. After excess antibody was washed out with PBS, the sections were incubated with the corresponding biotinylated secondary antibody (1:200, Chemicon International) for 1 hr. The sections were incubated with extravidin‐peroxidase complex (Vector Laboratories) at room temperature for 30 min. The presence of peroxidase was revealed by incubation with a diaminobenzidine solution withnickel enhancement or with a diaminobenzidine solution. Finally, sections were coverslipped with NEW MX (Matsunami Glass Industries).
Statistical Analysis
All data were expressed as means± SEM. For comparisons of three or more groups, we applied Dunnett's multiple comparison test after one‐way ANOVA. All statistical analyses including a two‐way ANOVA with the Bonferroni post hoc test were performed with GraphPad Prism (GraphPad Software). Significance was defined as P values of <0.05.
Results
Characterization of Monoclonal Antibody 9F5 By Western Blotting: Its Selective Reactivity With Type 1 MG
We separated types 1 and 2 MG from a rat mixed glial cell culture using a described method (Sawada et al., 1990; Shimizu et al., 2008; Suzumura et al., 1987). We confirmed that the expression levels of CD40 and CD86 were higher in type 1 MG than those in type 2 MG (Fig. 1C,D), as previously reported (Kanzawa et al., 2000). Each MG preparation was then used to generate new monoclonal antibodies. We used four kinds of cells as antigens: stimulus‐(−) type 1 MG and type 2 MG, and selectively activated cells of each subtype:type 1 MG stimulated with LPS (Kawahara et al., 2009) and type 2 MG stimulated with IL‐4 (Shimizu et al., 2008).
Figure 1.
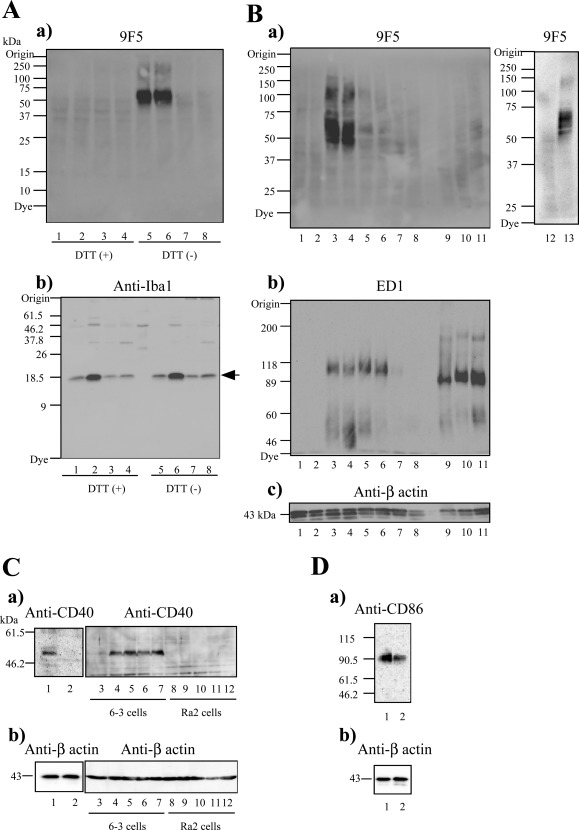
Analysis of 9F5 selectivity for rat type 1 microglia (MG) by Western blot (WB) analysis. A: WB analyses with 9F5 (a) and anti‐Iba1 antibody (b) under DTT (+) (lanes 1–4) and DTT (−) (lanes 5–8) conditions. Cell extracts (20 µg) were from rat type 1 MG (lanes 1, 5), lipopolysaccharide (LPS)‐stimulated rat type 1 MG (lanes 2, 6), rat type 2 MG (lanes 3, 7), and interleukin (IL)−4‐stimulated rat type 2 MG (lanes 4, 8). B: WB analyses with 9F5(a), ED1 (b), and anti‐β‐actin (c) antibodies under DTT (−) conditions. Extracts (20 µg) were from mouse 6‐3 MG (lane 1), mouse Ra2 MG (lane 2), rat type 1 MG (lanes 3, 13), LPS‐stimulated rat type 1 MG (lane 4), rat type 2 MG (lane 5), IL‐4‐stimulated rat type 2 MG (lane 6), rat neurons (lane 7), astrocytes (lane 8), peritoneal rat macrophages (Mφ) (lane 9), LPS‐stimulated peritoneal rat Mφ (lane 10), thioglycolate‐elicited rat Mφ (lane 11), and rat neuroepithelial cells (lane 12). C, D: WB analyses with anti‐CD40 (Ca), anti‐CD86 (Da), or anti‐β‐actin (Cb, Db) antibodies. Extracts (40 µg) were from rat type 1 MG (lane 1) or rat type 2 MG (lane 2).Cell extracts from 6‐3 and Ra2 were used as positive and negative controls for immunoblotting with anti‐CD40 antibody. The 6–3 and Ra2 cells were treated with LPS [0 µg ml−1 (lane 3, 8), 0.01 µg ml−1 (lane 4, 9), 0.1 µg ml−1 (lane 5, 10), 1 µg ml−1 (lane 6, 11), and 10 µg ml−1 (lane 7, 12)] for 12 hr.
By immunizing BALB/c mice with LPS‐stimulated type 1 MG, we obtained the monoclonal antibody 9F5. First, 9F5 reactivity with type 1 and type 2 MG was examined by WB blot (WB) analysis. Figure 1Aa showed that 9F5 reacted with 50‐ to 70‐kDa polypeptides of type 1 MG under DTT (−) conditions. Under DTT (+) conditions, 9F5 showed no reaction, indicating that 9F5 recognized a nonreduced epitope of antigen in type 1 MG. In contrast, the antibody against Iba1 reacted with types 1 and 2 MG in a similar fashion (Fig. 1Ab). After LPS stimulation of type 1 MG, anti‐Iba1‐reactive proteins were increased, whereas 9F5‐reactive proteins were unchanged. This result suggests that expression of antigen molecules for 9F5 and anti‐Iba1, was differentially regulated in type 1 MG. Figure 1B shows comparative results of WB analyses with 9F5 and ED1 (another antibody recognizing Mφ/MG) in MG, Mφ, neurons, and astrocytes under DTT (−) conditions. ED1 reacted with peritoneal Mφ and thioglycolate‐elicited Mφ as expected and reacted similarly with types 1 and 2 MG. In contrast, 9F5 reacted differently: most strongly with type 1 MG, faintly with type 2 MG, and barely with thioglycolate‐elicited Mφ. The 9F5 reactivity with type 2 MG, although faintly, will be described in Discussion. The 9F5 did not react with peritoneal Mφ, neurons, and astrocytes. These results indicate that 9F5 reactivity is highly selective for type 1 MG. Neither 9F5 nor ED1 reacted with mouse MG cell lines, such as 6‐3 and Ra2, as expected, because both antibodies were obtained from immunized mice.
Immunocytochemical Reactivity of 9F5 With Different MG Preparations and Peritoneal Mφ
To evaluate immunocytochemical reactivity of 9F5, we first tested 9F5 with mixed cell preparations including MG and astrocytes. As Fig. 2Aa shows, 9F5 stained the cells. However, double‐immunοstaining with 9F5 and anti‐Iba1 revealed that 9F5 reacted with Iba1+ cells, but the number of 9F5+ cells was lower than that of Iba1+ cells (Fig. 2Ac). To clarify which MG type in the mixed cells was responsible for 9F5 staining, we evaluated rat primary types 1 and 2 MG, which were separated from the mixed cells (Fig. 2B). For this analysis, astrocytes were excluded because all 9F5+ cells were included as part of the anti‐Iba1‐positive cells (anti‐Iba1 being an MG marker) (Fig. 2Ac). Peritoneal Mφ were used as another control. Rat primary type 1 MG, type 2 MG, or peritoneal Mφ were evaluated by double‐staining with 9F5 and anti‐Iba1. The 9F5 strongly reacted with type 1 MG (Fig. 2Ba). Type 2 MG and peritoneal Mφ, however, showed very weak reactivity with 9F5 (Fig. 2Be,i). In contrast, anti‐Iba1 strongly reacted with all MG/Mφ populations (Fig. 2Bb,f,j). Only type 1 MG were double‐positive for 9F5 and anti‐Iba1 (Fig. 2Bc). In addition, 9F5 immunoreactivity co‐localized with the lysosomal protein Lamp‐1 (Fig. 2C), which suggests that the antigen molecule for 9F5 is localized in lysosomes. 9F5 + Iba1+ MG (type 1) had a rounder and more amoeboid shape (Fig. 2Bc) compared with 9F5‐Iba1 + MG (type 2), which had a more ramified form (Fig. 2Bg). Although 9F5 reacted more weakly with type 2 MG in immunoblot analysis (Fig. 1Ba), we observed that 9F5+ cells in the type 2 cultured cells showed round and amoeboid shape of MG cells (Fig. 2Be–g), suggesting the possibility that cultured type 2 cell preparations were contaminated with a little of 9F5+ type 1 MG. To confirm this, we further stained the cells with antibody against CD40, a marker for type 1 MG (Kanzawa et al., 2000), and observed that CD40+ cells were expressed in a round and amoeboid shape of MG in mouse mixed glial cell culture (Supporting Information Fig. 3B). We examined the CD40+ cells in mouse mixed glial cell culture, because anti‐rat CD40 antibody for immunocytochemistry was not commercially available. These data indicate that 9F5 is selective for a round and amoeboid shape of MG (type 1) in vitro, and will be a useful tool for MG research.
Figure 2.
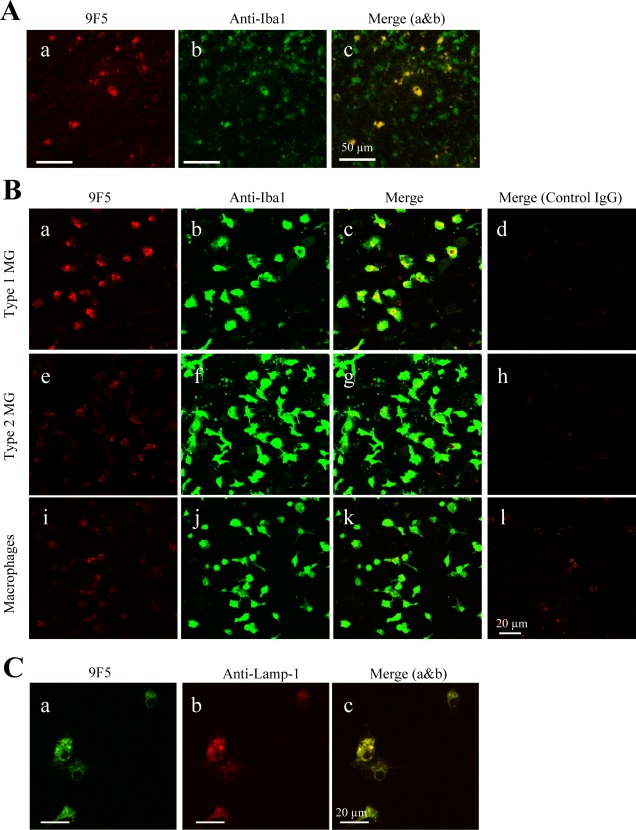
Immunocytochemical staining of rat type 1 MG with 9F5. A: Mixed glial cells (DIV10) were incubated with 9F5 (a) or anti‐Iba1 antibody (b). Fluorescence signals are shown individually (a, b) and after merging (c). B: Rat primary type 1 MG (a–d), rat type 2 MG (e–h), and peritoneal rat Mφ (i–l) were incubated with 9F5 or anti‐Iba1 antibody. Mouse IgG1 and rabbit IgG were used as negative controls (d, h, l). Fluorescence signals are shown individually and after merging. C: Rat type 1 MG were double‐stained with 9F5 (a) and anti‐lysosomal‐associated membrane protein‐1 (anti‐LAMP‐1) antibody (b). [Color figure can be viewed in the online issue, which is available at wileyonlinelibrary.com.]
Identification of Rat GPNMB Starting at Lys‐170 as the Antigen Protein for 9F5
To identify this antigen protein, samples immunoprecipitated with 9F5 were subjected to SDS‐PAGE, and major bands with estimated mol wt 50–70 kDa were analyzed by using an N‐terminal amino acid sequencer (Fig. 3). Edman sequencing of the bands revealed an amino acid sequence of KWNFVYVFHTLGQYFQKLGRXSARVS (Fig. 3C), which corresponds to Lys‐170 to Ser‐195 of rat GPNMB/osteoactivin.
Figure 3.
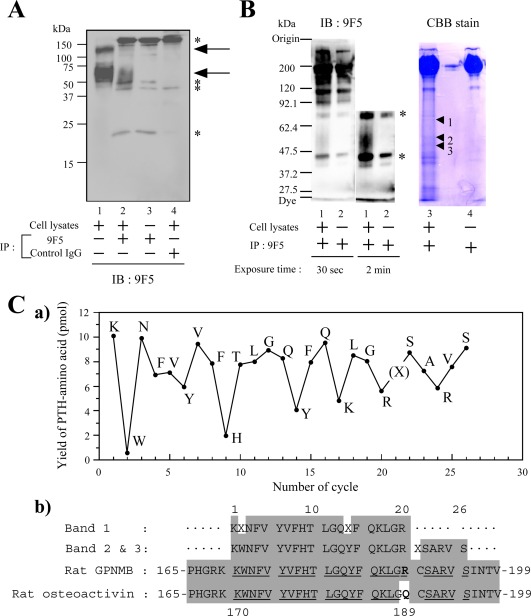
Identification of rat GPNMB protein for 9F5 antigen by using both immunoprecipitation (IP) and microsequencing. A: Lysates of rat type 1 MG were immunoprecipitated by 9F5 or control IgG and then immunoblotted with 9F5. Arrows indicate staining specific for 9F5. Asterisks indicate nonspecific staining. B: Lysates of rat type 1 MG were immunoprecipitated by 9F5, subjected to SDS‐PAGE, and then transferred to PVDF membranes. Membranes were evaluated via immunoblotting (lanes 1, 2) or staining with Coomassie Brilliant Blue R250 (CBB) (lanes 3, 4), and the major bands with estimated mol wt 50–70 kDa (lane 3, bands 1–3) were extracted and analyzed by using a microsequencer (C). Asterisks indicate nonspecific staining. Ca: Yield of phenylthiohydantoin (PTH)‐amino acid per cycle number (bands 2, 3). b: Amino acid sequence comparison of the N‐terminal amino acid sequence of bands 1–3 with rat GPNMB (AAH61725) and rat osteoactivin (NP_579832). Shading indicates the residues matched with rat GPNMB. [Color figure can be viewed in the online issue, which is available at wileyonlinelibrary.com.]
To confirm that the GPNMB fragments are the antigen for 9F5, we constructed cDNA for rat Gpnmb and expressed it in COS‐7 cells. An immunocytochemical analysis revealed that the 9F5 antibody reacted with the pcDNA3.1‐Gpnmb‐transfected cells and that all 9F5+ cells overlapped with cells positive for the anti‐GPNMB polyclonal antibody (AF2330; R&D Systems; Fig. 4A). In a WB analysis using anti‐GPNMB antibody, expression of rat GPNMB with mol wt 125 and 95 kDa was observed in transfected cells (Fig. 4B). In addition, an immunoprecipitation‐WB analysis with 9F5 and anti‐GPNMB antibody, respectively, revealed that the band with estimated mol wt 50–70 kDa was detected in pcDNA3.1‐Gpnmb‐transfected cells (Fig. 4C, lane 1). Comparative WB analysis showed that anti‐GPNMB antibody reacted with the mol wt 50‐ to 70‐kDa fragments of GPNMB, in addition to its intact forms with mol wt 95 and 125 kDa in type 1 MG (Fig. 4D). Furthermore, polypeptides of mol wt 50–70 kDa in type 1 MG were immunoprecipitated by means of anti‐GPNMB antibody and detected by WB analysis with 9F5 (Fig. 4E). All these results indicate that antigen molecule for 9F5 consists of the 50‐ to 70‐kDa fragments of rat GPNMB and that the N‐terminal amino acid is Lys‐170.
Figure 4.
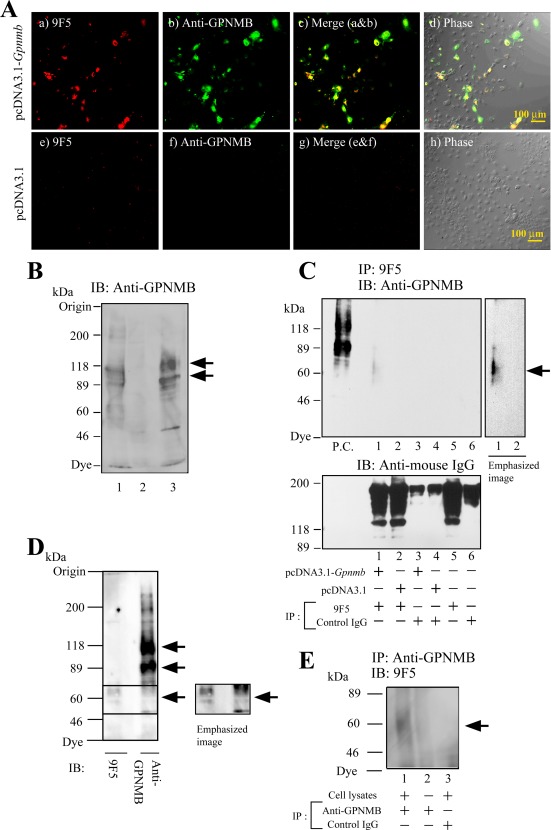
Recognition by 9F5 of GPNMB protein in rat GpnmbcDNA‐transfected COS‐7 cells. A–C: COS‐7 cells were transfected with pcDNA3.1‐Gpnmb or a pcDNA3.1 empty vector for 72 hr. A: Cells were double‐stained with 9F5 and a commercially available goat anti‐mouse GPNMB polyclonal antibody. d, h: Phase‐contrast images. B: Cell lysates were from COS‐7 cells transfected with pcDNA3.1‐Gpnmb (lane 1) or pcDNA3.1 empty vector (lane 2) or were from type 1 MG (lane 3). Rat GPNMB proteins were cross‐reacted with a goat anti‐mouse GPNMB antibody. Arrows indicate specific staining. C: Lysates of cells transfected with pcDNA3.1‐Gpnmb or pcDNA3.1 empty vector were immunoprecipitated by using 9F5 (under DTT (−) condition) and then immunoblotted (IB) with the anti‐GPNMB antibody (under DTT (+) condition). Lysates from rat type 1 MG was used as a positive control (P.C.) for immunoblotting with anti‐GPNMB antibody. Lower panel shows the IgG (9F5 or control IgG) that was eluted from Protein G column by SDS‐PAGE sampling buffer without DTT. D: WB analysis of rat type 1 MG reactions with 9F5 and anti‐GPNMB antibody. E: Lysates of rat type 1 MG were immunoprecipitated via anti‐GPNMB antibody and then immunoblotted by using 9F5. [Color figure can be viewed in the online issue, which is available at wileyonlinelibrary.com.]
Next, to analyze the expression of Gpnmb mRNA and GPNMB protein in MG, Mφ, and neuronal cells, we performed Northern and WB analyses (Fig. 5). We found one transcript of ∼2.3 kb in type 1 MG, but the high expression level of Gpnmb mRNA was not restricted to type 1 MG (Fig. 5A, lanes 1, 2), in that we also detected it in type 2 MG (Fig. 5A, lanes 3, 4) and Mφ (Fig. 5A, lanes 5, 6, 7). Gpnmb mRNA was barely detected in the adult rat brain (Fig. 5A, lane 9) and rat C6 glioma cells (Fig. 5B, lane 10). Figure 5B shows comparative results of WB analyses with 9F5 and anti‐GPNMB antibody in MG, Mφ, neurons, and astrocytes under DTT (‐) conditions. The 9F5 reacted most strongly with type 1 MG, to a much less degree with type 2 MG, and barely with Mφ (Fig. 5Ba; see also Fig. 1Ba). In contrast, anti‐GPNMB antibody reacted with not only type 1 MG but also type 2 MG and Mφ, and it reacted most strongly with murine type 1 cell line 6‐3 (Fig. 5Bb). 9F5 did not react with mouse MG cell lines, including 6‐3 and Ra2, because 9F5 antibody was obtained from immunized mice. These results indicate that 9F5 is highly selective for rat type 1 MG and that the 50‐ to 70‐kDa fragments of GPNMB comprise a unique protein that is selectively expressed in type 1 MG.
Figure 5.
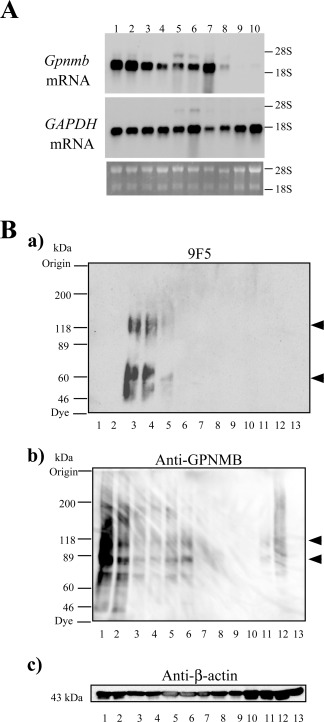
Northern and WB analyses of rat Gpnmb mRNA and proteins. A: Total RNA (2.0 µg) from rat type 1 MG (lanes 1, 2), rat type 2 MG (lanes 3, 4), peritoneal rat Mφ (lane 5), LPS‐stimulated peritoneal rat Mφ (lane 6), thioglycolate‐elicited rat Mφ (lane 7), mouse MG5 MG (lane 8), adult rat brain (lane 9), and rat C6 glioma cells (lane 10) were subjected to blot analysis. The middle and bottom panels show Northern blot analysis of glyceraldehyde‐3‐phosphate dehydrogenase (GAPDH) and ethidium bromide staining of 28S and 18S rRNA, respectively. B: WB analyses with 9F5 (a), anti‐GPNMB (b), and anti‐β‐actin antibodies (c) under DTT (−) conditions. Extracts (20 µg) were from mouse 6–3 MG (lane 1), mouse Ra2 MG (lane 2), rat type 1 MG (lane 3), LPS‐stimulated rat type 1 MG (lane 4), rat type 2 MG (lane 5), IL‐4‐stimulated rat type 2 MG (lane 6), rat neurons (lane 7), rat astrocytes (lane 8), mouse RAW 264.7 Mφ(lane 9), rat Mφ (lane 10), LPS‐stimulated rat Mφ (lane 11), thioglycolate‐elicited rat Mφ (lane 12), and rat neuroepithelial cells (lane 13).
9F5 Recognizes GPNMB Fragments Generated by Furin‐like Protease(s)
To characterize the epitope structure of 9F5 more precisely, we analyzed the mechanism of generation of the antigen molecule for 9F5 in type 1 MG. We first investigated the effect of GPNMB glycosylation on 9F5 immunoreactivity, because GPNMB is a highly glycosylated protein (Shikano et al., 2001) and the glycosylated form may differ among MG subtypes. Treatment with deglycosidases including PNGase F and sialidase/O‐glycosidase (Fig. 6) did not reduce 9F5 immunoreactivity to rat type 1 MG, which suggests that rat GPNMB glycosylation is not the epitope structure of 9F5. 9F5 did not react with the full‐length GPNMB protein of 125 and 95 kDa, because removal of N‐glycosides from GPNMB in rat type 1 MG showed that (1) the full‐length GPNMB (119.6 and 94.9 kDa) shifted to 68.3 and 79.8 kDa, respectively;(2) major two bands detected by 9F5 (64.6 and 51.7 kDa) shifted to 58.7 and 46.5 kDa, respectively; and (3) a minor band detected by 9F5 (137.1 kDa; Figs. 1Ba, 3A, and 5Ba) shifted to 112.1 kDa after the treatment (Fig. 6Aa). These data indicate that the 137.1 kDa band is not the full‐length GPNMB but may be the dimer (S‐S‐linked or dimerized via sugar chains) of the 64.6‐ and 51.7‐kDa bands.
Figure 6.
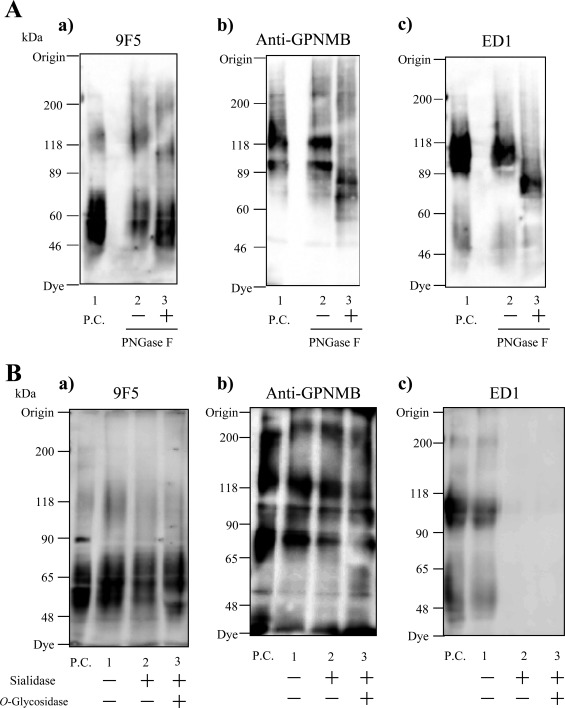
Immunoreactivity of 9F5 was not affected by deglycosylation of rat GPNMB protein. A: Extracts of rat type 1 MG were treated with or without N‐glycosidase F (PNGase F) overnight at 37°C, and they were then subjected to immunoblotting with 9F5 (a), anti‐GPNMB (b), or ED1 (c) antibodies. As reported previously for murine dendritic cells (Shikano et al., 2001), full‐length GPNMB (119.6 and 94.9 kDa) in type 1 MG shifted to 68.3 and 79.8 kDa after PNGase F treatment (Ab). B: Extracts of type 1 MG were treated with or without sialidase and O‐glycosidase overnight at 37°C, and they were then subjected to immunoblotting with 9F5 (a), anti‐GPNMB (b), or ED1 (c) antibodies. Immunoreactivity of ED1, an antibody that reacts with sialic acid on rat CD68, disappeared after sialidase treatment (Bc).
We next investigated whether 9F5 could recognize GPNMB fragments processed by furin‐like protease(s) because premelanosomal protein 17 (Pmel 17), which belongs to the Pmel family including GPNMB, is processed by proprotein convertase/furin (Berson et al., 2003), and rat GPNMB has a consensus sequence of a furin cleavage site around Lys170: His‐Gly‐Arg‐Lys 169↓‐Lys170 (the consensus sequence is underlined; Fig. 3Cb). Overexpression of furin cDNA significantly increased the fluorescence intensity of 9F5 in pcDNA‐Gpnmb‐transfected COS‐7 cells (F (3, 8) = 5.506; n =3 wells per group; P < 0.05; Fig. 7), whereas the fluorescence intensity of anti‐GPNMB antibody remained unchanged after cotransfection. Also, cotransfection of cDNA for α1‐PDX (an inhibitor of proprotein convertases including furin, PACE4, and PC5) significantly reduced the fluorescence intensity of 9F5 in pcDNA‐Gpnmb‐transfected COS‐7 cells (F (3, 10) = 11.17; n = 3–4 wells per group; P < 0.01; Fig. 8), whereas the intensity of anti‐GPNMB antibody remained unchanged after cotransfection. Moreover, furin siRNA significantly reduced the fluorescence intensity of 9F5 in pcDNA‐Gpnmb‐transfected HEK293 cells (F (3, 10) = 9.895; n =3–4 wells per group; P < 0.01; Fig. 9), whereas the intensity of anti‐GPNMB antibody remained unchanged after cotransfection. These results suggest that furin‐dependent proteolysis of GPNMB, which leads to production of the antigen molecule for 9F5, occurred in these cells.
Figure 7.
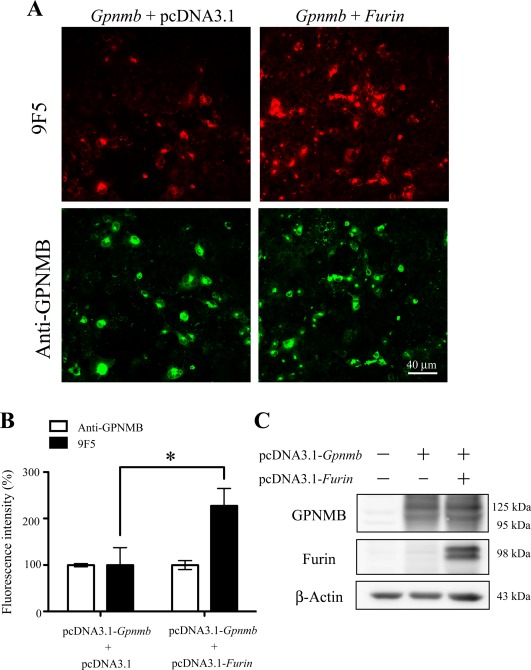
Overexpression of furin cDNA increases the expression level of 9F5 antigen. COS‐7 cells were cotransfected with pcDNA3.1‐Gpnmb/pcDNA3.1 or pcDNA3.1‐Gpnmb/pcDNA3.1‐furin vector. A: At 72 hr after transfection, cells were double‐stained with 9F5 (red) and anti‐GPNMB (green) antibodies. B: The results shown in A were quantified and are given as means ± SEM (n = 3). Fluorescence intensities (9F5 and anti‐GPNMB) in cells transfected with pcDNA3.1‐Gpnmb/pcDNA3.1were set at 100%. *P < 0.05 by Dunnett's multiple comparison test. C: Cell lysates were also subjected to immunoblot analysis for GPNMB, furin, and β‐actin. [Color figure can be viewed in the online issue, which is available at wileyonlinelibrary.com.]
Figure 8.
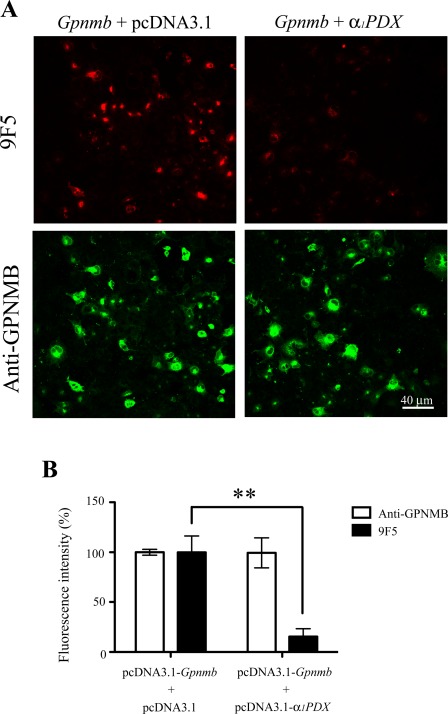
A furin inhibitor decreases the expression level of 9F5 antigen. COS‐7 cells were cotransfected with pcDNA3.1‐Gpnmb/pcDNA3.1 or pcDNA3.1‐Gpnmb/pcDNA3.1‐α1PDX vector. A: At 72 hr after transfection, cells were double‐stained with 9F5 (red) and anti‐GPNMB (green) antibodies. B: The results shown in A were quantified and are given as means ± SEM (n = 3–4). Fluorescence intensities (9F5 and anti‐GPNMB) in cells transfected with pcDNA3.1‐Gpnmb/pcDNA3.1 were set at 100%. **P < 0.01 by Dunnett's multiple comparison test. [Color figure can be viewed in the online issue, which is available at wileyonlinelibrary.com.]
Figure 9.
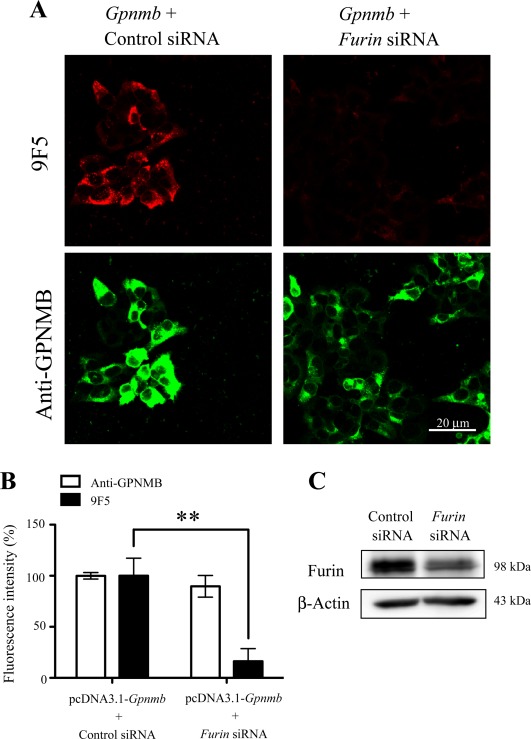
A furin siRNA inhibits the expression level of 9F5 antigen. HEK293 cells were cotransfected with pcDNA3.1‐Gpnmb/control small interfering RNA (siRNA) or pcDNA3.1‐Gpnmb/furin siRNA. A: At 72 hr after transfection, cells were double‐stained with 9F5 (red) and anti‐GPNMB (green) antibodies. B: The results shown in A were quantified and are given as means ± SEM (n = 3–4). Fluorescence intensities (9F5 and anti‐GPNMB) in cells transfected with pcDNA3.1‐Gpnmb/pcDNA3.1 were set at 100%. **P < 0.01 by Dunnett's multiple comparison test. C: Cell lysates were also subjected to immunoblot analysis for furin and β‐actin. [Color figure can be viewed in the online issue, which is available at wileyonlinelibrary.com.]
Given that furin is a direct target gene for the IL‐12/STAT4 pathway in Th1 cells (Oksanen et al., 2014; Pesu et al., 2006), we treated type 1 MG with recombinant IL‐12. The cytokine increased both furin protein and antigen for 9F5 of rat type 1 MG with similar kinetics (Fig. 10). These results suggest that 9F5 immunoreactivity to GPNMB depended on the activity of furin‐like protease(s).
Figure 10.
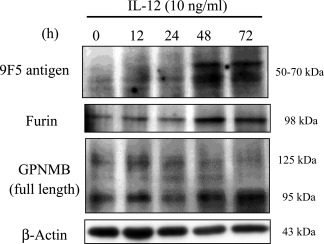
IL‐12 increases both furin and 9F5 antigen of rat type 1 MG with similar kinetics. Rat type 1 MG were treated with rat recombinant IL‐12 (10 ng ml−1) at the indicated hours, and cell lysates were subjected to immunoblot analysis for 9F5 antigen, furin, GPNMB, and β‐actin.
Antigen Molecule for 9F5 Is Selectively Expressed in a Subpopulation of MG in Developing Rat Brain
Because 9F5 was selective for type 1 MG in vitro (Figs. 1 and 2), we investigated whether 9F5 would react with MG in developing rat brain. When sagittal sections of postnatal day 5 (P5) brain were stained with 9F5 antibody (Fig. 11), a number of 9F5+ cells occurred in the periphery of several brain regions including lateral ventricles (LV), corpus callosum (CC), pontine nuclei, and fourth ventricles. However, the cortex was essentially negative for 9F5+ cells. The 9F5+ cells had round and/or amoeboid shapes, as seen in the in vitro cultures (Figs. 2Ba‐c and 11).
Figure 11.
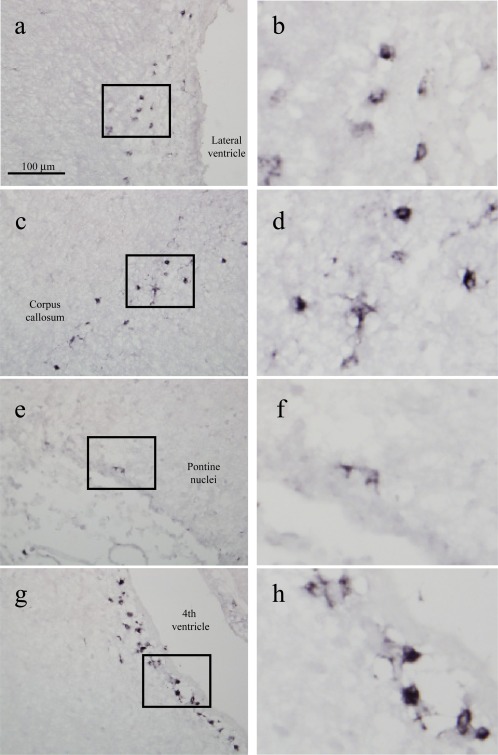
Immunohistochemical analysis with 9F5 of cryostat sections of a P5 rat brain. Sagittal sections were probed with 9F5 (diaminobenzidine‐Ni staining). Representative sections from the lateral ventricle (a, b), corpus callosum (c, d), pontine nuclei (e, f), and fourth ventricle (g, h). b, d, f, h:9F5+ cells at higher magnification. [Color figure can be viewed in the online issue, which is available at wileyonlinelibrary.com.]
In the tested LV region, 9F5+ cells in coronal sections of P5 rat brain were further evaluated by double‐staining with anti‐Iba1, anti‐NG2, anti‐nestin, or anti‐GFAP antibody, which are antibodies specific for MG, oligodendrocyte precursor cells, neuronal progenitors, and astrocytes, respectively. As Fig. 12a–c shows, 9F5+ cells were included in the Iba1+ cell population. In contrast, 9F5+ cells were not stained with antibodies for NG2 (Fig. 12d–f), nestin (Fig. 12g–i), or GFAP (Fig. 12j–l). In addition, 9F5 barely cross‐reacted with peripheral Mφ in adult rat spleen and liver (Supporting Information Fig. 4). These results demonstrated that 9F5 selectively immunostained MG among brain cells.
Figure 12.
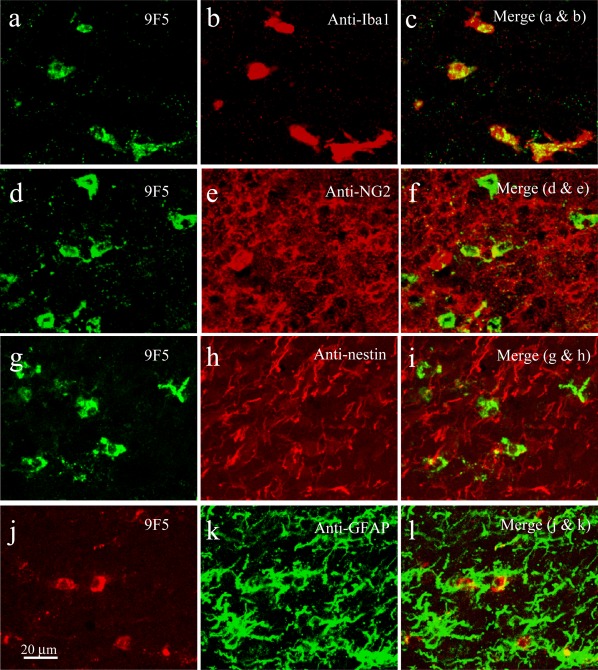
9F5 selectively immunostains MG among brain cells of a P5 rat brain. Coronal sections around the lateral ventricle were double‐stained with 9F5 and anti‐Iba1 (a–c), anti‐NG2 (d–f), anti‐nestin (g–i), or anti‐GFAP (j–l) antibodies. Fluorescence signals are shown individually and after merging. [Color figure can be viewed in the online issue, which is available at wileyonlinelibrary.com.]
Different Populations of 9F5+ MG and Iba1+ MG in Rat Brains during P1‐P28
We then investigated changes in the expression and distribution of 9F5+ MG and compared them with those of Iba1+ MG around the supraventricular CC region (Fig. 13), in which 9F5+ MG were most frequently observed (Fig. 11). This area is also known as the region for fountains of MG, where amoeboid MG migrate into the brain parenchyma and mature into ramified MG (Hirasawa et al., 2005).
Figure 13.
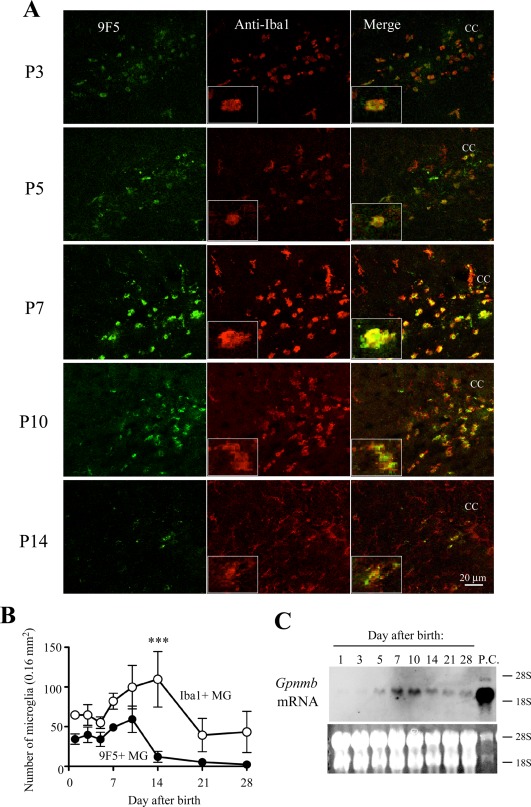
Comparative immunofluorescence analysis of cryostat sections from postnatal rat brains with 9F5 and anti‐Iba1antibodies. A: Coronal sections from P3‐P14 brains were probed with 9F5 (green) and anti‐Iba1 (red) antibodies. Fluorescencesignals are shown individually and after merging. Inset shows a higher magnification of double‐labeled cells. Labeled cells are concentrated in the white matter that constitutes the stream around the corpus callosum (CC). B: Plots of the number of Iba1+ MG and 9F5+ MG (9F5 + Iba1+ cells) in the developing brains from P1 to P28. Data are means ± SEM (n = 3). ***P < 0.001 (at day 14), determined by two‐way ANOVA with the Bonferroni post hoc test. C: Samples of total RNA (10 µg) from rat brain (P1 to P28) were subjected to blot analysis for Gpnmb mRNA. The positive control (P.C.) was total RNA (2.0 µg) from MG5 cells. The bottom panel shows ethidium bromide staining of 28S and 18S rRNA. [Color figure can be viewed in the online issue, which is available at wileyonlinelibrary.com.]
At P1, 9F5+ cells had already existed in CC regions (Fig. 11). At P1–P7, majority of the 9F5+ signals was observed in Iba1+ cells (Fig. 13A). 9F5+ but Iba1‐negative or weakly positive cells [9F5 + Iba1(−/+)]were occasionally observed (Fig. 13A). Therefore, we counted and showed the 9F5 and Iba1 double positive cells(9F5 + Iba1+) as the 9F5+ MG in Fig. 13B. The 9F5+ MG increased during P7‐P10 and then decreased markedly at P14 (Fig. 13A,B). The time course of expression level of Gpnmb mRNA in developing rat brain was consistent with the intensity of the 9F5+ signal (Fig. 13C). Most of the 9F5+ signals during P7‐P10 were detected in round and amoeboid cells, whereas 9F5‐Iba1+ MG showed a ramified morphology. Iba1+ cells, however, were present in the P1 brain, and they increased during P7‐P10, as did 9F5+ cells, but the maximum number of Iba1+ cells occurred during P14. The number of Iba1+ cells subsequently decreased, but some Iba1+ cells were present even at P28. The increase in the number of 9F5+ cells during P7‐P10 were also observed in other regions including around lateral and third ventricles, but not in hippocampus and choroid plexus (Supporting Information Fig. 5). These results suggest that 9F5+ cells were restricted to a subpopulation of MG (9F5 + Iba1+ amoeboid cells) at P7‐P10 in developing rat brain and that they may play a major role in CC regions during the period.
Expression of 9F5+ Cells in Rat Brains at E10 and E14
To determine the timing in development when 9F5+ cells appeared, cryostat sections of E10 and E14 brains were double‐stained with 9F5 and anti‐Iba1 (Figs. 14 and 15). In the E10 rat neural tube, Iba1 + 9F5‐ cells were present (Fig. 14, region a). Although 9F5 + Iba1+ cells did not occur in the E10 neural tube, double‐positive cells were present outside the brain at this stage (Fig. 14, region b). In contrast, 9F5 + Iba1+ cells appeared in the E14 rat brain parenchyma (Fig. 15). This result suggests that 9F5+ cells may infiltrate the brain after E10. In addition, cells of 9F5 + Iba1− or 9F5 + Iba1(−/+), were observed in E14 rat brain (Fig. 15, regions a and b).
Figure 14.
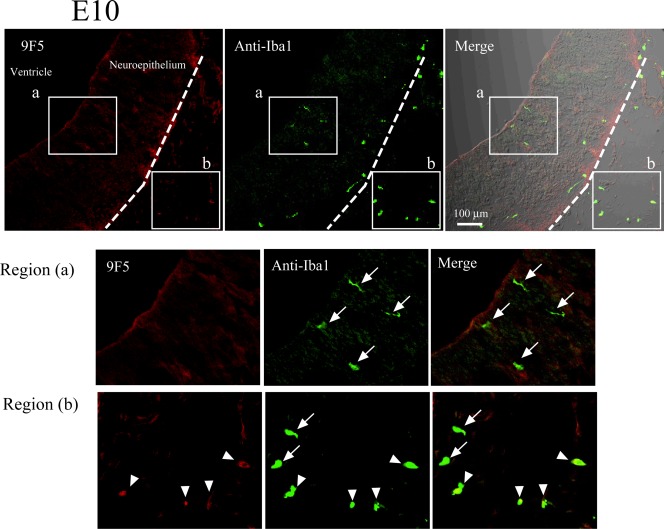
Immunofluorescence analysis of cryostat sections of E10 rat brain. Coronal sections of E10 rat brains were probed with 9F5 (red) and anti‐Iba1(green) antibodies. Fluorescence signals are shown individually and after merging. The 9F5+ cells and Iba1+ cells are shown at higher magnification (regions a, b). Iba1 + 9F5− cells (arrows) occurred inside and outside the neural tube of the E10 rat brain, whereas 9F5 + Iba1+ cells (arrowheads) were observed outside the neural tube at this stage. [Color figure can be viewed in the online issue, which is available at wileyonlinelibrary.com.]
Figure 15.
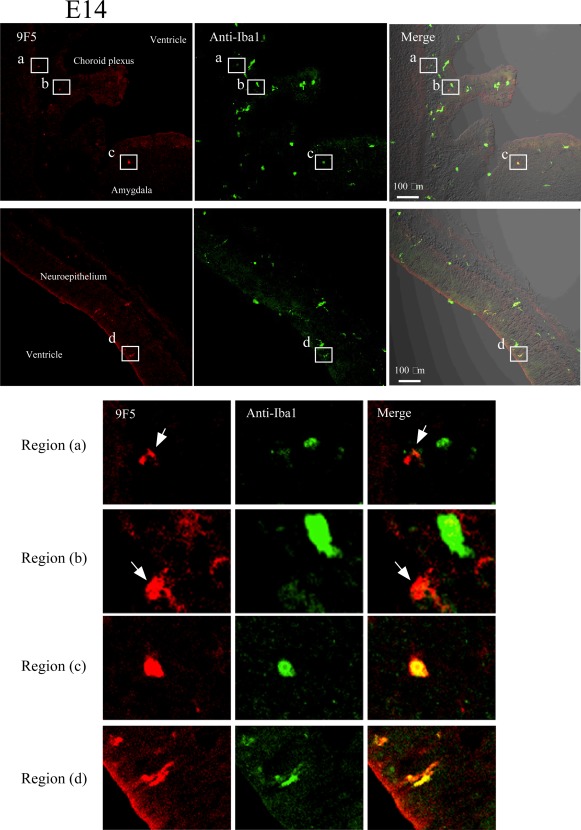
Immunofluorescence analysis of cryostat sections of E14 rat brain. Coronal sections of E14 rat brains were probed with 9F5 (red) and anti‐Iba1 (green) antibodies. 9F5+ and Iba1+ cells are shown at higher magnification (regions a‐d). Round or amoeboid 9F5 + Iba1‐ cells were seen in brain parenchyma near the choroid plexus (arrows in regions a, b). Round‐ and rod‐shaped 9F5 + Iba1+ cells were also present in the brain parenchyma near the amygdala (region c) and around the lateral ventricle (region d), respectively. [Color figure can be viewed in the online issue, which is available at wileyonlinelibrary.com.]
Expression of 9F5+ Cells in E14 Rat Brain and Eyes
At mouse stages E10‐E18, Gpnmb mRNA was specifically expressed in retinal pigment epithelium (RPE) (Bächner et al., 2002). In agreement with this result, high positive 9F5 staining was found in E14 rat retinal cells, which were obviously Iba1‐negative (arrows in Fig. 16a–f). The 9F5 + Iba1+ MG‐like cells were also observed both outside and inside the retina (some are indicated by arrowheads in Fig. 16a,d). Higher magnification photomicrographs (Fig. 16d–f) showed that 9F5 immunoreactivity was somewhat localized in the RPE, possibly on cytoplasmic and punctate structures such as the melanosome (arrow in Fig. 16d). Anti‐laminin antibody staining revealed that the laminin‐positive choroid was the layer outside the 9F5+ cell layer (Fig. 16g–i). Furthermore, 9F5 staining was merged with anti‐MITF (microphthalmia‐associated transcription factor) antibody, a marker of RPE cells (Fig. 16j–l). These results demonstrated that, in the developing rat eye, the antigen for 9F5 was localized both in RPE cells and in a subpopulation of “retinal Iba1+ MG.”
Figure 16.
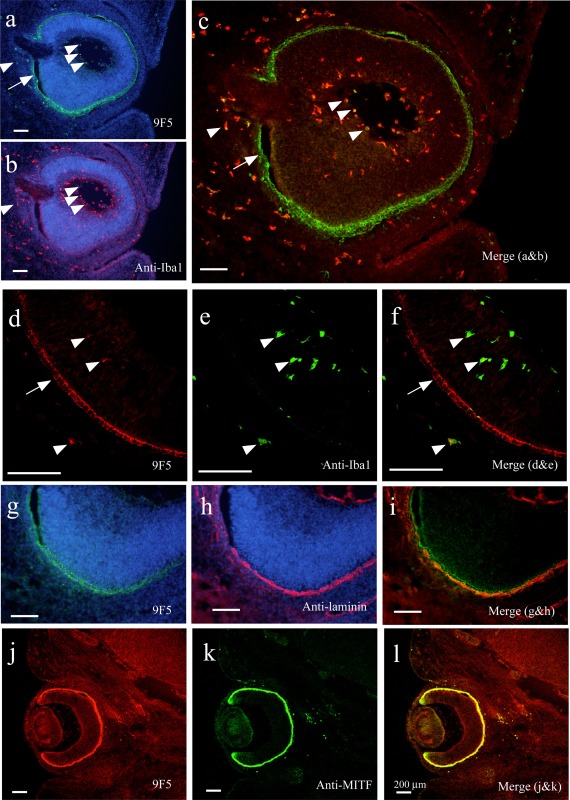
Immunofluorescence analysis of cryostat sections of E14 rat eye. a–f: Coronal sections were probed with 9F5 and anti‐Iba1antibodies and then counterstained with Hoechst 33258 (a, b). Fluorescence signals are shown individually (a, b) and after merging (c). Arrows indicate 9F5 + Iba1− retinal cells, arrowheads, some 9F5 + Iba1+ cells. d–f: 9F5+ and Iba1+ cells are also shown at higher magnification. g–i:Coronal sections were probed with 9F5 and anti‐laminin antibodies and then counterstained with Hoechst 33258 (g, h). Fluorescence signals are shown individually and after merging. j–l:Coronal sections were probed with biotin‐conjugated 9F5 and anti‐MITF antibody. Fluorescence signals are shown individually and after merging. Section j–l demonstrated cell‐type‐specific expression of 9F5 antigen on the retinal pigment epithelium (arrow in c, f) and 9F5 + Iba1+ cells comprising a portion of the Iba1+ cells (arrowheads in c, f). [Color figure can be viewed in the online issue, which is available at wileyonlinelibrary.com.]
Discussion
Increasing numbers of studies report that MG are heterogeneous populations and that subtypes or subsets may exist and play different roles in the CNS. However, the lineages and functions of these subtypes remain largely unknown because of the lack of suitable tools to differentiate such heterogeneous MG populations. The present study describes our generation of a novel monoclonal antibody, 9F5, to help remedy this lack.
Truncated GPNMB as the Antigen Molecule for 9F5
We identified rat truncated GPNMB starting at Lys170as the antigen molecule for 9F5 (Figs. 3 and 4). GPNMB, a heavily glycosylated type I transmembrane protein, was expressed in several cells including osteoblasts, melanocytes, and tumor cells (Anderson et al., 2002; Safadi et al., 2001; Weterman et al., 1995). Shikano et al. (2001) showed that GPNMB was expressed at high levels on dendritic cells but lower levels on Mφ. 9F5 strongly reacted with RPECs in E14 rat eye (Fig. 16). This result agrees with the report that Gpnmb mRNA was expressed in mouse RPECs at E10‐E18 (Bächner et al., 2002). The 9F5+ cells also colocalized with cells stained with a polyclonal anti‐GPNMB antibody in E10 rat eye (data not shown), which confirmed a part of GPNMB as the antigen protein for 9F5.
Here, we determined the epitope structure of 9F5. Types 1 and 2 MG, and peritoneal Mφ as well, expressed the mRNA and the full‐length protein for rat GPNMB, whereas 9F5 reactivity was selective for type 1 MG (Fig. 5). Although 9F5 reacted with the 50‐ to 70‐kDa fragments, whose N‐terminal amino acid is Lys170 (Fig. 3), it did not react with the full‐length GPNMB protein of 125 and 95 kDa (Fig. 6). No alternative splicing form of Gpnmb mRNA occurred in rat type 1 MG (Figs. 3A and 14C). Deglycosylation by the treatments with PNGase F and sialidase/O‐glycosidase (Fig. 6), did not reduce 9F5 reactivity with rat type 1 MG. These results suggest that 9F5 reactivity with the GPNMB fragments depends on cleavage between Lys169 and Lys170.
We then showed that 9F5 immunoreactivity to the GPNMB fragments (50–70 kDa) depended on furin‐like proteaseactivity (Figs. 7, 8, 9, 10). Overexpression of furin cDNA increased expression of the antigen for 9F5 (Fig. 7), whereas inhibiting furin with α1‐PDX or siRNA abrogated this reactivity (Figs. 8 and 9). IL‐12, which induces furin mRNA (Pesu et al., 2006), also increased expression of antigens for furin and 9F5 in rat type 1 MG, with similar kinetics (Fig. 10). Thus, furin‐like protease cleaves the dibasic motif (Lys169‐Lys170) of GPNMB in type 1 MG, and the 9F5 antigen produced may be a useful marker of furin activity in MG. Additional studies are needed to inspect whether furin activity is higher (or an endogenous furin inhibitor such as serpin is lower) in type 1 MG than that in type 2 MG and peritoneal Mφ.
The signals of truncated GPNMB disappeared almost completely by treating with furin siRNA (Fig. 9A), despite furin protein was still abundant (Fig. 9C). Because furin siRNA and Gpnmb cDNA are mainly co‐introduced into the same cells by TransMessenger reagent (Qiagen), furin‐dependent processing must be inhibited in the same cells, resulting in disappearance of the signals of truncated GPNMB in the cells. On the other hand, the transfection efficiency is not 100% in this method. Therefore, it is considered that the furin expression is not knockdown in the cell, into which the plasmid‐siRNA complex was not introduced, resulting that furin protein was still abundant.
Furochi et al. (2007) demonstrated that mouse GPNMB was cleaved at a dibasic motif (Lys459‐Lys460) in the juxta membrane region in mouse myoblasts by a disintegrin and metalloproteinase‐like protease. However, whether this protease cleaves rat GPNMB at a dibasic motif (Lys169‐Lys170) and produces fragments recognized by 9F5 has not been determined. Melanosome‐specific protein PMEL 17, with a relatively conserved sequence to GPNMB (Theos et al., 2005), undergoes proteolytic cleavage by a furin‐like convertase to form active PMEL 17 in pigment cells (Berson et al., 2003), which suggests that a furin‐like protease forms the GPNMB fragments in RPECs (Fig. 16).
Physiological Significance of Truncated GPNMB in Developing Brain
The three‐dimensional structure of rat GPNMB has not yet been resolved. However, Lys170 is believed to locateat the protein surface, given the furin‐like protease processing at the dibasic motif (Lys169‐Lys170). Infection of neonatal rat glial cells with Toxoplasma gondii caused a marked 136‐fold increase in Lys170acetylation of rat GPNMB (Bouchut et al., 2015). Mice and humans infected with T. gondii increased the furin activity of T cells in an IL‐12‐dependent manner and augmented host resistance against parasites via secretion of cytokines including interferon‐γ (Oksanen et al., 2014). The 9F5+ cells localized in specific areas of neonatal rat brain including the forebrain subventricular zone, CC, and retina (areas affected by toxoplasmosis in neonatal human brain). Lys170 acetylation in toxoplasmosis may disrupt the interaction between furin and GPNMB, because, the amino acid substitution with a hydrophobic aliphatic side chain at the P1' position (i.e., Lys170) is not suitable as a furin substrate (Nakayama, 1997; Tian, 2009). Because many cytokines are dysregulated in Gpnmb mutant mice (Abdelmagid et al., 2014; Wilson et al., 2015), future studies are required to reveal the role of GPNMB and its Lys acetylation for furin activity required for cytokine maturation in 9F5+ MG.
Distribution of 9F5+ MG in Neonatal Rat Brain
Given its high selectivity for type 1 MG, 9F5 may be applied to monitor changes in distribution and morphology of 9F5+ MG in neonatal rat brain. The 9F5+ MG comprised a fraction of Iba1+ total MG during P1‐P28 stages of brain development, which confirms that MG subtype(s), at least 9F5+ and 9F5−, exist in vivo. Also, 9F5+ MG were round and/or amoeboid in brain areas including the subventricular zone and CC regions (Figs. 11 and 12).
In neo‐ and postnatal brains, the 9F5+ cell number peaked at P10 in the parenchyma around the CC near the LV, decreased rapidly at P14, and was lower by P21 (Fig. 13). Rat neuronal progenitor cells begin to proliferate at E13, start to migrate before birth, and begin to differentiate into neurons just after birth (Ferrer et al., 1990; Spreafico et al., 1995). Simultaneously with or after differentiation, neuronal apoptosis occurs; apoptosis peaks during P5‐P7 and completes by P14 (Ferrer et al., 1990; Spreafico et al., 1995). In our study here, changes in 9F5+ cell numbers during development showed a similar pattern, although the peak (P7‐P10) came slightly later than the reported period of neuronal apoptosis. MG functionin axon guidance and clearance of apoptotic neurons (Hamilton and Rome, 1994; Miller and Kaplan, 2001). Therefore, 9F5+ MG in developing rat brain may be involved in migration and differentiation of neuronal progenitor cells and in clearance of dying neurons.
Microglial insulin‐like growth factor‐1 (IGF‐1) is reportedly required for survival of layer V corticospinal motor neurons in the developing brain (Ueno et al., 2013). However, how IGF‐1+ MG accumulate around subcortical white matter during development remained unknown. The distribution pattern of IGF‐1+ MG seemed similar to that of our 9F5+ MG in developing rat brain, and furin was required for pro‐IGF‐1 processing. Amoeboid MG express IGF‐1 in developing rat brain (Kaur et al., 2006), which suggests that IGF‐1+ MG may be 9F5+ MG. Because GPNMB is involved in the pathophysiological process in motor neuron diseases (e.g., amyotrophic lateral sclerosis) (Tanaka et al., 2012), future investigations must determine how 9F5+ MG contribute to motor neuron survival.
One fate‐mapping study revealed that adult MG derive from yolk‐sac Mφ (Ginhoux et al., 2010). Monocytes from aorta‐gonad‐mesonephros, fetal liver, or bone marrow may also infiltrate the brain, especially the meninges, choroid plexus, and perivascular spaces (Andjelkovic et al., 1998; Prinz and Priller, 2014; Sheng et al., 2015). Although MG from yolk‐sac Mφ contribute to adult brain function, bone marrow‐derived myeloid cells/monocytes of peripheral origin may also contribute to brain pathology including Alzheimer's disease, especially around Aβ plaque (Jay et al., 2015; Savage et al., 2015).
In the E10 rat neural tube, Iba1 + 9F5− cells, but not 9F5+ cells, were observed; 9F5 + Iba1+ cells occurred only outside the neural tube (Fig. 14). At E14, however, 9F5 + Iba1+ cells appeared in brain parenchymal regions, such as amygdala (Fig. 15, regions c and d). These results indicate that Iba1 + 9F5− cells, which had invaded brain parenchyma earlier than 9F5+ cells, were already present at E10, whereas 9F5 + Iba1+ cells remained outside the parenchyma until later. In E14 rat brain parenchyma, we observed three different cells, namely 9F5 + Iba1−, 9F5 + Iba1(−/+), and 9F5 + Iba1+ cells (Fig. 15). The 9F5 + Iba1− cells were also observed in some parts of P1‐P7 rat brain (Fig. 13A). The 9F5 + Iba1(−/+) cells are thought to be immature MG that will differentiate into MG. The 9F5‐Iba1+ cells in E10 brain parenchyma are believed to be resident MG derived from yolk‐sac Mφ. Therefore, 9F5‐Iba1+ cells, possibly type 2 MG, may be derived from yolk‐sac Mφ. However, present data do not give conclusion about this MG subtype. Future studies must characterize this subpopulation.
In our study, we detected 9F5 immunoreactivity in RPECs of E10‐E14 rat eye (Fig. 16, data not shown), and in retinal MG subpopulations in E14 rat eye (Fig. 16d–f). This finding is a sharp contrast to anti‐Iba1 antibody, which did not stain RPECs. RPECs originate from the neural tube (Martinez‐Morales et al., 2004). Therefore, present results suggest that 9F5+ MG may be of neuroectodermal origin. However, both RPECs and 9F5+ MG express the same antigen for 9F5, whereas the neuroepithelial progenitor cells do not (Fig. 1Ba, lane 12). RPECs help to maintain retinal function. Brain 9F5+ MG and retinal RPECs may possess similar phagocytic functions that are possible to result from the common antigen for 9F5.
In this study, we did not perform lineage tracking of 9F5‐immunoreactive myeloid cells in the CNS. Antigen molecule for 9F5 is expressed in developing rat brain, but the molecule was almost disappeared in adult rat brain (Fig. 13B). Because the P7 and P10 rat brains contained many kinds of proliferating cells (Imamoto and Leblond, 1978), it is impossible to label specifically 9F5‐positive cells by BrdU method. This problem may be overcome by the genetic fate mapping studies. However, this technology requires the generation of many mouse lines: a tamoxifen‐sensitive Gpnmb‐CreERT2 mouse line followed by crossbreeding to reporter lines. Therefore, lineage‐tracking study is beyond the scope of this manuscript, but it is an important question to be solved in near future.
Lastly, we generated Gpnmb‐GFP knock‐in mice (Supporting Information Figs. 1–3) to investigate the functional relevance of GPNMB for microglia in vivo. GFP was expressed in a subpopulation of Iba1+ MG in mixed glial cell culture from P3 neonatal brain of heterozygous Gpnmb‐GFP knock‐in mice and in the white matter regions including CC of P5‐P7 neonatal brains, but not in liver (Supporting Information Figs. 2 and 3). Homozygous Gpnmb‐KO mice did not show any growth retardation including body weight loss in neonatal development (Supporting Information Fig. 1F). However, 23% of homozygous Gpnmb‐KO mice (3 of 13 mice) and 8% of the heterozygous mice (1 of 12 mice) exhibited spontaneous seizure phenotype at age of 10‐ to 26.5‐month old (Supporting Information Table 1, Supporting Information Videos 1 and 2). The results were consistent with the characteristics of DBA/2J mice with dysfunctional GPNMB expression: DBA/2J mice are susceptible to seizure‐inducing model (Ferraro et al., 1999). Collectively, GPNMB may play some roles to prevent age‐related epilepsy in rodent, but more definitive data is required in the future study.
It remains unknown whether 9F5+ MG in developing rat brain is phenotypically equivalent to that of CD40+ type 1 MG in vitro. Definitive evidence is lacking, mainly due to two reasons: (i) commercial unavailability of anti‐rat CD40 antibody for immunohistochemistry, and (ii) unavailability of lineage analysis tools including a tamoxifen‐sensitive Gpnmb‐CreERT2 mouse line. Comprehensive characterization of the 9F5+ MG in vivo including lineage analysis should be solved in near future.
In summary, we developed the new monoclonal antibody 9F5 that showed no cross‐reactivity with peritoneal Mφ and recognized a fraction of Iba1+ MG—round and/or amoeboid type 1 MG in vitro. We demonstrated the existence of 9F5+ MG in vivo at an early developmental stage of rat brains and eyes. Because the antigen molecule for 9F5 was identified as the GPNMB fragments processed by furin‐like protease(s), 9F5 may be useful for elucidating new roles of 9F5+ MG during rat brain development, and in possible relations with neuroinflammation and neurodegenerative diseases.
Supporting information
Supporting Information 1
Supporting Information 2
Supporting Information Figure 1
Supporting Information Figure 2
Supporting Information Figure 3
Supporting Information Figure 4
Supporting Information Figure 5
Supporting Information Video 1
Supporting Information Video 2
Acknowledgment
This work was supported by JSPS KAKENHI Grant Numbers 16047224, 18053019, 19390031 (to H.N.), 17790067, 21790114, 23790133 (to K.K.), and grants from Takeda Science Foundation (to K.K.) and Daiichi Sankyo TaNeDS (to K.K.). The authors thank Drs. Kenji Tanaka and Hideo Hagiwara for their valuable advice on immunohistochemistry. They are grateful to Dr. Shinichi Kohsaka for providing the MG5 microglial cell line. They also thank Drs. Seiji Tajiri (Kumamoto University, Japan) and Kinichi Nakashima (Nara Institute of Science and Technology, Japan) for the primary neuronal cell cultures and for the neuroepithelial cell cultures, respectively. Dr. Eisuke Shimizu, Naoki Mishima, Kiyohiro Koga, Tomoko Sumi, and Sumika Yokoo are acknowledged for their technical assistances.
This work, in part, was presented in the abstract form at the annual meeting of the Society for Neuroscience, Atlanta, GA, October 16, 2006 (Program No. 386.4). The first author K.K. and the last author H.N.hold a patent related to the antibody 9F5 (Japan Patent P4815610, 2011‐09‐09). Gpnmb‐GFP knock‐in mouse is a material co‐developed with Daiichi Sankyo Co. Ltd. in a different project (TaNeDS, 2012‐2014). This company has no role in the interpretation, writing, or publication in this manuscript. The other authors note no conflict of interest.
Contributor Information
Kohichi Kawahara, Email: kkawa@nupals.ac.jp.
Hitoshi Nakayama, Email: jin@gpo.kumamoto-u.ac.jp.
References
- Abdelmagid SM, Belcher JY, Moussa FM, Lababidi SL, Sondag GR, Novak KM, Sanyurah AS, Frara NA, Razmpour R, Del Carpio‐Cano FE, Safadi FF. 2014. Mutation in osteoactivin decreases bone formation in vivo and osteoblast differentiation in vitro. Am J Pathol 184:697–713. [DOI] [PMC free article] [PubMed] [Google Scholar]
- Anderson MG, Smith RS, Hawes NL, Zabaleta A, Chang B, Wiggs JL, John SW. 2002. Mutations in genes encoding melanosomal proteins cause pigmentary glaucoma in DBA/2J mice. Nat Genet 30:81–85. [DOI] [PubMed] [Google Scholar]
- Andjelkovic AV, Nikolic B, Pachter JS, Zecevic N. 1998. Macrophages/microglial cells in human central nervous system during development: An immunohistochemical study. Brain Res 814:13–25. [DOI] [PubMed] [Google Scholar]
- Bächner D, Schröder D, Gross G. 2002. mRNA expression of the murine glycoprotein (transmembrane) nmb (Gpnmb) gene is linked to the developing retinal pigment epithelium and iris. Brain Res Gene Expr Patterns 1:159–165. [DOI] [PubMed] [Google Scholar]
- Berson JF, Theos AC, Harper DC, Tenza D, Raposo G, Marks MS. 2003. Proprotein convertase cleavage liberates a fibrillogenic fragment of a resident glycoprotein to initiate melanosome biogenesis. J Cell Biol 161:521–533. [DOI] [PMC free article] [PubMed] [Google Scholar]
- Bessis A, Bechade C, Bernard D, Roumier A. 2007. Microglial control of neuronal death and synaptic properties. Glia 55:233–238. [DOI] [PubMed] [Google Scholar]
- Bouchut A, Chawla AR, Jeffers V, Hudmon A, Sullivan WJ Jr. 2015. Proteome‐wide lysine acetylation in cortical astrocytes and alterations that occur during infection with brain parasite Toxoplasma gondii . PLoS One 10:e0117966. [DOI] [PMC free article] [PubMed] [Google Scholar]
- Bulloch K, Miller MM, Gal‐Toth J, Milner TA, Gottfried‐Blackmore A, Waters EM, Kaunzner UW, Liu K, Lindquist R, Nussenzweig MC, Steinman RM, McEwen BS. 2008. CD11c/EYFP transgene illuminates a discrete network of dendritic cells within the embryonic, neonatal, adult, and injured mouse brain. J Comp Neurol 508:687–710. [DOI] [PubMed] [Google Scholar]
- Chan WY, Kohsaka S, Rezaie P. 2007. The origin and cell lineage of microglia: New concepts. Brain Res Rev 53:344–354. [DOI] [PubMed] [Google Scholar]
- Cuadros MA, Navascues J. 1998. The origin and differentiation of microglial cells during development. Prog Neurobiol 56:173–189. [DOI] [PubMed] [Google Scholar]
- Dalmau I, Finsen B, Tonder N, Zimmer J, Gonzalez B, Castellano B. 1997. Development of microglia in the prenatal rat hippocampus. J Comp Neurol 377:70–84. [PubMed] [Google Scholar]
- Ferraro TM, Golden GT, Smith GG, ST Jean P, Schork NJ, Mulholland N, Ballas C, Schill J, Buono RJ, Berrettini WH. 1999. Mapping loci for pentylenetetrazol‐induced seizure susceptibility in mice. J Neurosci 19:6733–6739. [DOI] [PMC free article] [PubMed] [Google Scholar]
- Ferrer I, Bernet E, Soriano E, del Rio T, Fonseca M. 1990. Naturally occurring cell death in the cerebral cortex of the rat and removal of dead cells by transitory phagocytes. Neuroscience 39:451–458. [DOI] [PubMed] [Google Scholar]
- Furochi H, Tamura S, Mameoka M, Yamada C, Ogawa T, Hirasaka K, Okumura Y, Imagawa T, Oguri S, Ishidoh K, Kishi K, Higashiyama S, Nikawa T. 2007. Osteoactivin fragments produced by ectodomain shedding induce MMP‐3 expression via ERK pathway in mouse NIH‐3T3 fibroblasts. FEBS Lett 581:5743–5750. [DOI] [PubMed] [Google Scholar]
- Ginhoux F, Greter M, Leboeuf M, Nandi S, See P, Gokhan S, Mehler MF, Conway SJ, Ng LG, Stanley ER, Samokhvalov IM, Merad M. 2010. 2010. Fate mapping analysis reveals that adult microglia derive from primitive macrophages. Science 330:841–845. [DOI] [PMC free article] [PubMed] [Google Scholar]
- Hamilton SP, Rome LH. 1994. Stimulation of in vitro myelin synthesis by microglia. Glia 11:326–335. [DOI] [PubMed] [Google Scholar]
- Hanisch UK. 2002. Microglia as a source and target of cytokines. Glia 40:140–155. [DOI] [PubMed] [Google Scholar]
- Hayes GM, Woodroofe MN, Cuzner ML. 1987. Microglia are the major cell type expressing MHC class II in human white matter. J Neurosci 80:25–37. [DOI] [PubMed] [Google Scholar]
- Hirasawa T, Ohsawa K, Imai Y, Ondo Y, Akazawa C, Uchino S, Kohsaka S. 2005. Visualization of microglia in living tissues using Iba1‐EGFP transgenic mice. J Neurosci Res 81:357–362. [DOI] [PubMed] [Google Scholar]
- Imamoto K, Leblond CP. 1978. Radioautographic investigation of gliogenesis in the corpus callosum of young rats II. Origin of microglial cells. J Comp Neurol 180:139–164. [DOI] [PubMed] [Google Scholar]
- Jay TR, Miller CM, Cheng PJ, Graham LC, Bemiller S, Broihier ML, Xu G, Margevicius D, Karlo JC, Sousa GL, Cotleur AC, Butovsky O, Bekris L, Staugaitis SM, Leverenz JB, Pimplikar SW, Landreth GE, Howell GR, Ransohoff RM, Lamb BT. 2015. TREM2 deficiency eliminates TREM2+ inflammatory macrophages and ameliorates pathology in Alzheimer's disease mouse models. J Exp Med 212:287–295. [DOI] [PMC free article] [PubMed] [Google Scholar]
- Kanzawa T, Sawada M, Kato K, Yamamoto K, Mori H, Tanaka R. 2000. Differentiated regulation of allo‐antigen presentation by different types of murine microglial cell lines. J Neurosci Res 62:383–388. [DOI] [PubMed] [Google Scholar]
- Kaur C, Sivakumar V, Dheen ST, Ling EA. 2006. Insulin‐like growth factor I and II expression and modulation in amoeboid microglial cells by lipopolysaccharide and retinoic acid. Neuroscience 138:1233–1244. [DOI] [PubMed] [Google Scholar]
- Kawahara K, Suenobu M, Yoshida A, Koga K, Hyodo A, Ohtsuka H, Kuniyasu A, Tamamaki N, Sugimoto Y, Nakayama H. 2012. Intracerebral microinjection of interleukin‐4/interleukin‐13 reduces β‐amyloid accumulation in the ipsilateral side and improves cognitive deficits in young amyloid precursor protein 23 mice. Neuroscience 207:243–260. [DOI] [PubMed] [Google Scholar]
- Kawahara K, Yoshida A, Koga K, Yokoo S, Kuniyasu A, Gotoh T, Sawada M, Nakayama H. 2009. Marked induction of inducible nitric oxide synthase and tumor necrosis factor‐α in rat CD40+ microglia by comparison to CD40− microglia. J Neuroimmunol 208:70–79. [DOI] [PubMed] [Google Scholar]
- Koehler G, Milstein C. 1975. Continuous cultures of fused cells secreting antibody of predefined specificity. Nature 256:495–497. [DOI] [PubMed] [Google Scholar]
- Kreutzberg GW. 1996. Microglia: A sensor for pathological events in the CNS. Trends Neurosci 19:312–318. [DOI] [PubMed] [Google Scholar]
- Martinez‐Morales JR, Rodrigo I, Bovolenta P. 2004. Eye development: A view from the retina pigmented epithelium. BioEssays 26:766–777. [DOI] [PubMed] [Google Scholar]
- Miller FD, Kaplan DR. 2001. Neurotrophin signalling pathways regulating neuronal apoptosis. Cell Mol Life Sci 58:1045–1053. [DOI] [PMC free article] [PubMed] [Google Scholar]
- Nakashima K, Yanagisawa M, Arakawa H, Kimura N, Hisatsune T, Kawabata M, Miyazono K, Taga T. 1999. Synergistic signaling in fetal brain by STAT3‐Smad1 complex bridged by p300. Science 284:479–482. [DOI] [PubMed] [Google Scholar]
- Nakayama K. 1997. Furin: A mammalian subtilisin/Kex2p‐like endoprotease involved in processing of a wide variety of precursor proteins. Biochem J 327:625–635. [DOI] [PMC free article] [PubMed] [Google Scholar]
- Ohsawa K, Imai Y, Nakajima K, Kohsaka S. 1997. Generation and characterization of a microglial cell line, MG5, derived from a p53‐deficient mouse. Glia 21:285–298. [PubMed] [Google Scholar]
- Oksanen A, Aittomäki S, Jankovic D, Ortutay Z, Pulkkinen K, Hämäläinen S, Rokka A, Corthals GL, Watford WT, Junttila I, O'Shea JJ, Pesu M. 2014. Proprotein convertase FURIN constrains Th2 differentiation and is critical for host resistance against Toxoplasma gondii . J Immunol 193:5470–5479. [DOI] [PMC free article] [PubMed] [Google Scholar]
- Paolicelli RC, Bolasco G, Pagani F, Maggi L, Scianni M, Panzanelli P, Giustetto M, Ferreira TA, Guiducci E, Dumas L, Ragozzino D, Gross CT. 2011. Synaptic pruning by microglia is necessary for normal brain development. Science 333:1456–1458. [DOI] [PubMed] [Google Scholar]
- Pesu M, Muul L, Kanno Y, O'Shea JJ. 2006. Proprotein convertase furin is preferentially expressed in T helper 1 cells and regulates interferon gamma. Blood 108:983–985. [DOI] [PMC free article] [PubMed] [Google Scholar]
- Prinz M, Priller J. 2014. Microglia and brain macrophages in the molecular age: From origin to neuropsychiatric disease. Nat Rev Neurosci 15:300–312. [DOI] [PubMed] [Google Scholar]
- Ren L, Lubrich B, Biber K, Gebicke‐Haerter PJ. 1999. Differential expression of inflammatory mediators in rat microglia cultured from different brain regions. Brain Res Mol Brain Res 65:198–205. [DOI] [PubMed] [Google Scholar]
- Safadi FF, Xu J, Smock SL, Rico MC, Owen TA, Popoff SN. 2001. Cloning and characterization of osteoactivin, a novel cDNA expressed in osteoblasts. J Cell Biochem 84:12–26. [DOI] [PubMed] [Google Scholar]
- Savage JC, Jay T, Goduni E, Quigley C, Mariani MM, Malm T, Ransohoff RM, Lamb BT, Landreth GE. 2015. Nuclear receptors license phagocytosis by trem2+ myeloid cells in mouse models of Alzheimer's disease. J Neurosci 35:6532–6543. [DOI] [PMC free article] [PubMed] [Google Scholar]
- Sawada M, Suzumura A, Yamamoto H, Marunouchi T. 1990. Activation and proliferation of the isolated microglia by colony stimulating factor‐1 and possible involvement of protein kinase C. Brain Res 509:119–124. [DOI] [PubMed] [Google Scholar]
- Sheng J, Ruedl C, Karjalainen K. 2015. Most tissue‐resident macrophages except microglia are derived from fetal hematopoietic stem cells. Immunity 43:382–393. [DOI] [PubMed] [Google Scholar]
- Shikano S, Bonkobara M, Zukas PK, Ariizumi K. 2001. Molecular cloning of a dendritic cell‐associated transmembrane protein, DC‐HIL, that promotes RGD‐dependent adhesion of endothelial cells through recognition of heparan sulfate proteoglycans. J Biol Chem 276:8125–8134. [DOI] [PubMed] [Google Scholar]
- Shimizu E, Kawahara K, Kajizono M, Sawada M, Nakayama H. 2008. Interleukin‐4‐induced selective clearance of oligomeric β‐amyloid1‐42 by rat type 2 microglia. J Immunol 181:6503–6513. [DOI] [PubMed] [Google Scholar]
- Spreafico R, Frassoni C, Arcelli P, Selvaggio M, De Biasi S. 1995. In situ labeling of apoptotic cell death in the cerebral cortex and thalamus of rats during development. J Comp Neurol 363:281–295. [DOI] [PubMed] [Google Scholar]
- Stevens B, Allen NJ, Vazquez LE, Howell GR, Christopherson KS, Nouri N, Micheva KD, Mehalow AK, Huberman AD, Stafford B, Sher A, Litke AM, Lambris JD, Smith SJ, John SW, Barres BA. 2007. The classical complement cascade mediates CNS synapse elimination. Cell 131:1164–1178. [DOI] [PubMed] [Google Scholar]
- Streit WJ. 2001. Microglia and macrophages in the developing CNS. Neurotoxicology 22:619–624. [DOI] [PubMed] [Google Scholar]
- Suzumura A, Mezitis SG, Gonatas NK, Silberberg DH. 1987. MHC antigen expression on bulk isolated macrophage‐microglia from newborn mouse brain: Induction of Ia antigen expression by gamma‐interferon. J Neuroimmunol 15:263–278. [DOI] [PMC free article] [PubMed] [Google Scholar]
- Tajiri S, Oyadomari S, Yano S, Morioka M, Gotoh T, Hamada JI, Ushio Y, Mori M. 2004. Ischemia‐induced neuronal cell death is mediated by the endoplasmic reticulum stress pathway involving CHOP. Cell Death Differ 11:403–415. [DOI] [PubMed] [Google Scholar]
- Tanaka H, Shimazawa M, Kimura M, Takata M, Tsuruma K, Yamada M, Takahashi H, Hozumi I, Niwa J, Iguchi Y, Nikawa T, Sobue G, Inuzuka T, Hara H. 2012. The potential of GPNMB as novel neuroprotective factor in amyotrophic lateral sclerosis. Sci Rep 2:573. [DOI] [PMC free article] [PubMed] [Google Scholar]
- Theos AC, Truschel ST, Raposo G, Marks MS. 2005. The Silver locus product Pmel17/gp100/Silv/ME20: Controversial in name and in function. Pigment Cell Res 18:322–336. [DOI] [PMC free article] [PubMed] [Google Scholar]
- Tian S. 2009. A 20 residues motif delineates the furin cleavage site and its physical properties may influence viral fusion. Biochem Insights 2:9–20. [Google Scholar]
- Tsuji A, Ikoma T, Hashimoto E, Matsuda Y. 2002. Development of selectivity of α1‐antitrypsin variant by mutagenesis in its reactive site loop against proprotein convertase. A crucial role of the P4 arginine in PACE4 inhibition. Protein Eng 15:123–130. [DOI] [PubMed] [Google Scholar]
- Ueno M, Fujita Y, Tanaka T, Nakamura Y, Kikuta J, Ishii M, Yamashita T. 2013. Layer V cortical neurons require microglial support for survival during postnatal development. Nat Neurosci 16:543–551. [DOI] [PubMed] [Google Scholar]
- Weterman MA, Ajubi N, van Dinter IM, Degen WG, van Muijen GN, Ruitter DJ, Bloemers HP. 1995. nmb, a novel gene, is expressed in low‐metastatic human melanoma cell lines and xenografts. Int J Cancer 60:73–81. [DOI] [PubMed] [Google Scholar]
- Wilson GN, Inman DM, Denger‐Crish CM, Smith MA, Crish SD. 2015. Early pro‐inflammatory cytokine elevations in the DBA/2J mouse model of glaucoma. J Neuroinflammation 12:176. [DOI] [PMC free article] [PubMed] [Google Scholar]
- Woo HJ, Shaw LM, Messier JM, Mercurio AM. 1990. The major non‐integrin laminin binding protein of macrophages is identical to carbohydrate binding protein 35 (Mac‐2). J Biol Chem 265:7097–7099. [PubMed] [Google Scholar]
Associated Data
This section collects any data citations, data availability statements, or supplementary materials included in this article.
Supplementary Materials
Supporting Information 1
Supporting Information 2
Supporting Information Figure 1
Supporting Information Figure 2
Supporting Information Figure 3
Supporting Information Figure 4
Supporting Information Figure 5
Supporting Information Video 1
Supporting Information Video 2


