Abstract
We investigated a patient who developed multiple sclerosis (MS) during treatment with the CTLA4‐blocking antibody ipilimumab for metastatic melanoma. Initially he showed subclinical magnetic resonance imaging (MRI) changes (radiologically isolated syndrome). Two courses of ipilimumab were each followed by a clinical episode of MS, 1 of which was accompanied by a massive increase of MRI activity. Brain biopsy confirmed active, T‐cell type MS. Quantitative next generation sequencing of T‐cell receptor genes revealed distinct oligoclonal CD4+ and CD8+ T‐cell repertoires in the primary melanoma and cerebrospinal fluid. Our results pinpoint the coinhibitory molecule CTLA4 as an immunological checkpoint and therapeutic target in MS. Ann Neurol 2016;80:294–300
An autoimmune pathogenesis of multiple sclerosis (MS) is supported by different indirect arguments, including the partial efficacy of immunomodulatory treatments, analogies with autoimmune animal models of central nervous system (CNS) inflammation, and converging evidence from genetics studies.1, 2, 3, 4 Specifically, genome‐wide association studies (GWAS) identified numerous risk variants implicated in the regulation, differentiation, or activation of T lymphocytes.5, 6 The strongest genetic risk factor is HLA‐DRB1*15:01, which encodes a molecule that presents peptide antigens to CD4+ T lymphocytes. Additional genetic risk variants include CD80 and CD86, which are the binding partners of costimulatory (CD28) and coinhibitory (CTLA4) molecules expressed on T cells.1, 3, 4, 5, 6 Molecular candidates revealed by GWAS need to be corroborated by functional evidence. Here we pinpoint CTLA4 as an immunological checkpoint in the development of MS.
Patient and Methods
Written informed consent was obtained from the patients according to the Declaration of Helsinki. Immunological and cerebrospinal fluid (CSF) investigations were approved by the local ethics committee.
Histology
Formalin‐fixed paraffin‐embedded (FFPE) sections of the melanoma and brain biopsy specimen were processed and stained according to standard procedures. The panel of antibodies used for immunohistochemistry is shown in Supplementary Table 1.
Isolation of CSF Cells
CD8+ and CD4+ T cells were isolated by sequential positive selection with magnetic beads (Miltenyi Biotec, Bergisch Gladbach, Germany) from CSF collected at 2 successive time points (CSF#2 and CSF#3; Fig 1). Cells were stored in TRIzol (Thermo Fisher Scientific, Waltham, MA) at −80°C until use.
Figure 1.

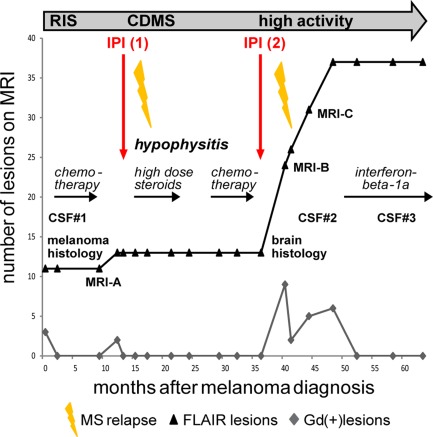
Synopsis of the clinical course. An overview of the course, treatments, serial magnetic resonance imaging (MRI) changes, and time points of cerebrospinal fluid (CSF) samplings is presented. Before ipilimumab (IPI) treatment was begun, the patient had subclinical MRI activity fulfilling the criterion of dissemination in time (radiologically isolated syndrome (RIS)). Each course of ipilimumab was followed by a clinical episode of multiple sclerosis (MS), the first of which marked transition to clinically definite MS (CDMS). At the time of melanoma diagnosis and staging (RIS), cranial MRI showed a total of 11 fluid‐attenuated inversion recovery (FLAIR) and 3 Gadolinium enhancing (Gd+) lesions; 4 months after the second course of ipilimumab, MRI showed 24 cumulative FLAIR and 9 new Gd+ lesions; 10 months after the second course of ipilimumab, MRI showed 37 cumulative FLAIR and 6 Gd+ lesions.
T‐Cell Receptor Analysis Using Next Generation Sequencing and Unique Molecular Identifiers
To correct for polymerase chain reaction (PCR) biases and errors during next generation sequencing (NGS), we used unique molecular identifiers (UMIs) for quantitative T‐cell receptor (TCR) repertoire analysis.7 cDNA was synthesized from sorted CSF cells and FFPE melanoma sections using the SmartScribe Kit (Clontech Laboratories, Mountain View, CA). cDNA synthesis products were treated with fresh uracil‐DNA glycosylase (New England BioLabs, Ipswich, MA). This was followed by 2 nested PCRs, 27 cycles each. Primers are listed in Supplementary Table 2. Adaptors and barcodes were added using Ovation Ultralow System V2 (NuGEN, San Carlos, CA). Libraries were analyzed by Illumina (San Diego, CA) MiSeq at IMGM Laboratories (Planegg, Germany).
Bioinformatics Analysis of NGS Data
Raw TCR sequences were processed using the MIGEC Checkout utility (https://milaboratory.com/software/migec/) and uploaded in IMGT/HighV‐QUEST (http://www.imgt.org/HighV-QUEST/). We selected for in‐frame sequences containing complete TCR CDR3 regions. We obtained a total of 1,341 TCRα and 336 TCRβ reads, and 21,176 TCRα and 24,356 TCRβ reads, from FFPE and CSF samples, respectively. To deduce the original cDNA sequence, we clustered all reads tagged with identical UMIs.7 Filtering yielded 340 TCRα and 150 TCRβ reads, and 4,069 TCRα reads and 5,553 TCRβ reads, from FFPE and CSF samples, respectively.
Results
Course of Melanoma
A 29‐year‐old man presented in August 2010 with ulcerated nodular melanoma of his right ear helix (Breslow thickness = 4.5cm) and metastatic spread to lymph nodes and bone (rib). The primary tumor was excised and classified as positive for NRAS Q61R, negative for BRAF and KIT (exons 9, 11, 13, 17, 18) mutations. Six courses of dacarbazine (5‐[3,3‐dimethyl‐1‐triazeno]imidazole‐4‐carboxamide; 1,000mg/m2 intravenously [i.v.]) followed by the MEK inhibitor binimetinib (45mg orally twice daily for 2 months within a clinical trial) failed to control metastasis progression.
Therefore, treatment with the CTLA4 antibody ipilimumab was initiated (4 infusions, 3mg/kg body weight, at 3‐weekly intervals), resulting in regression of lymph node metastases. Shortly after the last infusion of ipilimumab, the patient developed severe hypophysitis. Despite treatment with high‐dose glucocorticosteroids, hypopituitarism persisted as a known immune‐related adverse event of ipilimumab.8
Because of melanoma progression diagnosed 1 year later, 6 cycles of carboplatin (area under the curve = 5) and paclitaxel (175mg/m2) were administered i.v., followed by reinduction with ipilimumab (4 infusions, 3 mg/kg body weight, 3‐weekly intervals). Since then, regular follow‐ups including fluorodeoxyglucose positron emission tomography–computed tomography (lastly in February 2016) confirmed stable disease without evidence of new or progressing lesions.
Course of MS
Evidence of radiologically isolated syndrome (RIS) was first observed during the initial tumor staging in August 2010 (see Fig 1 for a synopsis of the clinical data). At that time, cerebral magnetic resonance imaging (MRI; T2 and fluid‐attenuated inversion recovery) showed multiple clinically silent white matter lesions. Subclinical CNS inflammation was confirmed by CSF analysis (CSF#1; 15/µl, elevated protein [50mg/dl], oligoclonal bands [OCB]+; no material available for TCR‐repertoire analysis). In August 2011, a new subclinical Gd+ lesion was detected, indicating subclinical dissemination in time.9
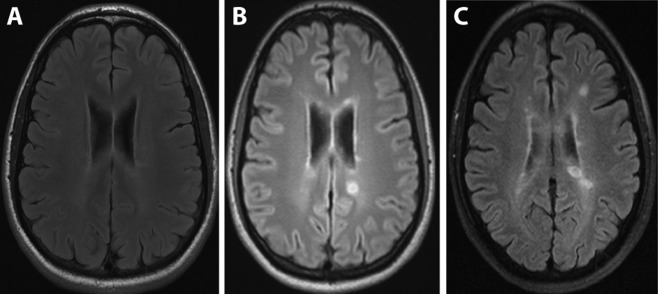
The first clinical episode of MS occurred in March 2012, 4 months after the last infusion of the first course of ipilimumab (see Fig 1). The patient noted thermhypesthesia of both feet lasting for about 3 weeks. Because MRI evidence of dissemination in time had already been obtained during the preceding RIS phase, a diagnosis of clinically definite MS (CDMS) could be made at the time of the first clinical episode. After the first course of ipilimumab, MRI activity was presumably blunted because the patient was treated with high‐dose corticosteroids for hypophysitis; the second course was followed by a massive increase of MRI activity (Figs 1 and 2). In January 2014, a biopsy of a left‐sided periventricular brain lesion was performed to rule out cerebral melanoma metastasis. Histopathological examination showed active MS (T‐cell type [pattern 1],10 see next section). In February 2014, 3 months after the last ipilimumab infusion, the patient presented with left‐sided optic neuritis with reduced visual acuity (0.4). Neurological examination was unremarkable except for the visual disturbances and exaggerated reflexes of both legs. CSF analysis (CSF#2) showed inflammatory changes (OCB+, 39/µl mononuclear cells, no malignant cells). Visual acuity improved after a course of high‐dose glucocorticosteroids. Initial follow‐up cerebral MRI scans repeatedly demonstrated high disease activity. Since immunomodulatory treatment with interferon beta‐1a was initiated in November 2014, MS has remained stable, including cranial MRI (October 2015).
Figure 2.

Course of magnetic resonance imaging (MRI). Representative serial cranial MRI scans (fluid‐attenuated inversion recovery) were performed at the stage of radiologically isolated syndrome before ipilimumab treatment (A), and 4 months (B) or 10 months (C) after the second course of ipilimumab. The time points of MRI A to C are indicated in Figure 1.
Histological and Immunological Investigations
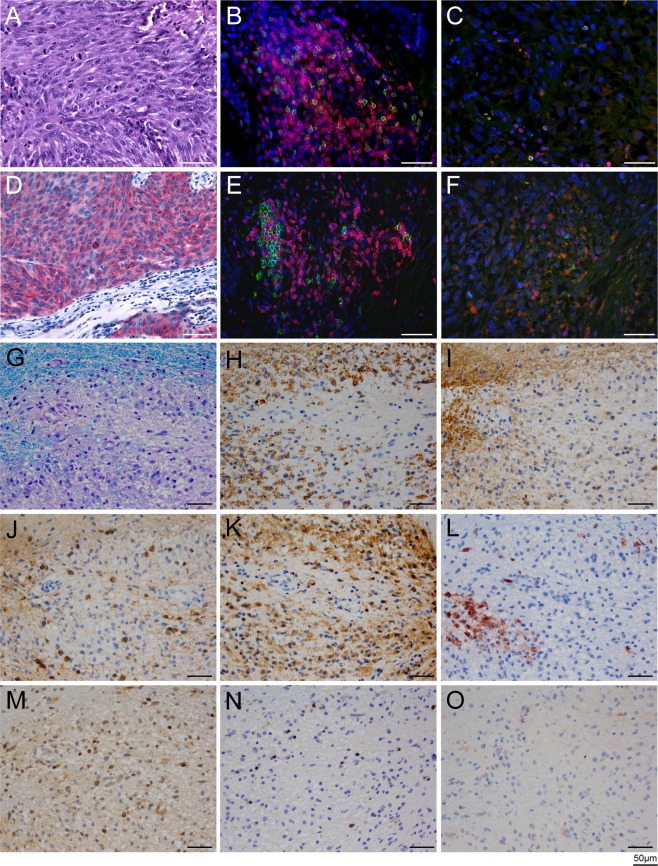
The primary melanoma contained a dense infiltrate of CD3+ T cells and CD20+ B cells at the tumor border (Fig 3A–F). The ratio of total CD3+ to CD8+ T cells was 3.4:1, and the ratio of CD3+ T cells to CD20+ B cells was 3:1 in the melanoma. Quantitative NGS analysis of the TCR repertoire in the melanoma identified numerous strong clonal expansions of both TCR α‐ and TCR ß‐chains (Fig 4).
Figure 3.

Histology of the primary melanoma (A–F) and active demyelinating multiple sclerosis (MS) lesion (G–O). (A–F) Hematoxylin and eosin staining of the primary melanoma is shown in A. Melanoma cells exhibit strong cytoplasmic staining for Melan‐A (D). Double‐stainings for CD3 (red) and CD8 (green; B, C), and double staining for CD3+ (red) and CD20 (green; E, F) show infiltration of immune cells into the epidermis (B, E), as well as scattered T and B cells in the tumor (C, F). The ratios of total (CD3+) T cells to cytotoxic (CD8+) T cells, and total (CD3+) T cells to CD20+ B cells, were 3.4:1 and 3:1, respectively. Nuclei are stained in blue with DAPI. (G–O) Brain biopsy specimen of active demyelinating MS lesion. Region of active demyelination with numerous foamy macrophages containing myelin debris (G, stained with Luxol fast blue/periodic acid–Schiff; H, stained for myelin proteolipid protein) is shown. The foamy macrophages also contained fragments of myelin oligodendrocyte glycoprotein (I). J shows Nogo A–positive, viable oligodendrocytes in the demyelinated area; K shows dense infiltration of foamy macrophages and activated microglia with KiM1P immunohistochemistry. Some foamy macrophages are positive for the early macrophage activation marker MRP14 (L). Scattered CD3+ T cells are present in the demyelinated area (M); most infiltrating T cells are CD8+ (N). The foamy macrophages stain negative for complement C9neo, as is typical for pattern 1 MS lesions10 (O). All scale bars represent 50 μm.
Figure 4.

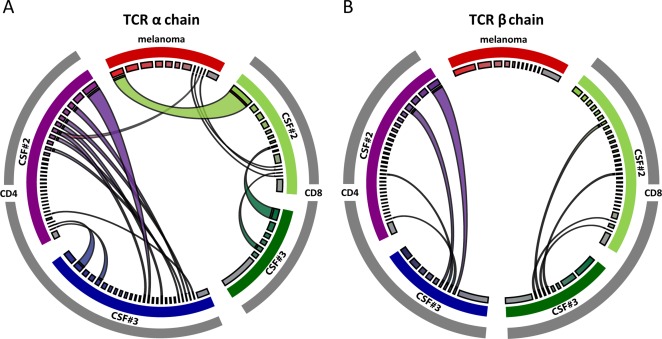
Next generation sequencing of the T‐cell receptor (TCR) repertoire in the primary melanoma and 2 consecutive cerebrospinal fluid (CSF) samples (CSF#2 and CSF#3; cf Fig 1). (A) The TCR α‐chain repertoire is shown on the left. (B) The TCR ß‐chain repertoire is shown on the right. The TCR repertoire of the melanoma is highlighted in red at the top of each circle; the CD4+ TCR repertoire of CSF#2 and CSF#3 is shown in purple and blue on the left of each circle, and the CD8+ TCR repertoire of CSF#2 and CSF#3 is shown in light and dark green on the right of each circle. The widths of the colored segments of the inner circles indicate the relative abundance of each T‐cell clone; the polyclonal background is depicted in gray (inner circle). Expanded T‐cell clones shared between the compartments are visualized as semicircular connections. There are several overlaps, mostly of CD8+ TCR α‐chains, between the melanoma and CSF#2, but not CSF#3 (A). Furthermore, there are overlaps between CSF#2 and CSF#3 at all levels (TCR α‐ and ß‐chains; CD4+ and CD8+ T cells; A and B). The CSF‐specific, persistent clonal expansions likely contribute to multiple sclerosis in this patient. Images were generated using CIRCOS software (http://circos.ca/).
To rule out brain metastasis, a stereotactic biopsy was performed after the second course of ipilimumab when the patient developed numerous contrast‐enhancing cerebral lesions. The brain lesion was classified as pattern 1 (T‐cell type) MS (see Fig 3G–O).10
CSF#2 (39/µl, OCB+), obtained 5 months after the second course of ipilimumab, contained conspicuous clonal expansions of CD4+ and CD8+ T cells. Of note, several expanded TCR α‐chain sequences were shared with the primary tumor resected in 2010 (see Fig 4A). CSF#3 (8/µl, OCB+), obtained almost 1 year after the second course of ipilimumab, still contained several clonal expansions of TCR α‐ and TCR ß‐chains of CD4+ and CD8+ T cells. However, in contrast to CSF#2, there was essentially no overlap with TCR sequences from the tumor. By contrast, several clonal expansions of CD4+ and CD8+ T cells were prominent in both CSF samples but not in the tumor (see Fig 4).
Discussion
Our clinical, serial MRI, histopathological, and immunological observations indicate that CTLA4 is an immunological checkpoint in the development of MS, that is, transition from subclinical RIS to CDMS as observed here. Although other treatments administered to this patient might have acted as confounders, the close temporal relationship of ipilimumab administration to the documented increases of clinical or MRI activity, coupled with genetic data from the literature, provide a reasonable basis to presume that the observed increases of disease activity were induced by anti‐CTLA4 treatment. This interpretation is further supported by 2 additional recent case reports.11, 12 The first report describes a patient with preexisting multiple sclerosis who had 2 clinical exacerbations and increased MRI activity shortly after initiation of ipilimumab for metastatic melanoma.11 The second report describes a 76‐year‐old patient who developed apparently de novo inflammatory CNS demyelination after treatment with ipilimumab for metastatic melanoma in combination with gamma knife stereotactic radiosurgery (SRS).12 Although SRS can induce inflammatory demyelination in the radiation field, the white matter lesions occurred too early after irradiation and were too widespread to be induced by SRS in this patient.12 A third report13 describes a patient whose MS seemed to remain stable after treatment with ipilimumab for melanoma, but the tumor did not respond to ipilimumab, and the patient died due to melanoma progression.
The coinhibitory molecule CTLA4 is a structural homologue of the costimulatory molecule CD28.14, 15 Both molecules are expressed on T cells but they are differently regulated, and their distribution varies among T‐cell subsets. CTLA4 is constitutively expressed on regulatory T cells, and is upregulated on conventional T cells after activation. Part of CTLA4 function is achieved by interaction with CD80 and CD86, which are expressed on antigen‐presenting cells (APC). Downregulation of CD80 and CD86 by CTLA4 inhibits the antigen‐presenting capacity of APC and thereby dampens T‐cell activation.14, 15
“Immune checkpoint therapy” is a promising strategy for treating cancer,16 and inadvertent stimulation of autoimmune responses is a known risk of checkpoint therapies.12, 17 However, the precise mechanisms of CTLA4 function are very complex and only incompletely understood. For example, functional studies in conditionally CTLA4‐depleted mice showed that CTLA4 deletion in adult mice had opposing impact on different autoimmune models,18 and that deletion of CTLA4 during adulthood even conferred protection from experimental autoimmune encephalomyelitis (EAE),18, 19 whereas anti‐CTLA4 antibody exacerbated EAE in other models.20, 21 Our observations indicate that the net effect of ipilimumab in treated human subjects is stimulatory, unleashing preexisting antitumor and anti‐CNS autoimmune responses.
To investigate the T‐cell responses activated by the anti‐CTLA4 antibody, we compared the TCR repertoire of tumor‐infiltrating T cells present in the primary melanoma, which was resected before ipilimumab therapy was begun, with the TCR repertoire in 2 consecutive CSF samples taken 5 months and 13 months after the second course of ipilimumab therapy (CSF#2 and CSF#3). Using quantitative NGS, we identified distinct clonal expansions of CD4+ and CD8+ T cells in the melanoma and CSF. Interestingly, there was considerable overlap between the TCR repertoire in the tumor and the first (CSF#2), but not second (CSF#3) sample (see Fig 4). Conversely, several expanded T‐cell clones were present in both CSF samples, but not in the melanoma.
We interpret these findings to indicate that the protective antitumor response and the inadvertent anti‐CNS autoimmune response are directed against different antigens, and therefore, composed of distinct TCR clonotypes. We further assume that activated, tumor‐specific T cells transiently entered the CNS compartment. It is known that activated T cells can reach the CSF as bystanders, even if they do not recognize CNS antigen.22, 23 By contrast, the clonally expanded CD4+ and CD8+ T cells, which were detectable in both consecutive CSF samples but not in the melanoma, might participate in the autoimmune process of MS in this patient. However, without knowing their detailed phenotype or target specificity, it remains open whether the “CSF‐specific” CD4+ and CD8+ T‐cell expansions act as autoaggressive effectors or protective regulatory cells.
In more general terms, our observations support the autoimmune pathogenesis of MS, and specifically, underline the central importance of autoreactive T cells in the pathogenesis of MS.24, 25 Moreover, they provide functional support for GWAS that implicated T‐cell costimulatory and coinhibitory molecular networks as genetic risk factors of MS.1, 3, 4, 5, 6 A comprehensive Web‐based human genetics resource, ImmunoBase (https://www.immunobase.org), yields strong MS‐related hits for CD86 and CD80. CTLA4 and CD28, which map close to each other, do not yield strong signals directly over the genes, but in a presumed regulatory region located between the two genes.
As a checkpoint of transition from RIS to CDMS, CTLA4 could be a worthwhile target for immune intervention. In a phase 1 therapeutic trial, the CTLA4 pathway was targeted with soluble CTLA4‐Ig, a CTLA4 agonist.26 No adverse safety signals were observed in the pilot trial.26 An NIH‐sponsored follow‐up phase 2 trial of CTLA4‐Ig is currently underway (https://clinicaltrials.gov/ct2/show/NCT01116427?term=CTLA-4+Ig+multiple+sclerosis&rank=1).
Author Contributions
L.A.G., K.H., E.B., K.D., and R.H. contributed equally to this work. Conception and design of the study: L.A.G., K.H., E.B., T.K., K.D., R.H. Acquisition and analysis of data: all authors. Drafting a significant portion of the manuscript or figures: L.A.G., K.H., E.B., A.J., C.B., T.K., K.D., R.H.
Potential Conflicts of Interest
C.B. has received advisor's honoraria and travel support from Bristol‐Myers Squibb.
Supporting information
Additional supporting information can be found in the online version of this article.
Supporting Information
Acknowledgment
This work was supported by the German Research Foundation (DFG TRR128/A5, SyNergy EXC 1010), German Federal Ministry of Education and Research (Multiple Sclerosis Disease‐Related Competence Network and Validation of the Innovation Potential of Scientific Research 0376‐03V0511), Sander Foundation, Cyliax Foundation, and the association “Verein Therapieforschung für MS – Kranke e.V.”
We thank Prof. Dr. F.W. Kreth for performing the stereotactic brain biopsy.
References
- 1. Gourraud PA, Harbo HF, Hauser SL, Baranzini SE. The genetics of multiple sclerosis: an up‐to‐date review. Immunol Rev 2012;248:87–103. [DOI] [PMC free article] [PubMed] [Google Scholar]
- 2. Dendrou CA, Fugger L, Friese MA. Immunopathology of multiple sclerosis. Nat Rev Immunol 2015;15:545–558. [DOI] [PubMed] [Google Scholar]
- 3. Nylander A, Hafler DA. Multiple sclerosis. J Clin Invest 2012;122:1180–1188. [DOI] [PMC free article] [PubMed] [Google Scholar]
- 4. Sawcer S, Franklin RJ, Ban M. Multiple sclerosis genetics. Lancet Neurol 2014;13:700–709. [DOI] [PubMed] [Google Scholar]
- 5. Sawcer S, Hellenthal G, Pirinen M, et al. Genetic risk and a primary role for cell‐mediated immune mechanisms in multiple sclerosis. Nature 2011;476:214–219. [DOI] [PMC free article] [PubMed] [Google Scholar]
- 6. Beecham AH, Patsopoulos NA, Xifara DK, et al. Analysis of immune‐related loci identifies 48 new susceptibility variants for multiple sclerosis. Nat Genet 2013;45:1353–1360. [DOI] [PMC free article] [PubMed] [Google Scholar]
- 7. Shugay M, Britanova OV, Merzlyak EM, et al. Towards error‐free profiling of immune repertoires. Nat Methods 2014;11:653–655. [DOI] [PubMed] [Google Scholar]
- 8. Lammert A, Schneider HJ, Bergmann T, et al. Hypophysitis caused by ipilimumab in cancer patients: hormone replacement or immunosuppressive therapy. Exp Clin Endocrinol Diabetes 2013;121:581–587. [DOI] [PubMed] [Google Scholar]
- 9. Okuda DT, Mowry EM, Beheshtian A, et al. Incidental MRI anomalies suggestive of multiple sclerosis: the radiologically isolated syndrome. Neurology 2009;72:800–805. [DOI] [PubMed] [Google Scholar]
- 10. Lucchinetti C, Brück W, Parisi J, et al. Heterogeneity of multiple sclerosis lesions: implications for the pathogenesis of demyelination. Ann Neurol 2000;47:707–717. [DOI] [PubMed] [Google Scholar]
- 11. Gettings EJ, Hackett CT, Scott TF. Severe relapse in a multiple sclerosis patient associated with ipilimumab treatment of melanoma. Mult Scler 2015;21:670. [DOI] [PubMed] [Google Scholar]
- 12. Cao Y, Nylander A, Ramanan S, et al. CNS demyelination and enhanced myelin‐reactive responses after ipilimumab treatment. Neurology 2016;86:1553–1556. [DOI] [PMC free article] [PubMed] [Google Scholar]
- 13. Kyi C, Carvajal RD, Wolchok JD, Postow MA. Ipilimumab in patients with melanoma and autoimmune disease. J Immunother Cancer 2014;2:35. [DOI] [PMC free article] [PubMed] [Google Scholar]
- 14. Walker LS, Sansom DM. The emerging role of CTLA4 as a cell‐extrinsic regulator of T cell responses. Nat Rev Immunol 2011;11:852–863. [DOI] [PubMed] [Google Scholar]
- 15. Schildberg FA, Klein SR, Freeman GJ, Sharpe AH. Coinhibitory pathways in the B7‐CD28 ligand‐receptor family. Immunity 2016;44:955–972. [DOI] [PMC free article] [PubMed] [Google Scholar]
- 16. Sharma P, Allison JP. The future of immune checkpoint therapy. Science 2015;348:56–61. [DOI] [PubMed] [Google Scholar]
- 17. Weber JS, Kahler KC, Hauschild A. Management of immune‐related adverse events and kinetics of response with ipilimumab. J Clin Oncol 2012;30:2691–2697. [DOI] [PubMed] [Google Scholar]
- 18. Klocke K, Sakaguchi S, Holmdahl R, Wing K. Induction of autoimmune disease by deletion of CTLA‐4 in mice in adulthood. Proc Natl Acad Sci U S A 2016;113:E2383–E2392. [DOI] [PMC free article] [PubMed] [Google Scholar]
- 19. Paterson AM, Lovitch SB, Sage PT, et al. Deletion of CTLA‐4 on regulatory T cells during adulthood leads to resistance to autoimmunity. J Exp Med 2015;212:1603–1621. [DOI] [PMC free article] [PubMed] [Google Scholar]
- 20. Karandikar NJ, Vanderlugt CL, Walunas TL, et al. CTLA‐4: a negative regulator of autoimmune disease. J Exp Med 1996;184:783–788. [DOI] [PMC free article] [PubMed] [Google Scholar]
- 21. Perrin PJ, Maldonado JH, Davis TA, et al. CTLA‐4 blockade enhances clinical disease and cytokine production during experimental allergic encephalomyelitis. J Immunol 1996;157:1333–1336. [PubMed] [Google Scholar]
- 22. Steinman L. A few autoreactive cells in an autoimmune infiltrate control a vast population of nonspecific cells: a tale of smart bombs and the infantry. Proc Natl Acad Sci U S A 1996;93:2253–2256. [DOI] [PMC free article] [PubMed] [Google Scholar]
- 23. Schlager C, Korner H, Krueger M, et al. Effector T‐cell trafficking between the leptomeninges and the cerebrospinal fluid. Nature 2016;530:349–353. [DOI] [PubMed] [Google Scholar]
- 24. Hohlfeld R, Dornmair K, Meinl E, Wekerle H. The search for the target antigens of multiple sclerosis, part 1: autoreactive CD4 + T lymphocytes as pathogenic effectors and therapeutic targets. Lancet Neurol 2016;15:198–208. [DOI] [PubMed] [Google Scholar]
- 25. Hohlfeld R, Dornmair K, Meinl E, Wekerle H. The search for the target antigens of multiple sclerosis, part 2: CD8 + T cells, B cells, and antibodies in the focus of reverse‐translational research. Lancet Neurol 2016;15:317–331. [DOI] [PubMed] [Google Scholar]
- 26. Viglietta V, Bourcier K, Buckle GJ, et al. CTLA4Ig treatment in patients with multiple sclerosis: an open‐label, phase 1 clinical trial. Neurology 2008;71:917–924. [DOI] [PubMed] [Google Scholar]
Associated Data
This section collects any data citations, data availability statements, or supplementary materials included in this article.
Supplementary Materials
Additional supporting information can be found in the online version of this article.
Supporting Information


