

Abstract
BACKGROUND
Fifteen states bar or propose to bar Planned Parenthood affiliates from providing health care services with public funds. After courts blocked exclusion from the Texas Medicaid fee-for-service family planning program, on January 1, 2013, Texas excluded Planned Parenthood from a state-funded replacement program. We assessed contraceptive method provision, method continuation through the program, and Medicaid-paid deliveries before and after the Planned Parenthood exclusion.
METHODS
Using all claims under Texas’ fee-for-service family planning programs in 2011 – 2014, we examined change in contraceptive provision by method before and after the Planned Parenthood exclusion. For injectable contraceptive users at baseline, we observed contraceptive continuation through the program and Medicaid-paid deliveries. We used difference-in-differences to compare changes in outcomes between counties with and without Planned Parenthood clinics.
RESULTS
Following the Planned Parenthood exclusion, there was a 35% (369/1040) decline (p<0.001) in provision of long-acting reversible contraceptive methods, a 31% (2123/6832) decline (p<0.001) in use of injectable contraceptives; there was no significant change in the use of short-acting hormonal contraceptive methods. Among users of injectable contraceptives, there was 22% lower contraceptive continuation in the program (p<0.001) following the exclusion, and an additional 1.9% of women (27% increase) had Medicaid-paid deliveries within 18 months (p=0.014).
CONCLUSIONS
Texas’s exclusion of Planned Parenthood from a state-funded replacement for a Medicaid fee-for-service program was associated with adverse changes in provision of contraception, and for injectable contraceptive users, a decline in contraceptive continuation through the program and an increase in Medicaid-paid deliveries. (Funded by the Susan T. Buffett Foundation.)
INTRODUCTION
United States federal public health funding streams, from Medicare and Medicaid to block grants and the Affordable Care Act, all rely on an array of public and private entities to deliver health care services. Historically, federal statute or rule has required that all medically qualified providers be eligible to provide care funded in whole or part through federal programs. In 15 states as well as the US Senate, legislation challenging this tradition by excluding Planned Parenthood affiliates from participation in state-administered federally-funded family planning programs has been adopted or proposed.1 Texas was the first state to enforce such a law.
Beginning in 2007, Texas operated a Medicaid waiver program, the Women’s Health Program, with 90% federal funds.2 The Texas legislature directed the program to exclude Planned Parenthood affiliates in 2011. The federal Centers for Medicare and Medicaid Services informed Texas that because exclusion of medically qualified providers violated federal law, it would not renew the waiver, but would continue transition funding through the end of 2012. Litigation kept Planned Parenthood in the program until the transition funding ended. Texas replaced the federally-funded program with a nearly identical 100% state-funded program (the Texas Women’s Health Program) that excluded clinics affiliated with an abortion provider effective January 1, 2013.3
Effective fifteen months earlier (September 1, 2011), Texas had cut family planning grants (a separate funding stream) by 66% and redistributed the remaining grant funding away from dedicated family planning providers, such as but not limited to Planned Parenthood clinics. The Texas legislature did this by removing Title V and XX family planning funding, and requiring a new tiered grant award process favoring county health departments, community health centers, and other comprehensive care providers.4 The 2011 grant cuts and redistribution were followed by the closure of 82 family planning clinics, about a third of which were affiliated with Planned Parenthood.5 This sharp curtailment of the family planning safety net in Texas occurred before the 2013 exclusion of Planned Parenthood from the fee-for-service family planning program.
We used claims data for all clients of the Women’s Health Program and its replacement, the Texas Women’s Health Program, to assess changes in contraceptive provision following the exclusion. For users of injectable contraception (depot medroxyprogesterone acetate), we also estimate change in method continuation in the program and change in Medicaid-paid deliveries following the exclusion.
METHODS
Data Sources
We used all pharmacy and medical claims from January 1, 2011 through December 31, 2014 under Texas’ fee-for-service family planning insurance programs. We also linked to claims for Medicaid-paid deliveries using unique IDs for a subset of women. Women’s counties of Texas residence were retrieved from the eligibility and billing system, and Texas counties were identified as having or not having Planned Parenthood-affiliated providers at the beginning of the study based on administrative records from the Texas Department of State Health Services and Planned Parenthood.
By virtue of the programs’ eligibility criteria, all women served were fertile, legal Texas residents between ages 18 and 44 with incomes at or below 185% of the Federal Poverty Level. They were identified via billing records based on the presence of a medical claim with one or more of the Common Procedural Terminology (CPT) codes identified as a valid family planning service or a pharmacy claim with an appropriate national pharmacy code for a contraceptive method. For each quarter, we grouped methods into long-acting reversible contraceptives or LARCs (contraceptive implants and intrauterine devices), injectable contraceptives (depot medroxyprogesterone acetate), and short-acting hormonal methods (oral contraceptive pills, transdermal contraceptive patches, and contraceptive rings). We then separated each set of claims into those filed in counties that had a Planned Parenthood clinic in 2011, and those filed in counties without a Planned Parenthood clinic at that time.
Texas has 254 counties but only 23 had Planned Parenthood-affiliated clinics. We first compared these two sets of counties with respect to the number of women ages 18–44 with household incomes that would qualify them for the program (<185% of the Federal Poverty Level), the number of Medicaid deliveries to legal residents, and the percent of females ages 18–44 without insurance. We obtained these indicators from the American Community Survey, using five-year averages centered on 2011, and from Texas Medicaid billing records.6
Outcome Measures
We also assessed the quarterly volume of program contraceptive claims by method for counties with and without Planned Parenthood over the 16 observed quarters, 8 before and 8 after the exclusion. For injectable contraceptive users in counties with and without Planned Parenthood in the fourth quarters of 2011 and 2012, we also measured the proportion of women who returned for any service, returned for an on-time subsequent injection, and the proportion with a Medicaid-paid delivery in the following 18 months.
The study was determined exempt from human subjects review by the Institutional Review Board of the University of Texas at Austin; therefore, no informed consent was required. The authors designed the study, and the funder had no role in the analysis or interpretation of the data, writing the manuscript, or the decision to publish. All the authors vouch for the integrity and completeness of the data and analyses.
Statistical Analysis
Contraceptive Provision
We used difference-in-differences and regression discontinuity to compare the volume of each method’s provision before and after the exclusion on January 1, 2013 in counties with and without Planned Parenthood. This approach can account for the influence of time-invariant differences between counties with and without Planned Parenthood and statewide trends over time that could influence service provision.7
Based on the quarterly provision volumes of each method for counties with and without Planned Parenthood, we calculated the difference in provision between Planned Parenthood and non-Planned Parenthood counties for each quarter and each method. We fitted local linear regression models to summarize the differences in volumes for each method.8 In these models, we allowed the slopes and intercepts to vary before and after the exclusion using an indicator for quarters after the exclusion and an interaction between this indicator and quarter. We estimated the discontinuity in the differences at the point of the exclusion with the indicator for post-exclusion. Finally, we computed the proportional change in provision by dividing this parameter by the estimated provision in counties with Planned Parenthood at the point of exclusion – based on the value of the left-hand regression line at the point of exclusion.
Continuation and Medicaid Deliveries among Injectable Users
In order to assess changes in contraceptive continuation and subsequent Medicaid-paid deliveries associated with the exclusion of Planned Parenthood, we focused on women using injectable contraception. Unlike other methods, the method requires regular provider visits and has a relatively short span of contraceptive effectiveness (3 months). These features of the method allow us to observe changes in deliveries within 18 months of method receipt, which would not be possible with LARC methods (which last longer) and oral contraceptive pills (which may be dispensed for a single month or up to 12 months per claim).
We compared two cohorts: The first cohort received an injection in the fourth quarter of 2011 and thus had a year to continue receiving services before the Planned Parenthood exclusion took effect. The second cohort received an injection in the fourth quarter of 2012 and thus was subject to the influence of the exclusion before the due date for the next injection. For each cohort and type of county, we computed the proportions of women who received a service paid for by the program in the following quarter, who received an injection in that quarter, and who had a Medicaid-paid delivery in the following 18 months. We calculated difference-in-differences between the two cohorts and sets of counties. For the probability of returning the next quarter, receiving an on-time subsequent injection, and experiencing a Medicaid-paid birth within 18 months, we used generalized linear models for the response frequencies in the respective tables. In each model, we included an interaction term for Planned Parenthood counties and post-exclusion to provide a direct statistical test of the difference-in-differences in the probability of each outcome. The assumed distribution of the frequencies (either binomial or Poisson) did not substantially change the statistical significance of the tests. We report the p-values from the Poisson models because they were larger.
RESULTS
Change in provision of contraceptive methods
The 23 counties with Planned Parenthood affiliates were home to 60% of the Texas resident females 18–44 at or below 185% of the Federal Poverty Level (Table 1). The rates of having no insurance were similar for counties with and without Planned Parenthood. Of all of Texas’ Medicaid-paid deliveries to legal residents in 2012, 63% occurred in counties with Planned Parenthood. In the period before the exclusion, there were 82 family planning clinic closures in Texas,5 and the decline in the number of family planning clinics was greater in counties without Planned Parenthood than counties with Planned Parenthood.
Table 1.
Characteristics of counties with and without Planned Parenthood
| Counties with Planned Parenthood | Counties without Planned Parenthood | |
|---|---|---|
| Number of counties | 23 | 231 |
| Female population 18–44, < 185% Federal Poverty Level a | 1,071,000 | 708,000 |
| Uninsured female population 18–44 a | 33% | 34% |
| Medicaid-paid deliveries 2012 b | 97,075 | 58,198 |
| Family planning clinic closures 2011–2013 c | 33/194 = 17% | 49/167 = 29% |
2012 ACS 5-year estimates
Medicaid claims records, only for documented residents
Texas Policy Evaluation Project (See White et al 2015)
Figure 1 (left panel) displays quarterly provision of contraceptive methods in counties with and without Planned Parenthood. Before the exclusion, provision of both LARCs and injectables was declining in counties with and without Planned Parenthood, with somewhat sharper declines in those with Planned Parenthood affiliates. However, provision of short-acting hormonal methods was increasing in both types of counties in the 8 quarters before the exclusion.
Figure 1.
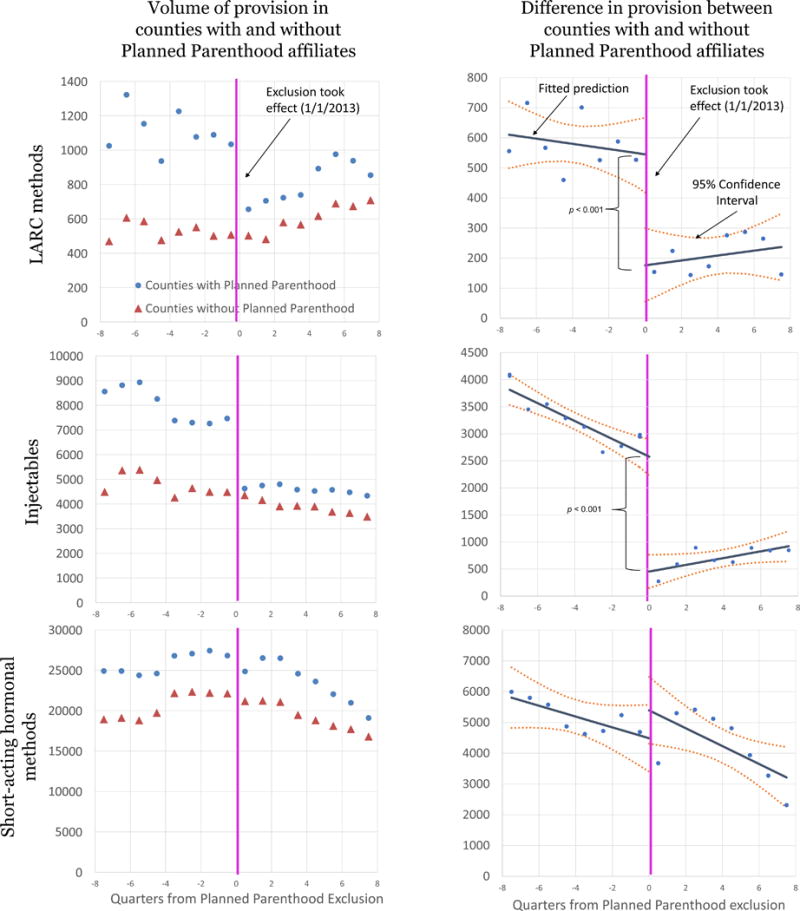
Quarterly Contraceptive Claims by Method
In the quarter following the exclusion, there was a sharp drop in LARC provision in counties with Planned Parenthood but not in the non-Planned Parenthood counties. In subsequent quarters, LARC provision increased in both types of counties. The provision of injectable contraception in counties with Planned Parenthood fell sharply after the exclusion and did not fall in non-Planned Parenthood counties, but remained relatively stable over the next 2 years in both sets of counties. In contrast, in both sets of counties, the provision of short-acting hormonal methods changed little in the quarter following the exclusion and declined steadily thereafter.
The difference in provision of each type of contraception in each quarter in counties with and without Planned Parenthood is shown in Figure 1 (right panel). Lines fitted to these points also appear in the figure. The change in the difference at the point of Planned Parenthood exclusion was significant for provision of LARCs (p<0.001) and injectable contraceptives (p<0.001), but not for short-acting hormonal methods (p=0.22). We estimate that the exclusion was associated with a 35% decline in LARC provision and a 31% decline in injectable provision.
Change in contraceptive continuation and deliveries among injectable contraceptive users
In Table 2 we compare contraceptive continuation and Medicaid-paid deliveries for women who received a contraceptive injection in the fourth quarter of 2011 and women who received a contraceptive injection in the fourth quarter of 2012. The proportion of women returning for a subsequent on-time contraceptive injection in counties with Planned Parenthood was lower after the exclusion. Specifically, the proportion declined from 56.9% to 37.7% in counties with Planned Parenthood, but increased from 54.9% to 58.5% in counties without Planned Parenthood (difference-in-differences estimate 22.9% (p<0.001)). This change represents a 40.2% decline. The exclusion was also associated with higher rates of Medicaid-paid deliveries within 18 months of injection. The proportion of women who had Medicaid-paid deliveries within 18 months increased from 7.0% to 8.4% in counties with Planned Parenthood and decreased from 6.4% to 5.9% in the counties without Planned Parenthood (difference-in-differences estimate 1.9% (p=0.014). This change represents a 27% increase in the proportion of injectable contraceptive users experiencing a Medicaid-paid delivery within 18 months.
Table 2.
Contraceptive Continuation and Medicaid Deliveries Among Injectable Contraceptive Users by Residence (percentages in parentheses)
| Counties with Planned Parenthood Affiliates | Counties without Planned Parenthood Affiliates | Difference-in-differences (DID) | |||||||
|---|---|---|---|---|---|---|---|---|---|
| Women receiving injection Q4 2011 | Women receiving injection Q4 2012 | Difference Q4 2011 to Q4 2012 | Women receiving injection Q4 2011 | Women receiving injection Q4 2012 | Difference Q4 2011 to Q4 2012 | DID (difference in percent change) | DID (percent of baseline) | P-value | |
| Received injection | 7541 | 6729 | −812 | 4653 | 4190 | −463 | |||
| Received any program service during next quarter | 5019 (66.6) | 3197 (47.5) | −1822 (−19.0) | 2970 (63.8) | 2805 (66.9) | 165 (3.1) | −22.2 | −33.3 | <0.001 |
| Received next injection on-time from program | 4290 (56.9) | 2535 (37.7) | −1755 (−19.2) | 2553 (54.9) | 2452 (58.5) | 101 (3.7) | −22.9 | −40.2 | <0.001 |
| Medicaid deliveries within 18 months | 529 (7.0) | 566 (8.4) | 37 (1.4) | 300 (6.4) | 248 (5.9) | −52 (−0.5) | 1.9 | 27.1 | 0.014 |
DISCUSSION
After Texas abruptly excluded Planned Parenthood from its fee-for-service family planning program, the volume of LARC methods dispensed declined, as did the number of contraceptive injections. Among users of injectable contraception who received an injection in the quarter preceding the exclusion, compared to an earlier cohort, fewer women continued receiving the method through the program, and there was a disproportionate increase in Medicaid-paid deliveries. Although we do not have data on intendedness of pregnancy, it is likely that many of these pregnancies were unintended, since fertility for these contraceptive users rose in the places impacted by the exclusion and fell in the rest of the state.
The reduced provision of LARC methods in the counties with Planned Parenthood at the time of the exclusion represents a divergence from the trend toward increased LARC delivery in Planned Parenthood counties in the years preceding the ban, a trend that has been also been observed nationally.9,10 The stability in provision of short-acting hormonal methods at the time of the exclusion suggests increased reliance on these methods as access to LARC and injectable contraceptives declined. This change is concerning as increasing access to LARC is a priority for the American College of Obstetricians and Gynecologists, and one study has indicated substantial unmet demand for LARC in Texas.11,12 In sum, introducing additional barriers to LARC access by excluding skilled, specialized family planning providers was associated with a shift toward methods with lower efficacy and continuation rates,13 and, in the case of women who used injectables in the fourth quarter of 2012, an increase in Medicaid-paid births.
Our data are observational and cannot prove causality. However, our analyses suggest that the exclusion of Planned Parenthood from the Texas Women’s Health Program had an adverse impact on low-income women in Texas by reducing the provision of highly effective methods of contraception, interrupting contraceptive continuation, and increasing Medicaid-paid deliveries. While our data do not capture specific barriers that Planned Parenthood clients encountered after the ban, another study based on interviews with Planned Parenthood injectable contraceptive users in Houston, TX and Midland, TX, found that Women’s Health Program clients who returned to Planned Parenthood after the ban were required to pay a fee of $60 or more for a contraceptive injection.14 Some who sought a new provider were required to undergo exams, needed multiple visits, or were charged a copayment before getting their injection.
A limitation of our analysis is that the impact we observe is restricted to the two years immediately following the implementation of the ban. The local regression lines we fit to provision after the exclusion suggest an attenuation of changes over time, as has been observed in other studies of effects of reproductive health policy changes.15 Additionally, our models do not adjust for any changes in county-level characteristics that may have taken place during the period of observation.
Another limitation is that we have no information on contraceptive services that women paid for out-of-pocket or received through other subsidized programs. However, given that the fee-for-service family planning program was the payer of first resort and the severely limited funding for subsidized family planning in Texas during the period under study,5 it is unlikely that women were pulled away from the Texas Women’s Health Program to be served through other programs. Also, our analysis only includes Medicaid deliveries in Texas, and women who gave birth out of state, or with private insurance are not captured.
Before the Planned Parenthood exclusion, cuts in grant funding and the reduced priority given to specialized clinics had already reduced substantially the amount of funding available to Planned Parenthood affiliates and reduced access to LARC, especially among women who did not qualify for the Medicaid waiver family planning program on account of their residency status.5 Thus, the changes we observed in the fee-for-service family planning program following the Planned Parenthood exclusion likely represent only part of the total reduction in service availability associated with the multiple efforts to defund these providers. Moreover, because the Texas family planning safety net includes a diverse mix of Planned Parenthood affiliates, private dedicated family planning providers and public entities,4,5 the estimates here may be conservative if applied to states in which Planned Parenthood affiliates are a more dominant source of family planning care.
Implementation of the 2013 exclusion of Planned Parenthood from a Medicaid waiver program in Texas was associated with adverse changes in contraceptive provision, continuation, and Medicaid-paid deliveries. The implications of these findings should be considered when evaluating the merit of proposals to exclude Planned Parenthood from public funding in other states or at the national level.
Acknowledgments
This study was supported by a grant from the Susan T. Buffett Foundation for the Texas Policy Evaluation Project, as well as a grant from the Eunice Kennedy Shriver National Institute of Child Health and Human Development (R24 042849) to the Population Research Center, University of Texas at Austin. The views expressed in this article are those of the authors and do not necessarily represent the views or policies of the Texas Health and Human Services Commission.
We thank Daniel Grossman, MD and Daniel Powers, PhD for helpful comments on earlier drafts.
References
- 1.Medicaid Family Planning Eligibility Expansion: Guttmacher Institute. 2015 Apr [Google Scholar]
- 2.Aday L, Andersen R. A framework for the study of access to medical care. Health Services Res. 1974;9:208–20. [PMC free article] [PubMed] [Google Scholar]
- 3.Texas Department of State Health Services v Balquinta. 2014 429 S.W.3d 726, 730–735 (Tex. App.—Austin 2014, pet. ____) [Google Scholar]
- 4.White K, Grossman D, Hopkins K, Potter JE. Cutting Family Planning in Texas. New England Journal of Medicine. 2012;367:1179–81. doi: 10.1056/NEJMp1207920. [DOI] [PMC free article] [PubMed] [Google Scholar]
- 5.White K, Hopkins K, Aiken AR, et al. The impact of reproductive health legislation on family planning clinic services in Texas. Am J Public Health. 2015;105:851–8. doi: 10.2105/AJPH.2014.302515. [DOI] [PMC free article] [PubMed] [Google Scholar]
- 6.Estimates ACS-Y, editor. Bureau USC. American Community Survey. U. S. Census Bureau; 2015. generated by Amanda Jean Stevenson; using ACS 5-year API; < http://www.census.gov/data/developers/data-sets/acs-survey-5-year-data.html%3E; (5 November 2015) [Google Scholar]
- 7.Dimick JB, Ryan AM. Methods for evaluating changes in health care policy: The difference-in-differences approach. JAMA. 2014;312:2401–2. doi: 10.1001/jama.2014.16153. [DOI] [PubMed] [Google Scholar]
- 8.Imbens GW, Lemieux T. Regression discontinuity designs: A guide to practice. J Econometrics. 2008;142:615–35. [Google Scholar]
- 9.Finer LB, Jerman J, Kavanaugh ML. Changes in use of long-acting contraceptive methods in the United States, 2007–2009. Fertility and sterility. 2012;98:893–7. doi: 10.1016/j.fertnstert.2012.06.027. [DOI] [PMC free article] [PubMed] [Google Scholar]
- 10.Kavanaugh ML, Jerman J, Finer LB. Changes in Use of Long-Acting Reversible Contraceptive Methods Among U.S. Women, 2009–2012. Obstet Gynecol. 2015;126:917–27. doi: 10.1097/AOG.0000000000001094. [DOI] [PMC free article] [PubMed] [Google Scholar]
- 11.Group L-ARCW. ACOG Committee Opinion no. 450: Increasing use of contraceptive implants and intrauterine devices to reduce unintended pregnancy. Obstet Gynecol. 2009;114:1434–8. doi: 10.1097/AOG.0b013e3181c6f965. [DOI] [PubMed] [Google Scholar]
- 12.Potter JE, Hopkins K, Aiken AR, et al. Unmet demand for highly effective postpartum contraception in Texas. Contraception. 2014;90:488–95. doi: 10.1016/j.contraception.2014.06.039. [DOI] [PMC free article] [PubMed] [Google Scholar]
- 13.Trussell J, Guthrie K. Choosing a contraceptive: Saftey, efficacy and personal considerations. In: Hatcher RA, Trussell J, Nelson AL, Cates W, Kowal D, editors. Contraceptive Technology. 12th. New York: Ardent Media; 2011. pp. 45–74. [Google Scholar]
- 14.Woo CJ, Alamgir AH, Potter JE. Removing Planned Parenthood from a family planning program in Texas: Effects on injectable contraceptive users. Contraception forthcoming. doi: 10.1016/j.contraception.2015.12.004. [DOI] [PMC free article] [PubMed] [Google Scholar]
- 15.Colman S, Joyce T. Regulating abortion: impact on patients and providers in Texas. Journal of Policy Analysis and Management. 2011;30:775–97. [Google Scholar]