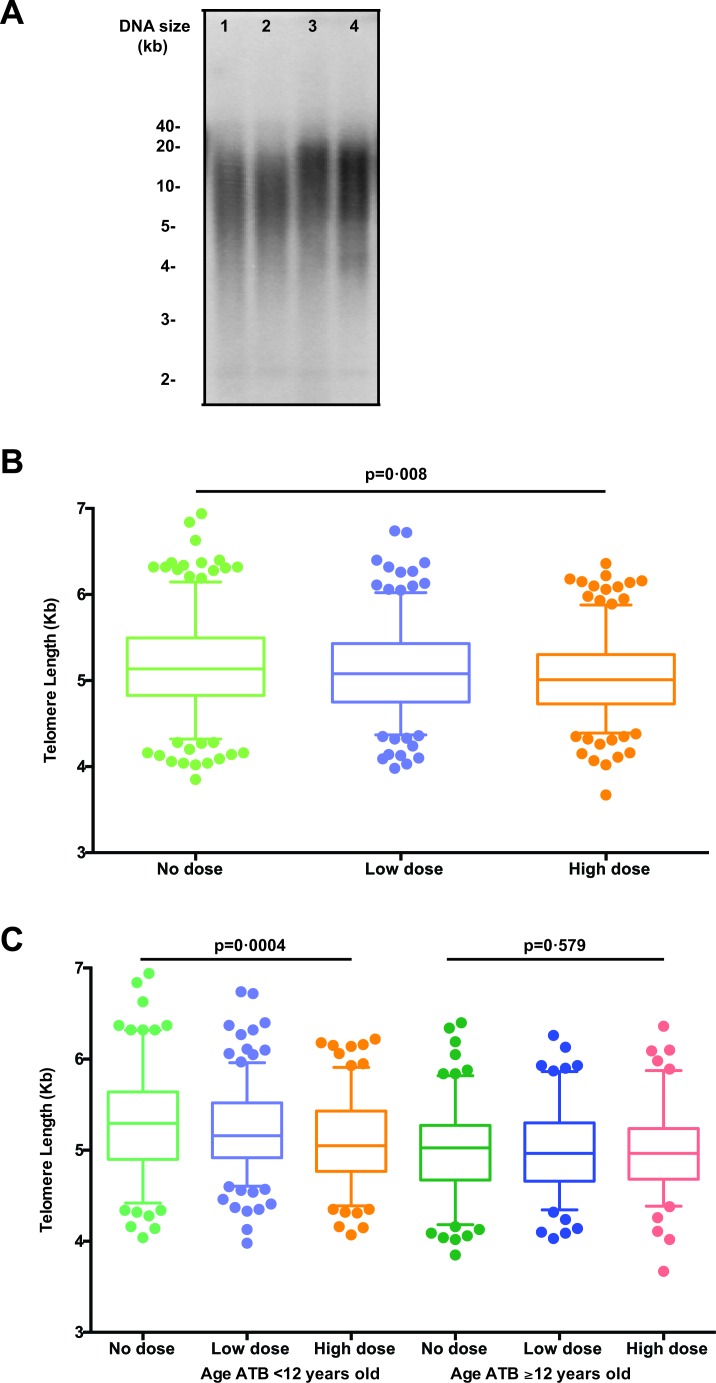
Figure 1. Telomere length for all subjects by dose groups.
A. Representative telomere measurement data by Southern blot. Lanes 1 and 2 are the first and second time points, respectively, from a subject who was aged 16 ATB, and similarly lanes 3 and 4 are from a subject who was aged 2 ATB. B. Boxplots of telomere length (averaged across both samples) for all subjects (healthy plus ill) by dose groups. The middle line reflects the median, the box length reflects the interquartile range (Interquartile range, IQR = 75th percentile − 25th percentile), and the whiskers reflect the 5th and 95th percentiles. Points represent specific values in the quantiles beyond the whiskers. Here, telomere lengths appear significantly shorter in those with increased dose groups (p for trend = 0.008). C. Boxplots of telomere length (averaged across both visits) for all subjects by subject age at the time of the bombing (age ATB < 12 vs. ≥ 12 years old) and by dose groups. An interaction effect is shown, where telomere lengths significantly differ between dose groups in those who were age < 12 vs. ≥ 12 years old ATB (p for trend = 0.0004), but no significant difference was observed across dose groups in those who were ≥ 12 years old ATB (p = 0.58).

