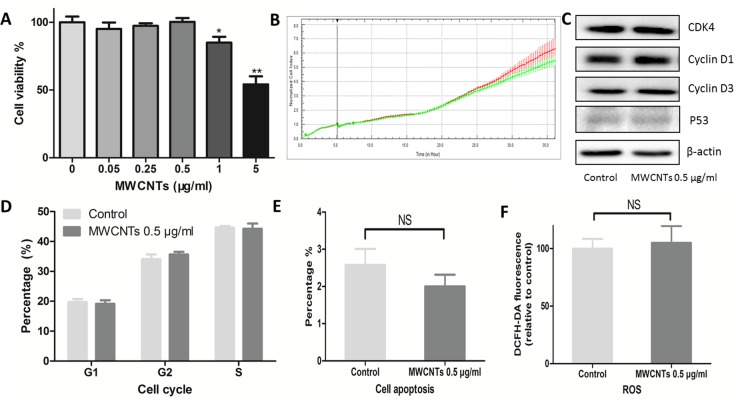
Figure 2. Cytotoxic responses of GC-2spd cells to MWCNTs.
A. Viability of GC-2spd cells treated with different concentrations of MWCNTs for 24 h was measured using alamarBlue method. B. Viability of GC-2spd cells was examined by xCELLigence approach. The red and green line represent viability of control and 0.5 μg/mL MWCNTs treated, respectively. C. GC-2spd cells were incubated with MWCNTs (0.5 μg/mL) for 24 h, the expression levels of CDK4, Cyclin D1, Cyclin D3, and P53 were determined by western blotting. D. Cell cycle profile were determined via PI staining using flow cytometer. E. After incubating with MWCNTs (0.5 μg/mL) for 24 h, GC-2spd cells were were labelled with annexin V-FITC and DAPI using flow cytometer. F. The ROS levels were assessed by flow cytometer after MWCNTs exposure to GC-2spd cells and stained with DCFH-DA. These values were all expressed as means ± S.E. from three separate experiments. * represented as P<0.05, ** represented as P<0.01, NS represents no significance.

