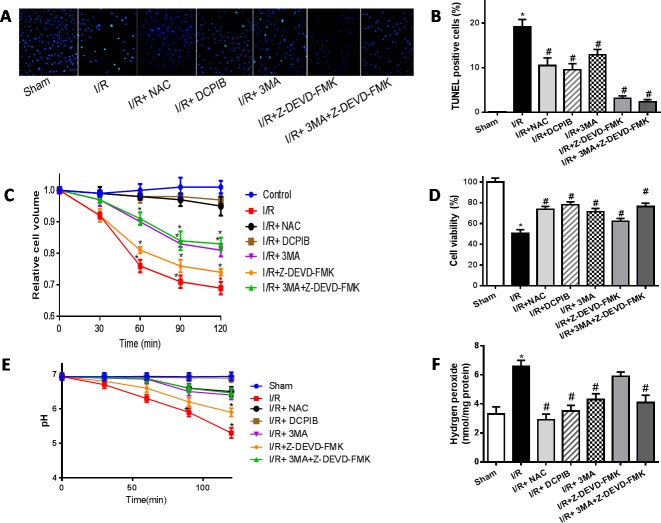
Figure 10. The time courses of changes in the mean cell volume.
A.,B. TUNEL staining images and analysis (×400); C.,D. Cell volume and cardiomyocyte viability analysis; E. intracellular pH analysis; F. intracellular H2O2 analysis. *P < 0.05 compared with sham group; #P < 0.05 compared with I/R group.

