
Figure 2. Levels of TREM-1 on blood monocytes from patients with NSCLC and healthy control.
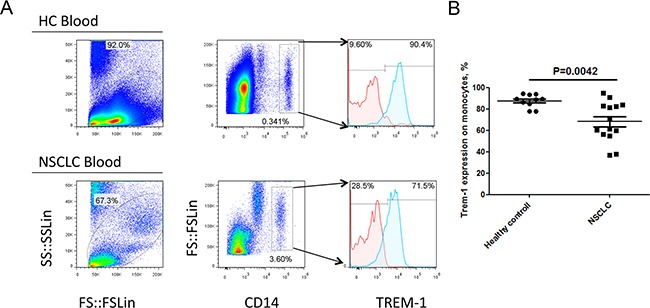
A. Representative dot plots and B. summarized data showed the levels of TREM-1 in blood CD14+ leukocytes from healthy donors (n=10) or NSCLC patients (n=14). Red lines represent IgG control and blue lines represent anti-TREM-1 antibody. Student's t-test (unpaired test) was performed and data are presented as means±SEM.