

Summary
Embryonic gene expression intricately reflects anatomical context, developmental stage, and cell type. To address whether the precise spatial origins of cardiac cells can be deduced solely from their transcriptional profiles, we established a genome-wide expression database from 118, 949, and 1166 single murine heart cells at embryonic days (e)8.5, 9.5, and 10.5, respectively. We segregated these cells by type using unsupervised bioinformatic analysis and identified chamber-specific genes. Using a random forest algorithm, we reconstructed the spatial origin of single e9.5 and e10.5 cardiomyocytes with 92.0+/-3.2% and 91.2+/-2.8% accuracy respectively (99.4+/-1.0% and 99.1+/-1.1% if a +/-1 zone margin is permitted) and predicted the second heart field distribution of Isl1-lineage descendants. When applied to Nkx2-5-/- cardiomyocytes from murine e9.5 hearts, we showed their transcriptional alteration and lack of ventricular phenotype. Our database and zone classification algorithm will enable the discovery of novel mechanisms in early cardiac development and disease.
Keywords: single cell RNA sequencing, cardiac development, cardiomyocyte, Nkx2-5, congenital heart disease
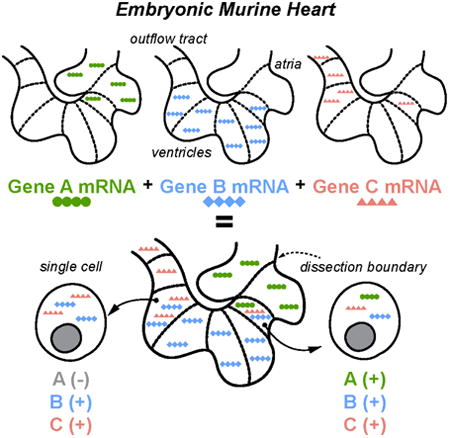
Graphical abstract
Cardiogenesis is orchestrated by cell type- and chamber-specific transcription. Li et al. collected 2233 single-cell RNA-seq samples from embryonic mouse hearts. This data resource uncovers anatomic patterns of gene expression that enable the deduction of a single-cell sample's anatomic origin, providing insight on developmental perturbations in congenital heart defect models.
Introduction
Recent advances in microfluidic technology and high-throughput genome sequencing have led to genome-wide expression annotation of various cell types at the single-cell level. The power of this technology has been used to investigate regulatory transcriptional networks in pre-implantation embryo development (Xue et al., 2013), unique subpopulations and their gene expression patterns in the developing mouse lung (Treutlein et al., 2014), and the expression of embryonic germ layers (Achim et al., 2015; Satija et al., 2015), among others. By applying bioinformatic tools to the complex datasets generated from single-cell genome-wide RNA-sequencing, these studies have demonstrated the power of comprehensive gene expression profiling in single cells by revealing unique insights into differential cell phenotypes and expression signatures.
While these earlier works have largely focused on single-cell transcriptional profiling in model organisms with anatomically simple structures, there has been little to no published work on dissection of a complex anatomical structure comprised of multiple cell types during successive steps of organogenesis. Furthermore, while conventional gene deletion studies have revealed the roles of key developmental regulators, this knowledge has only been established at tissue-level resolution. It remains unclear how gene expression may be regulated in an individual cell at a specific location in the developing organ. Having a reference database for normal single cells in the developing embryonic heart and an algorithm to deduce the anatomical context of a single cell would significantly advance our understanding of congenital heart disease mechanisms, as one would then be able to identify early transcriptional changes and the cells manifesting those changes. To achieve this goal, we hypothesized that single cells from the early embryonic heart harbor unique transcriptional profiles that allow us to reconstruct their anatomical origins. In essence we seek an optimal set of spatially patterned genes that can exquisitely describe the anatomical context of a single cell at distinct stages of early heart development, thereby allowing one to target cells that underlie the earliest onset of congenital heart disease.
To address the challenge of single-cell anatomical mapping in early cardiac development, it is necessary to understand that gene expression during development reflects spatial context, developmental stage, and cell type. Earlier studies in chick, flies, and mice have revealed the coordinated morphologic progression and multi-lineage differentiation of developing cardiac progenitor cells that give rise to the mature four-chamber heart (Bruneau, 2002; Epstein, 2010; Evans et al., 2010; Harvey, 2002; Murry and Keller, 2008; Olson, 2006; Paige et al., 2015). From the initial cardiac crescent structure representing cells from the first and second heart fields (FHF and SHF), cardiac precursors undergo midline fusion to generate a linear heart tube that undergoes looping morphogenesis, which represents the first asymmetric morphologic event during development (Bruneau, 2008; Buckingham et al., 2005). Subsequent ballooning and expansion of chamber-specific cardiomyocytes, followed by delamination and trabeculation, produce clear distinctions between the atria, ventricles, outflow tract (OFT), and atrioventricular canal (AVC). During early cardiac development the precursors for two specialized cell types (cardiomyocytes and endothelial cells) emerge from a population of mesodermal progenitor cells marked by Mesp1 expression (Saga et al., 2000) or Flk1/Pdgfra (Kattman et al., 2011) before committing to become multipotent cardiac progenitor cells (CPCs) marked by Islet 1 (Isl-1), Nkx2-5, or BAF60c expression (Devine et al., 2014; Kattman et al., 2006; Lescroart et al., 2014; Moretti et al., 2006; Wu et al., 2006). These CPCs undergo commitment and differentiation into various subtypes of cardiovascular cells including cardiomyocytes (CMs), smooth muscle cells, and conduction cells (Kattman et al., 2007; Wu et al., 2008). As these CPCs become further specified into each of the cardiovascular cell types, they undergo extensive transcriptional changes associated with their cell type as well as their anatomical position within the developing heart. However, beyond a few well-recognized markers such as Hand1 and Tbx5 for the inflow tract and left ventricle (Barnes et al., 2010; Bruneau et al., 1999); Isl-1 and Sema3c for the outflow tract (Feiner et al., 2001; Sun et al., 2007); Tbx2/3 for the AVC (Christoffels et al., 2004); and Pitx2 for the left atrium (Liu et al., 2002), there are relatively few validated markers that distinguish cells from different regions of the developing heart.
In this study we developed Anatomical Transcription-based Legend from Analysis of Single-cell RNA-Sequencing (ATLAS-seq), an anatomically informed single-cell transcriptomic profiling study on 2233 cardiac cells from embryonic days 8.5 (e8.5), 9.5 (e9.5), and 10.5 (e10.5) of murine development to investigate spatially patterned gene expression signatures in developing cardiomyocytes. We employed unsupervised analysis to identify cell type, and we identify transcriptional markers for the left and right atria (LA and RA) and ventricles, as well as AVC, OFT, and trabecular myocardium with improved accuracy over previously described markers. In addition, we developed a machine learning algorithm that classifies single e9.5 and e10.5 cardiomyocytes by anatomical origin with >91% accuracy by selecting a set of 500 highly informative genes as markers. This algorithm was further validated by reconstructing the anatomical distribution of single Isl-1 lineage-traced cardiomyocytes and demonstrating their localization to SHF-derived zones. In addition, we showed that cardiomyocytes from Nkx2-5-/- e9.5 murine hearts exhibit globally altered transcription and lack ventricular identity. Altogether, our study demonstrates the first comprehensive assessment of transcriptional profiles from deep sampling of single cardiac cells in the embryonic mouse heart. The marker genes that we have identified and the anatomical classification algorithm that we have created will facilitate future efforts to identify transcriptional perturbations that indicate the onset of congenital heart disease.
Results
Isolation and Expression Profiling of Single Cells from Early Mouse Embryos
To obtain the transcriptional profiles of single embryonic mouse heart cells at e8.5, e9.5, and e10.5, we designed a workflow comprising of single-cell capture on a Fluidigm C1 workstation, automated reverse transcription, barcoding, and library generation, followed by high-throughput sequencing and bioinformatic analysis (Fig 1A). We dissected e8.5, 9.5, and 10.5 mouse hearts into two, seven, and nine zones respectively (Fig 1B) in order to retain anatomic information for cells obtained from each heart region. After confirming expression of previously established chamber/zone-specific genes such as Nr2f2, Bmp2, Myl2, Isl-1, Irx1, and Pitx2 (Christoffels et al., 2000a; Christoffels et al., 2000b; Danesh et al., 2009; Liu et al., 2002; Pereira et al., 1999; Sun et al., 2007) on similarly dissected e10.5 specimens via bulk qPCR (Fig 1C; Table S1), we performed single-cell mRNA sequencing on cells captured from each zone. We obtained high-quality samples from 118 e8.5 cells, 949 e9.5 cells, and 1166 e10.5 cells. These were selected from among 143, 999, and 1274 total cells captured at each stage, respectively (Fig S1A) (Trapnell et al., 2014). Importantly, between batches of dissected heart zones collected several months apart, sample quality was highly similar (Fig S1A, B). Interestingly, unsupervised dimensionality reduction of the single-cell RNA sequencing (scRNA-seq) data by t-SNE (Maaten van der and Hinton, 2008) revealed clusters of single cells whose segregation pattern is only partially determined by their anatomical zone of origin. This suggests that another characteristic, likely cell lineage, predominantly drives transcriptional variation among the single cells (Fig 1D).
Figure 1.
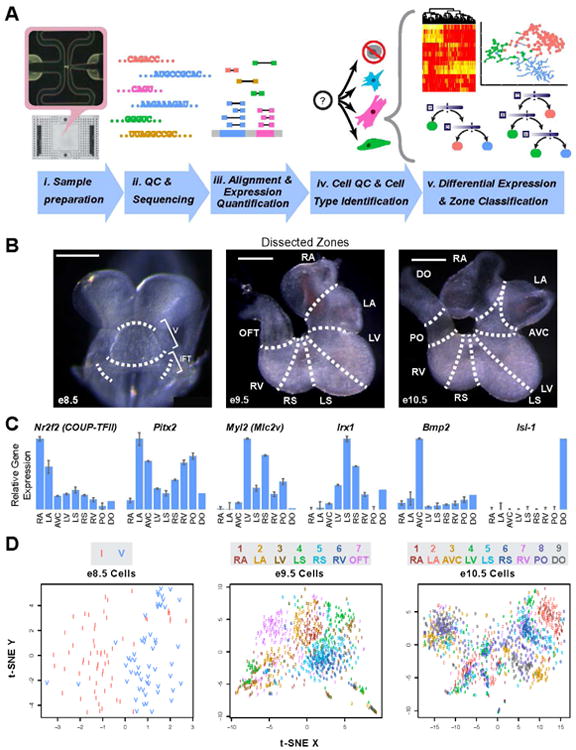
- Workflow for generation and analysis of scRNA-seq data
- Whole-mount microscopy of murine e8.5, 9.5, and 10.5 heart showing dissection zone boundaries. IFT - inflow tract, A – atrium, V – ventricle, RA – right atrium, LA – left atrium, AVC – atrioventricular canal, RV – right ventricle, RS – right ventricular septum, LS – left ventricular septum, LV – left ventricle, OFT – outflow tract, PO – proximal outflow tract, DO – distal outflow tract. Scale bars = 500 μm.
- Validation of previously reported chamber-specific genes in dissected e10.5 heart zones by bulk-tissue qPCR.
-
t-SNE plots showing major clusters among all scRNA-seq samples at each stage of development. Color and number labeling indicate zone of origin for each cell. Due to the different number of zones and cells present at each stage, t-SNE plots of different stages should not be directly compared. I – inflow tract.(See also Figure S1)
Identification of Cell Lineages from scRNA-seq Data
Since t-SNE clusters of the single cells only partially correlate with the zones of origin, we postulated that transcriptional variation among the cells is dominated by cell type-specific genes, rather than by zone-specific genes. Using unsupervised weighted gene co-expression network analysis (WGCNA) (Langfelder and Horvath, 2008), which determines sets (called modules) of co-expressed genes across a population of samples, we identified numerous modules at each stage. Since several modules included genes previously reported to have cell type-specific expression in the embryonic heart (Garside et al., 2015; Li et al., 2015; Masters and Riley, 2014; Tsuda et al., 2001), we selected representative genes from these modules as cell type markers (Fig 2A-B, Table S3). We then performed unsupervised hierarchical clustering of cell type marker expression levels to form branches of cells corresponding to cardiomyocytes (CM), endothelial cells (ED), epicardial cells (EP), and mesenchymal cells (MC) (Fig 2C, S2A). The assigned cell types are distributed across the zones as expected; for example, mesenchymal cells are abundant in the AVC and OFT, where mesenchymal cushions form cardiac valve precursors (Fig 2D, S2B, Table S2A-C) (Lin et al., 2012). A t-SNE plot relabeled by cell type demonstrates clear concordance between clustering and assigned cell types (Fig 2E). In addition, the proportions of captured mesenchymal and epicardial cells also increase from e8.5 to e10.5, in accordance with proliferation of the cushions and the epicardium during these stages (Fig 2F) (Lin et al., 2012). While most of the single cells could be unambiguously assigned to one of the four main developmental cardiac cell types, some samples significantly expressed markers for two cell types and most likely represent two-cell capture events, a finding that was recently reported by a Fluidigm white paper (see http://info.fluidigm.com/FY16Q2-C1WhitePaperUpdate_LP.html) and is supported by the slightly higher total cDNA content in the multi-type samples compared to single-type samples (Fig S3). Additional studies beyond the scope of this paper are needed to determine whether any of these multi-type samples carry biological significance. For the remainder of our study, we focus on single-type samples only.
Figure 2.

- WGCNA gene module construction.
- Correlation of e10.5 cells to eigengenes of selected modules, and selected gene ontology terms associated with modules.
- Hierarchical clustering of cell type marker expression in e10.5 cells. Cell type markers from each module were selected based on strong association with the module and high coefficient of variation of gene expression among e10.5 cells.
- Distribution of major cell types across nine e10.5 zones. CM – cardiomyocyte, ED – endothelial cell, EP – epicardial cell, MC – mesenchymal cell. Two-type cells are not shown.
- t-SNE plots of all cells at each stage. Color and number labeling indicate assigned cell type for each single cell. ‘Doublet’ indicates cell that expressed markers for multiple cell types. ‘Other’ indicates cell that did not significantly express markers for any cell type. Due to the different number of cell types and cell numbers present at each stage, t-SNE plots of cells at different stages should not be directly compared.
-
Cell type distribution across developmental stages.(See also Figure S2, S3)
Identification of Zone-specific Genes in CMs from scRNA-seq Data
As the goal of this study is to reveal the anatomical locations of single cells, distinguishing cell types allowed us to subsequently focus on zone-specific differences in gene expression within each cell type. We detected differential expression of several genes between atrial and ventricular EDs and between AVC and OFT MCs (Fig S2C-D, Table S4A-B). These genes allow one to determine whether an ED originates from the atria or ventricles and whether an MC originates from the OFT or AVC. However, the limited number of captured EDs and MCs preclude further analysis of their specific zone of origin. Hence, we focused on CMs (Fig 3), the most abundant cell type captured. We found several hundred CM genes that were differentially expressed between zones (Table S4C-D), including some that have been reported in the literature (e.g. Shox2, Pitx2, Myl2, Isl1, Nppa, Rspo3, and Hand1) but also many that were previously unrecognized as chamber-specific (e.g. Cav1, Nr2f1, Tigd2, Adm, Mpped2, Pcsk6, Inafm2, Hs6st2, and Tnc) (Fig 3B-D). We further confirmed the expression of several of these genes by whole-mount or section in situ hybridization (Fig 3E).
Figure 3.
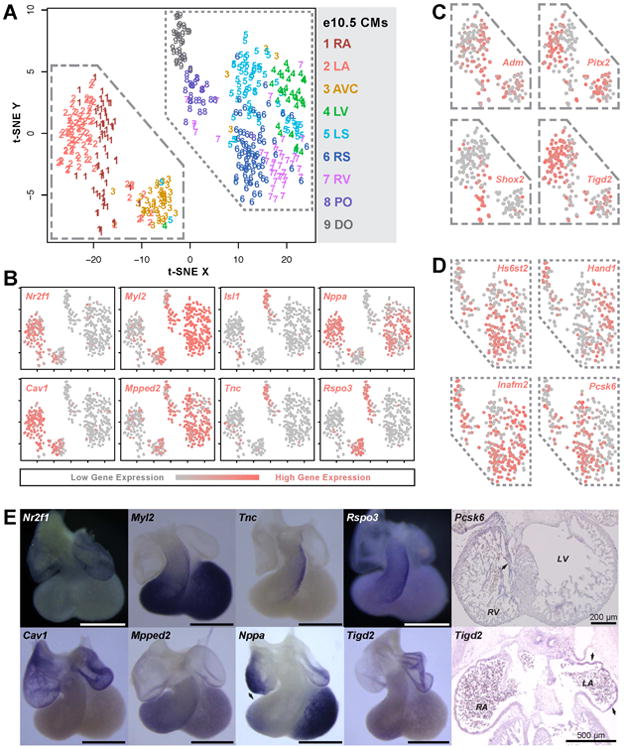
- t-SNE plot of e10.5 CMs using genes differentially expressed between zones (Table S4C-D). Color and number labeling indicate zone of origin for each cell.
- Plot (A) recolored to indicate expression levels of atria-, ventricle-, AVC-, and OFT-specific genes.
- Magnified portion of plot (A) recolored to indicate expression levels of LA- or RA-specific genes.
- Magnified portion of plot (A) recolored to indicate expression levels of LV-, LS-, RS-, and RV-specific genes.
- In situ hybridization of e10.5 whole-mount hearts and e12.5 sections to confirm anatomically patterned expression of known and new marker genes identified from scRNA-seq data. Scale bar = 1 mm unless otherwise noted.
Establishment of Zone Classification Algorithm for scRNA-seq and sc-qPCR Data
Taking advantage of the many zone-specific markers identified above, we performed supervised machine learning using a random forest algorithm (Breiman, 2001), which was selected based on its capacity for high-dimensional data and ability to select the most informative genes for classification. The algorithm takes in a training dataset of scRNA-seq samples for which the zones of origin are known, based on dissection. During training, the algorithm uses this dataset to determine the optimal gene expression criteria for distinguishing CMs from different zones (details in Fig S4A). This collection of criteria, known as the random forest, can then predict the zone of origin for other scRNA-seq samples, for which the zone may not be known a priori. Prediction accuracy can either be estimated by the algorithm itself during training (out-of-bag accuracy), or determined by applying the random forest to other samples with known zones of origin, and comparing the predicted zone to the actual (cross-validation accuracy). Using an initial random forest trained on all e10.5 CMs, we determined that for a 5,000-tree random forest, an initial feature selection step to identify the top 500 most informative genes yielded the most accurate zone classification (Fig S4B). For ten-fold cross-validation of the random forest algorithm, we established 10 training sets, each containing a randomly sampled 90% of the 701 e9.5 CMs or 466 e10.5 CMs, to select the top 500 genes and build a random forest using only those genes. Each random forest's accuracy was then determined using a test set containing the remaining 10% of e9.5 or e10.5 CMs (Fig 4B). Across ten iterations, the random forest's internally assessed out-of-bag accuracy on the training set was 92.1+/-0.6% (e9.5) and 91.8+/-0.7% (e10.5) on average (Fig S4C), while the average cross-validation accuracy on the test set was 92.0+/-3.2% (e9.5) (Fig 4B-i) and 91.2+/-2.8% (e10.5) (Fig 4B-ii).
Figure 4.

- Training a wild-type (WT) random forest using CMs from e9.5 or e10.5 WT hearts. A portion of the WT CMs (test set) is withheld from the training set and is instead used to determine the cross-validation accuracy of zone prediction. The random forest algorithm can also internally calculate ‘out-of-bag’ accuracy.
- Cross-validation (CV) accuracy of random forests trained on i) e9.5 or ii) e10.5 scRNA-seq data. Heatmaps indicate vote distribution, which can be interpreted as prediction confidence: rows represent test set CMs, organized by actual zone of origin; columns represent possible predictions. If a cell receives many more votes from the random forest for a particular zone than for other zones, then the zone of origin can be confidently predicted. Displayed heatmaps represent results from one iteration of the ten-fold cross-validation. Average accuracies across all ten iterations are reported.
- Major gene ontology terms for the top 500 most anatomically informative genes as ranked by the random forest.
- Expression heatmap of 65 most anatomically informative genes for e10.5 CM sc-qPCR samples.
-
Vote distribution heatmap for test set cells from one iteration of a ten-fold random forest cross-validation based on sc-qPCR data.(See also Figure S4)
Among the ∼10% of incorrectly classified CMs at each stage of development, most were partially matched to their true zone of origin and slightly more well-matched to an adjacent zone, suggesting that these cells originated from the border between two zones. Accordingly, when a zone adjacent to the true zone of origin was also considered to be an acceptably accurate classification (a one-zone margin), the cross-validation accuracy was 99.4+/-1.0% (e9.5) and 99.1+/-1.1% (e10.5). Finally, to produce a random forest for zone prediction of scRNA-seq samples outside these dissected e9.5 and e10.5 WT samples, all 701 e9.5 CMs or 466 e10.5 CMs were used to select the top 500 genes and build a random forest. The 500 genes chosen for the e10.5 random forest (Table S5A) corroborated known and newly identified differentially expressed genes, and associated strongly with gene ontology terms such as cardiovascular system development, differentiation, and cell communication (Fig 4C). Highlighting this algorithm's ability to determine the anatomical location of single CMs from scRNA-seq data, we named it Anatomical Transcription-based Legend from Analysis of Single-cell RNA-sequencing (ATLAS-seq).
To further validate ATLAS-seq and to provide a concise gene panel for future applications, sc-qPCR was performed on dissected e10.5 heart zones for genes selected from the top 500 identified by the scRNA-seq random forest. Feature selection and cross-validation were performed as described above, yielding an average out-of-bag accuracy of 75.9+/-2.0% and an average cross-validation accuracy of 75.8+/-11.5% (Fig 4E). Again, if a one-zone margin was permitted, the cross-validation accuracy increased to 89.1+/-6.8%. By performing feature selection and building a random forest on all the sc-qPCR samples, a final panel of 65 qPCR (Fig 4D, Table S5D) genes was selected.
ATLAS-seq Validation Using scRNA-seq Data from Cre-based Lineage Tracing
To further validate the ATLAS-seq algorithm for deducing the anatomical context of single CMs, we used Cre-LoxP labeling to determine whether ATLAS-seq zone classifications of Isl-1Cre-labeled or -unlabeled CMs would concur with the previously observed anatomic distribution of Isl-1-expressing cells and their descendants (Yang et al., 2006). We harvested e10.5 hearts from Isl-1Cre/+/ROSA26mTmG/+ mouse embryos, isolated GFP+/tdTomato- Isl-1 lineage cells and GFP-/tdTomato+ non-Isl-1 descendants by fluorescence activated cell sorting (FACS), and performed scRNA-seq (Fig 5A, Table S6A). As expected, whole-mount fluorescence microscopy showed that Isl-1 lineage-labeled cells localized predominantly in the OFT and right ventricle (RV) and sparsely populated the atria and left ventricular septum (LS) (Fig 5B). ATLAS-seq placed GFP+/tdTomato- cells predominantly in the proximal and distal OFT and RV, with a minor fraction in the left ventricle (LV). Consistent with this, GFP-/tdTomato+ CMs were almost entirely classified as originating from FHF-derived zones such as the AVC and LV (Fig 5C). While the number of GFP+ cells classified into the LV might seem more prominent than expected based on the whole mount images of GFP expression (Fig 5B), this is likely due to the presence of GFP+ CMs deep within the inner LV and the enrichment of these GFP+ cells by FACS, especially given that the LV contains more total cells than the distal or proximal OFT.
Figure 5.
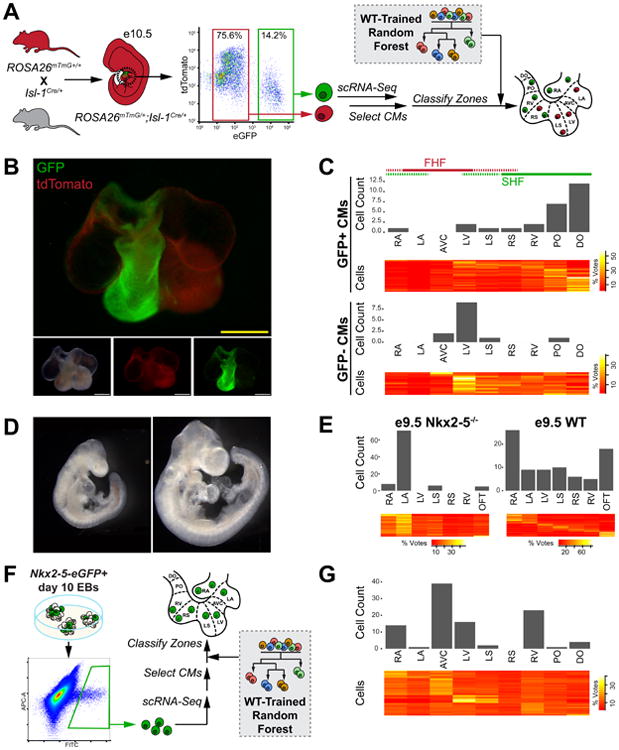
- Schematic for Isl-1 lineage cell isolation by FACS and zone prediction using the previously trained e10.5 WT random forest.
- Whole-mount fluorescence microscopy of Isl-1Cre/+;ROSA26mTmG/+ e10.5 heart.
- Predicted zone and vote distribution heatmap of GFP+ and GFP- CMs from e10.5 Isl-1Cre/+;ROSA26mTmG/+ embryos based on e10.5 WT random forest.
- Whole-mount bright-field microscopy of e9.5 Nkx2-5-/- embryo and WT littermate control.
- Predicted location and vote distribution heatmaps of e9.5 Nkx2-5-/- CMs and WT littermate control CMs based on a previously trained e9.5 WT random forest.
- Schematic for isolation of Nkx2-5-eGFP+ CMs from day 10 embryoid bodies via FACS and zone prediction using the previously trained e10.5 WT random forest.
- Predicted location and vote distribution heatmap of Nkx2-5-eGFP+ CMs based on e10.5 WT random forest.
Application of ATLAS-seq for Analysis of Nkx2-5-/- Embryos and Embryoid Body-derived Cardiac Cells
While ATLAS-seq demonstrated robust accuracy for zone classification of wild-type CMs, it would be advantageous to determine the location of CMs from mutant embryos, as this would enable us to study heart morphogenesis in congenital heart disease models with unprecedented single-cell resolution. To address this, we interbred Nkx2-5Cre/+ (serving as Nkx2-5+/-) mice, collected hearts from e9.5 Nkx2-5-/- embryos (Fig 5D, Table S6B), and performed scRNA-seq analysis on these cells. Loss of Nkx2-5, a critical cardiac transcription factor, has been reported to cause developmental arrest at the linear heart tube stage with a hypomorphic OFT and RV (Lyons et al., 1995; Tanaka et al., 1999). ATLAS-seq classification of these scRNA-seq samples confirmed that very few CMs obtained from the Nkx2-5-/- hearts transcriptionally resemble WT CMs from the RV or OFT. Interestingly, a large majority of the Nkx2-5-/- CMs resemble WT CMs from the LA but not the LV (Fig 5E), suggesting their defective commitment or differentiation into ventricular CMs in the absence of Nkx2-5. Further analysis of scRNA-seq data revealed enhanced expression of several atrial genes and decreased expression of many ventricular genes compared to WT LV CMs, confirming the results of this ATLAS-seq prediction (Table S6C). On the other hand, Nkx2-5+/+ CMs from littermate controls were classified into all zones, indicating that these findings are not due to confounders such as strain differences or parental origin. Use of the top 500 zone-classifying genes in ATLAS-seq therefore demonstrates the consequences of transcriptional changes due to loss of Nkx2-5. This finding supports the use of ATLAS-seq to determine the anatomical origin of CMs in experimental models of congenital heart disease.
To further illustrate the utility of ATLAS-seq for discovery of pathologic mechanisms in cell-based disease models, we applied this approach to CMs derived from in vitro differentiation of pluripotent stem cells using our previously described Nkx2-5-eGFP mouse ES cell line. Embryoid bodies (EBs) at day 10 of differentiation were harvested and single GFP+ cells were collected by FACS for RNA sequencing (Fig 5F). ATLAS-seq assigned these in vitro derived CMs to a variety of anatomical zones (Fig 5G). These results support the capacity of the ATLAS-seq platform to identify CMs representative of a specific cardiac chamber, a finding that may help improve stem cell-based disease modeling and tissue engineering.
Trabecular and Compact Myocardial Expression Gradients in scRNA-seq Data
While our ATLAS-seq anatomical classification algorithm was able to accurately determine the locations of single CMs, additional biological insight may be obtained from determining whether these CMs originated from trabecular or compact myocardium. To identify differentially expressed genes between the trabecular and compact ventricular myocardium, we collected and RNA-sequenced 42 laser-capture microdissection (LCM) samples from e10.5 ventricular heart sections (Fig 6A, S5A). From 23 high quality samples (Fig S5B), we identified genes with the greatest differential expression between trabecular and compact samples (Fig 6B; Table S7). These included several previously described trabecular- or compact-specific genes (e.g. Nppa, Mycn, Itga6) (Luxan et al., 2013; Tarnawski et al., 2015) as well as several new genes (e.g. Sorl1, Slit2, Fstl4) with comparable or greater differential expression compared to the previously described markers. Since our LCM samples most likely contained some RNA from endocardial and epicardial cells, we eliminated genes that were either poorly expressed or very uniformly expressed in e10.5 ventricular CM scRNA-seq samples, since the differential expression of these genes in LCM samples was therefore probably due to variation among non-CMs rather than among CMs. Principal component analysis was used to identify the most discriminating trabecular and compact markers. Visualization of several trabecular and compact genes' expression levels revealed that CMs co-expressing Itga6, Slit2, and Thbs4 segregated clearly from CMs expressing Hey2, Loxl2, and Mycn (Fig 6D). While the in situ hybridization signal of these markers was too faint to detect at e10.5, sections from e12.5 hearts corroborated our computational findings (Fig 6E).
Figure 6.
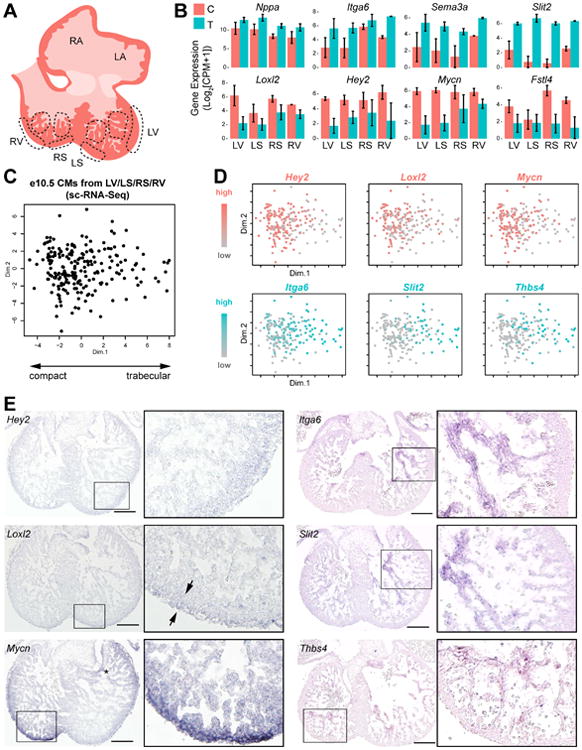
- Illustration of LCM sites in e10.5 heart section to sample trabecular and compact myocardium.
- Differentially expressed genes among trabecular and compact LCM samples from genome-wide RNA-seq analysis. C – compact, T – trabecular.
- PCA of single e10.5 ventricular CMs using 100 most differentially expressed genes among trabecular and compact LCM samples (Table S7).
- PCA plot in (C) recolored to indicate expression level of several trabecular and compact markers.
-
In situ hybridization of e12.5 sections for established and novel trabecular and compact marker genes. Scale bar = 200 μm(See also Figure S5)
Interestingly, each compact or trabecular marker gene is expressed to a different extent among single trabecular or compact CMs: an expression gradient of compact genes (in red) can be observed from left to right on the PCA plot, while the reverse is seen for trabecular genes (in blue) (Fig 6D). For example, Itga6 expression extends across most of principal component 1 (PC1) of the plot, and is only excluded from cells on the far left of the plot where compact genes express most strongly. The differential expression of these compact and trabecular genes is clearly reflected in in situ samples (Fig 6E). These results support the existence of gene expression gradients between trabecular and compact myocardium and demonstrate the utility of scRNA-seq data to anatomically localize developing ventricular CMs along this trabecular-compact axis.
Discussion
In this study we performed deep sampling of murine cardiac cells at e8.5, e9.5, and e10.5 to assess genome-wide temporal and spatial changes in gene expression. We identified new transcripts for various cardiac chambers with exquisite specificity and developed ATLAS-seq, a bioinformatic platform for determining the anatomical origin of single CMs. Our ATLAS-seq algorithm predicted the SHF origin of Isl-1 lineage CMs and demonstrated that Nkx2-5-/- cells exhibit a transcriptional profile most similar to left atrial CMs, suggesting their inability to commit or differentiate into ventricular CMs. Altogether, our study demonstrates the first comprehensive assessment of transcriptional profiles from single cardiac cells during mouse development and provides bioinformatic tools to facilitate future efforts to identify critically altered gene expression during congenital heart disease onset.
We previously performed single-cell quantitative PCR (qPCR) to determine the cell types of cardiovascular lineage descendants in murine hearts and from in vitro-differentiated ESCs (Li et al., 2015). While this earlier study characterized key markers for identifying cell types in the developing heart, it could not address the cells' spatial origins. By identifying zone-specific differentially expressed genes and developing a bioinformatic algorithm to assess the probable origin of each cell, we show, in this study, that our ATLAS-seq methodology is able to deduce with >91% accuracy the anatomic origin of a single CM (Fig 4B). Since single-cell RNA sequencing is experimentally and computationally intensive, we have further validated the ability of a multiplex qPCR-based classification algorithm using only 65 anatomically informative genes to determine the location of a CM (Fig 4D-E). This approach, with a cross-validation accuracy of ∼75%, approximates the prediction accuracy of the scRNA-seq approach yet costs significantly less and allows similar throughput.
Notably, these anatomically informative genes belong to several expected gene ontology categories such as cardiovascular system development, anatomical structure development, cell development, and regulation of developmental processes (Fig 4C). A detailed look at the top genes reveal a concentration of known cardiac developmental regulators (e.g. Hopx, Irx4, Isl1, Id2, Sema3c, Tbx3, and Pitx2), contractile apparatus proteins (e.g. Myl9, Myh6, Myh7, Csrp2, Myl2, and Tnni3), and signaling molecules (e.g. Bmp2, Bmp4, Bmpr1b, Fstl1, Cav1, Nppa, Igfbp5, Lef1, Dkk3, Tgfb2, Cxcl12, and Tgfbr3) (Fig 4D). In addition, we found genes that exhibit zone-specific expression that has not been described previously (e.g. Mpped2, Pcsk6, Tigd2, Prss23, and Stard10). While we believe that exploring these genes' developmental roles will reveal unique biological functions, addressing the detailed mechanistic role of each candidate gene is outside the scope of this study. Nevertheless, it should be mentioned that one ventricular-specific gene discovered here, Mpped2, is a known downstream target of retinoic acid signaling. The possibility exists that induction of the ventricular CM lineage requires transient repression of retinoid acid signaling. Since the intent of this Resource article is to provide a comprehensive database and data mining platform for the research community, we believe our results offer numerous opportunities for hypothesis generation and validation by the cardiovascular development research community.
As a proof-of-concept of the utility of ATLAS-seq in determining the anatomic origin of individual CMs in the developing heart, we applied this method to genome-wide scRNA-seq profiles of single cells descended from the Isl-1 lineage via Cre-LoxP based lineage tracing (Fig 5A). As described extensively in previous studies, Isl-1 is expressed predominantly in cells of the pharyngeal mesoderm and distal OFT of the mid-gestation embryo, prior to their differentiation into CMs, EDs, and smooth muscle cells of the RV, aortic arch, and coronary arteries (Cai et al., 2003; Dodou et al., 2004; Kelly et al., 2001; Moretti et al., 2006; Sun et al., 2007). Our lineage tracing corroborated the previous studies (Fig 5B). When these mid-gestation Isl-1 lineage CMs were analyzed through ATLAS-seq, they were mostly classified into the OFT and RV with only a few cells classified into the LV (Fig 5C). In contrast, non-Isl-1-lineage CMs were classified into the LV and AVC (Fig 5C). It is worth noting that these Isl-1 lineage CMs were isolated from a different genetic strain of mouse (mixed SV129 and CD1) and by a different isolation method (FACS) compared to the cells used to train the ATLAS-seq algorithm. This suggests that ATLAS-seq is generalizable to scRNA-seq data generated using various isolation methods and from mice of different backgrounds.
To assess whether the ATLAS-seq algorithm can robustly determine the anatomical location of single CMs despite transcriptional perturbation due to experimentally-induced mutation, we used ATLAS-seq to analyze the transcriptional profiles of single CMs from e9.5 Nkx2-5-/- embryos (Fig 5D-E). Previous studies have shown that the absence of Nkx2-5 expression results in loss of OFT cell proliferation, producing a shortened heart tube (Prall et al., 2007). This implies that the visible cardiac structure should be composed largely of left ventricular and atrial cells. Surprisingly, ATLAS-seq predicted most of the CMs to originate from the LA with almost no cells predicted to originate from the ventricles. This result is quite unexpected given the previous assumption that loss of Nkx2-5 should primarily affect the development of CMs in the OFT and RV. Our data suggests that Nkx2-5 is required for induction of ventricular identity and that loss of Nkx2-5 expression results in failed ventricular commitment or differentiation during early development. Our data also demonstrate the algorithm's capacity to robustly handle CMs with transcriptional changes that may underlie the onset of congenital heart disease. By comparing the transcriptional profiles of single CMs from WT and mutant embryos (Table S6C), one may reveal transcriptional perturbations to be targeted by future therapy.
One important goal of this study was to uncover new genes that may reveal biologically significant cardiac cell subpopulations during development. An example is the trabecular and compact phenotypes of embryonic CMs. While prior studies have reported the preferential expression of Nppa, Cited1, Bmp10, and Itga6 in trabeculae and Mycn, Hey2, and Irx4 in compact myocardium (Christoffels et al., 2000b; Luxan et al., 2013; Tarnawski et al., 2015), it remains unclear how specific these genes are for uniquely identifying trabecular CMs. To obtain a reference gene panel for CMs in the compact and trabecular myocardium, we performed LCM to profile gene expression in trabecular and compact myocardium (Fig 6A). When genes expressed in trabecular LCM sections were compared directly with genes expressed in compact sections, we uncover a number of markers that show comparable or greater differential expression compared to those previously described (Fig 6B). Interestingly, these markers displayed trabecular-compact gene expression gradients when displayed on a PCA plot of e10.5 CMs (Fig 6C-D). This data is supported by in situ hybridization of histological sections (Fig 6E). We believe the identification of trabecular or compact CMs can now be determined, for the first time, by analysis of their gene expression profiles and may approximate visual confirmation in a histological section.
In summary, we have generated a comprehensive transcriptomic database from 2233 single cells in the embryonic heart. Using ATLAS-seq, a tool for determining the spatial origin of single cardiac cells, we can now partition an embryonic heart into 17 distinct subpopulations based on cell type and anatomical location (Fig 7). We believe this database and analysis platform can be used to identify the earliest molecular defects during the onset of congenital heart disease, when a morphological defect is not yet apparent. We believe that the ATLAS-seq algorithm can also be used to determine the anatomic equivalent of CMs derived from in vitro differentiation of mouse and, in the future, human ES and iPS cells. The ability to determine specific subtypes of cardiac cells from ES and iPS cells will help optimize iPS cell differentiation protocols and to generate specific subtypes of CMs (e.g. RA versus LA; compact versus trabecular, etc.) for drug screening and cellular therapy applications. Ultimately, the goal of this database and bioinformatic algorithm is to significantly advance our understanding of the key transcriptional mechanisms in heart development and their contribution to the onset of congenital heart disease.
Figure 7.

Summary of subpopulations identified among single cells in the e10.5 murine heart. A typical transcriptional signature is indicated for each subpopulation. For cell types, these genes were determined via WGCNA. For zones, these genes were either identified through differential expression analysis or selected by the random forest as major contributors to prediction accuracy. Classification steps based on supervised or unsupervised methods are denoted.
Experimental Procedures
All animal experiments described have been approved by the Administrative Panel on Laboratory Animal Care (APLAC) at Stanford University.
Mouse embryonic heart dissection and mouse ES cell in vitro differentiation
To prepare single cells for RNA-seq or qPCR, CD1 mouse embryonic hearts at e8.5 (10-12 somite pairs), e9.5 (26-29 somite pairs), or e10.5 (35-40 somite pairs) were isolated and dissected into 2, 7, or 9 zones respectively under a dissection microscope. The dissection planes for e9.5 and 10.5 hearts were chosen based on anatomic landmarks such as the septal groove between the LV and RV and between the LA and RA, given that the septum proper is not fully developed at these stages. From each litter, samples from a given cardiac zone were collected and digested into single cells with 0.25% Trypsin-EDTA after one PBS wash. For Isl-1 lineage tracing, Isl-1Cre/+ male mice (Jackson Laboratory, Bar Harbor, ME) were bred with ROSA26mTmG/+ female mice to generate Isl-1Cre/+ / ROSA26m TmG/+ embryos. The embryos were harvested at e10.5 (35-38 somite pairs). Hearts were isolated from mice carrying both tdTomato and GFP fluorescence signals. Isolated hearts were digested with 0.25% Trypsin-EDTA into single cells, and GFP+ and GFP- cells were isolated using FACS (FACSAria, Becton Dickinson, East Rutherford, NJ). Nkx2-5-/- embryos were generated by crossing Nkx2-5Cre/+ mice. The mutant embryonic hearts were harvested at e9.5 and digested into single cells with 0.25% Trypsin-EDTA after one PBS wash.
Mouse ES cells carrying the Nkx2.5-eGFP transgene were differentiated following an embryoid body-based (EB) differentiation protocol (Huang et al, 2010). After 10 days of in vitro differentiation, the eGFP+ single cells were isolated by FACS and used for the following scRNA-seq workflow.
Workflow of single cell RNA sequencing
Single-cell capture, lysis, reverse transcription, and pre-amplification were processed with C1 chips (#100-5760) in the C1 single-cell Auto Prep System (100-6201, Fluidigm Corporation, South San Francisco, CA) following the manufacturer's suggested protocol (Wu et al., 2014). Briefly, the process consists of four steps. 1) chips were primed in the Auto Prep System; 2) single cells in suspension buffer were loaded into chips, and the loaded chips were placed in the Auto Prep System for cell capture; 3) chips were imaged via a built-in microscope to visualize the captured cell in each microfluidic chamber; 4) cell lysis, reverse transcription, and pre-amplification were performed in the Auto Prep System with the SMARTer® Ultra™ Low RNA Kit (634832, Clontech Laboratories, Mountain View, CA). We ran two chips for each e9.5 and e10.5 cardiac zone, one chip for each e8.5 cardiac zone, and one chip for GFP+ or GFP- cells derived from Isl-1Cre/+;ROSA26mTmG/+ hearts.
After pre-amplification, the DNA products from the single cells were transferred from the C1 chips to 96-well PCR plates preloaded with 10 ul of dilution buffer (C1 Single-Cell Auto Prep Reagent Kit, Fluidigm), and analyzed and quantified by Fragment Analyzer (Advanced Analytical technologies, Inc. Ankeny, IA). Only specimens appearing to be single cells by imaging and with DNA concentrations higher than 0.1ng/ul were kept for library preparation. The cDNA products from Nkx2-5-/- embryo-derived cells were prepared with the Smart-seq2 protocol (Picelli et al., 2013). After adjusting all samples to similar concentrations, each single cell derived cDNA sample was used for library preparation with the Nextera XT DNA Sample Preparation Kit (FC-131-1096, Illumina, San Diego, CA) following the manufacturer's suggested protocol. The single cell libraries from each C1 plate (60-85 libraries) were pooled for cleaning, and the cleaned DNA libraries were sequenced on the Illumina HiSeq2000 platform with 2×100bp read length to a depth of (1-8) × 106 reads per cell.
RNA in situ hybridization
Whole-mount RNA in situ hybridization experiments were carried out as previously described (Cai et al., 2003). Briefly, e10.5 (35-40 somite pairs) CD1 embryos were isolated freshly, fixed, and permeabilized. Embryos were hybridized with RNA probes overnight, and were washed multiple times to eliminate non-specific hybridization. The hybridization signal was detected by anti-digoxigenin-AP (Roche) and developed by BCIP/NBT substrate (Promega).
In situ hybridization and staining of histological sections was performed as previously described (Zhang et al., 2016). Briefly, paraformaldehyde-fixed e12.5 mouse embryos were embedded in optimal cutting temperature medium (OCT, Sakura) and sectioned at 10 μm thickness at 4 °C. Tissue sections were hybridized with RNA probes overnight and washed with salt sodium citrate (SSC) buffer and treated with RNase. The hybridization signals were then developed as described above.
To synthesize RNA probes, cDNA fragments (400bp-600bp) of candidate genes were cloned into pBluescript-SK vector (Agilent Technologies) or pGEM-Teasy vector (Promega). RNA probes were labeled by digoxigenin using DIG RNA labeling mix (Sigma).
Laser capture microdissection and RNA sequencing
e10.5 mouse embryos were isolated, embedded in OCT medium, and frozen in isopentane and liquid nitrogen. The frozen blocks were transversely sectioned, and cardiac sections were transferred to steel frame slides (Leica Microsystems, Inc.). The cardiac sections were microdissected using the Leica LMD6500 laser microdissection system. Before dissection, the sections were washed in cold 70% ethanol three times to remove OCT and then dried at room temperature. Compact myocardium and trabecular myocardium from LV and RV sections were dissected (Fig S5A), and myocardial tissue from the same position in 2-4 sections were collected together. RNA was extracted from the dissected tissue with RNeasy Micro Kit (#74004, Qiagen) and eluted in 14 uL of RNase-free water. Two uL of RNA for each sample were reverse transcribed and pre-amplified following the protocol described previously (Picelli et al., 2013). After pre-amplification, all samples were fragment analyzed. Libraries were constructed and pooled as described for single cells. The pooled libraries were sequenced with Illumina HiSeq2000 at 2×100 bp read length.
Multiplexed single-cell qPCR
Multiplexed single-cell qPCR experiments were carried out as described previously (Li et al., 2015). Four 96×96 Fluidigm dynamic arrays (#BMKM-96.96) were used to profile expression of 80 genes in 380 single GFP+ cells isolated from each of the 9 cardiac zones in e10.5 Nkx2-5Cre/+;ROSA26mTmG/+ mouse embryos based on GFP expression (Table S5B-C). Only cells with a Ct value < 25 in any two of the three housekeeping genes (GAPDH, Actb, Hprt) were further analyzed (Fig S4C, Table S5C). Based on expression of lineage-specific genes (Table S5C), cell types were determined. Only CMs were further analyzed for anatomical location. Expression level (Log2EX value) was calculated by subtracting the Ct value from the limit of detection (LoD) (previously defined as 35 for the experiments described).
Bioinformatic methods
RNA-sequencing pre-processing
Read alignment to reference genome GRCm38.79 was performed using STAR 2.4 (parameters: –outSAMstrandField intronMotif –outFilterIntronMotifs RemoveNoncanonical) (Darmanis et al., 2015; Dobin et al., 2013). Gene expression was quantified using HTSeq 0.6.1 (parameters: –s no –t exon –i gene_id –m intersection_nonempty)(Anders et al., 2015). Gene expression levels in each cell were divided by the number of total mapped reads in the cell to obtain expression units of counts per million (CPM).
Quality control
For scRNA-seq samples, cells with at least one million total reads, among which at least 80% of counted reads were attributed to protein-coding genes, were retained for analysis (Fig S1A). For LCM RNA-seq, we retained samples containing at least 100,000 reads among which at least 4000 protein-coding, non-mitochondrial genes were detected. (Fig S5B).
Data analysis with t-SNE
For each analysis, the expression values (Log2[CPM+1]) of all expressed genes (or other gene set if noted in Figure Legend) were analyzed with the R package Rtsne using default parameters (Maaten van der and Hinton, 2008).
WGCNA module construction
For e10.5 dissected cardiac cell scRNA-seq data, we performed unsupervised construction of co-expression modules using the WGCNA R package (Langfelder and Horvath, 2008). Briefly, genes with expression in less than 10% of samples were discarded and quantile normalization was performed on the remaining genes. Genes with variance greater than or equal to the median variance were selected for further analysis (n = 5,529 genes). Selecting a soft-thresholding power of 2 using an unsigned topological overlap matrix yielded 16 co-expression modules containing 35 to 2398 genes. Each module's contents were analyzed with the Panther tool against the entire mouse transcriptome using Bonferroni correction for multiple hypothesis testing (Mi et al., 2013), and was pruned to visualize the top genes by weighted degree using the Gephi tool (Bastian et al., 2004). WGCNA was similarly performed for e9.5 dissected cardiac cell scRNA-seq data.
Cell type marker selection and assignment
Among the WGCNA modules constructed from scRNA-seq data for each stage, we selected several that contained multiple genes previously reported to demonstrate specific expression in myocardial, endocardial, epicardial, or mesenchymal cells in the embryonic murine heart. From each of these modules, the top 20 genes as ranked by weighted degree were selected. Of these 20 genes from each module, the top 5, as ranked by coefficient of variation of expression level among scRNA-seq samples, were selected as cell type markers.
Hierarchical clustering (complete agglomeration) of cell type marker expression (Log2[CPM+1]) was performed on viable cells from all zones. The major branches were assigned a single (CM, ED, EP, MC) or two-type (CM-ED, CM-EP, CM-MC, ED-EP, or ED-MC) cell type. Cells that did not significantly express any cell type markers were assigned “other”.
Zone-specific differential expression analysis
For each zone included in a comparison, genes expressed in at least 10% of cells from the zone at >0 CPM were considered. Genes with at least a difference of 2 in median Log2(CPM+1) between two compared zones were analyzed for differential expression using the R package Monocle (Trapnell et al., 2014). A Benjamini-Hochberg correction was applied to significance levels using the total number of expressed genes included in the comparison.
Random forest construction and classification
scRNA-seq
The following methods were identically performed on e9.5 and e10.5 WT CM data unless otherwise noted. Additionally, the following parameters were used for all scRNA-seq random forests: analysis was performed in gene expression units of Log2(CPM+1); ‘expressed genes’ refers to genes expressed above 0 CPM in at least 25% of the CMs of at least one zone in the WT CM scRNA-seq data; to reduce bias against zones with small numbers of obtained CMs, random forests were stratified such that an equal number of samples would be bootstrapped from each zone; and the CMs' dissected zone of origin was used as the reference response for training.
For 10-fold cross-validation, the reference set of e9.5 or e10.5 CMs was divided into ten cohorts. For each iteration of the cross-validation, an initial 5000-tree random forest was constructed on nine of the ten cohorts using all expressed genes. This random forest, known as the feature selector, provided a ranking of genes by their contribution to the accuracy of the random forest. A second 5000-tree random forest, known as the predictor, was then constructed on the nine cohorts using expression data for the top 500 genes identified by the feature selector. The cross-validation accuracy of the predictor random forest was calculated by using it to predict the zone of origin for the CMs of the tenth cohort. Out-of-bag accuracy is a metric calculated during random forest training (Breiman, 2001), and is reported for the predictor random forest.
For zone prediction of samples outside the WT CM scRNA-seq datasets, a 5000-tree feature selector random forest was trained on all the e9.5 or e10.5 WT CM scRNA-seq samples using all expressed genes. A 5000-tree predictor random forest was then trained on all the e9.5 or e10.5 WT CM scRNA-seq data using the top 500 genes from the feature selector. The e10.5 predictor was used for zone prediction for CMs from e10.5 Isl-1Cre/+ / ROSA26mTmG/+ embryos and from day 10 Nkx2-5-eGFP embryoid bodies. The e9.5 predictor was used for zone prediction for CMs from e9.5 Nkx2-5-/- embryos.
sc-qPCR samples
Random forest construction and cross-validation for sc-qPCR samples were performed as described above for scRNA-seq, with the following modifications: All random forest analysis was performed in units of Log2(EX); a total of 80 genes were initially included in the sc-qPCR assay; and all feature selector random forests were trained with 50,000 trees to select the top 65 anatomically informative genes from the 80 candidate genes. A final panel of 65 genes was determined using a feature selector random forest trained on all sc-qPCR samples.
Gene ontology analysis
Gene ontology analysis was performed with BiNGO 2.44 using the most recent ontology file and mouse annotation file (submission date 11/19/2015) (Maere et al., 2005).
Trabecular and compact marker selection
Any gene expressed (> 0 CPM) in >25% of laser-capture microdissection (LCM) samples and in 25-95% of e10.5 ventricular CM scRNA-seq samples was included in analysis. These genes were ranked by difference in mean Log2(CPM+1) between trabecular and compact LCM samples. Using the 50 genes with the most positive difference (preferentially expressed in trabecular LCM samples) and 50 genes with the most negative difference (preferentially expressed in compact LCM samples), PCA was performed on e10.5 ventricular CM scRNA-seq samples to identify genes whose expression gradients were most closely associated with the trabecular-compact axis.
All scRNA-seq raw data has been deposited into the NCBI/GEO database under accession number GSE76118.
Supplementary Material
Highlights.
- Single-cell RNA-seq uncover chamber-specific genes in the embryonic mouse heart
- Machine learning can infer anatomical context from single-cell transcriptional data
- Nkx2-5-/- embryonic mouse cardiomyocytes lack a ventricular transcriptional profile
- Embryonic ventricular cardiomyocytes display trabecular-compact expression gradients
Acknowledgments
The authors acknowledge Gary Mantalas, Norma Neff, and Ben Passarelli from the Quake lab for help in Fluidigm C1 operation and single-cell data analysis. We also thank Dr. Chenleng Cai from Mount Sinai Hospital for the in-situ hybridization protocol. We are grateful to Dr. Robert J. Schwartz for the Nkx2-5Cre/+ and to Dr. Ying Liu and the lab of Dr. Mark Krasnow for the ROSA26mTmG/+ mice. We also thank Dr. Krasnow and members of the Krasnow lab for valuable discussions. In addition, we would like to thank Joshua Johnson and Dr. Joy Wu for help in cryosection experiments and members of the Joy Wu lab for manuscript critique. Finally, we thank Dr. Anthony Sturzu and members of the Sean Wu lab for their helpful discussions.
Funding: This work was supported by the NIH Office of Director's Pioneer Award LM012179-01, NIH/NHLBI U01 0099776-07, the American Heart Association Grant-in-Aid, the Stanford Cardiovascular Institute and Stanford Division of Cardiology, Department of Medicine, the Institute for Stem Cell Biology and Regenerative Medicine, and an endowed faculty scholar award from the Stanford Child Health Research Institute/Lucile Packard Foundation for Children (S.M.W). Also from the Child Health Research Institute postdoctoral fellowship (G.L) and the Stanford Medical Scientist Training Program (A.X).
Footnotes
Author Contributions: G.L., A.X., and S.M.W. designed the experiments; G.L., A.X., B.Z., and X.T. performed most of the experiments; G.L., A.X., and S.M.W. performed most of the data analysis; S.S. and S.Q assisted in scRNA-seq experiments and scqPCR experiments; J.P. and T.Q. performed data analysis in WGCNA; T.K. and P.S. provided assistance in LCM experiments; G.L., A.X., and S.M.W prepared the manuscript. (The order of authors does not correlate strictly with contributions).
Conflict of Interest: Stephen Quake is a co-founder of Fluidigm.
Publisher's Disclaimer: This is a PDF file of an unedited manuscript that has been accepted for publication. As a service to our customers we are providing this early version of the manuscript. The manuscript will undergo copyediting, typesetting, and review of the resulting proof before it is published in its final citable form. Please note that during the production process errors may be discovered which could affect the content, and all legal disclaimers that apply to the journal pertain.
References
- Achim K, Pettit JB, Saraiva LR, Gavriouchkina D, Larsson T, Arendt D, Marioni JC. High-throughput spatial mapping of single-cell RNA-seq data to tissue of origin. Nat Biotechnol. 2015;33:503–509. doi: 10.1038/nbt.3209. [DOI] [PubMed] [Google Scholar]
- Anders S, Pyl PT, Huber W. HTSeq--a Python framework to work with high-throughput sequencing data. Bioinformatics. 2015;31:166–169. doi: 10.1093/bioinformatics/btu638. [DOI] [PMC free article] [PubMed] [Google Scholar]
- Barnes RM, Firulli BA, Conway SJ, Vincentz JW, Firulli AB. Analysis of the Hand1 cell lineage reveals novel contributions to cardiovascular, neural crest, extra-embryonic, and lateral mesoderm derivatives. Dev Dyn. 2010;239:3086–3097. doi: 10.1002/dvdy.22428. [DOI] [PMC free article] [PubMed] [Google Scholar]
- Breiman L. Random Forests. Machine Learning. 2001;45:5–32. [Google Scholar]
- Bruneau BG. Transcriptional regulation of vertebrate cardiac morphogenesis. Circ Res. 2002;90:509–519. doi: 10.1161/01.res.0000013072.51957.b7. [DOI] [PubMed] [Google Scholar]
- Bruneau BG. The developmental genetics of congenital heart disease. Nature. 2008;451:943–948. doi: 10.1038/nature06801. [DOI] [PubMed] [Google Scholar]
- Bruneau BG, Logan M, Davis N, Levi T, Tabin CJ, Seidman JG, Seidman CE. Chamber-specific cardiac expression of Tbx5 and heart defects in Holt-Oram syndrome. Dev Biol. 1999;211:100–108. doi: 10.1006/dbio.1999.9298. [DOI] [PubMed] [Google Scholar]
- Buckingham M, Meilhac S, Zaffran S. Building the mammalian heart from two sources of myocardial cells. Nat Rev Genet. 2005;6:826–835. doi: 10.1038/nrg1710. [DOI] [PubMed] [Google Scholar]
- Cai CL, Liang X, Shi Y, Chu PH, Pfaff SL, Chen J, Evans S. Isl1 identifies a cardiac progenitor population that proliferates prior to differentiation and contributes a majority of cells to the heart. Dev Cell. 2003;5:877–889. doi: 10.1016/s1534-5807(03)00363-0. [DOI] [PMC free article] [PubMed] [Google Scholar]
- Christoffels VM, Habets PE, Franco D, Campione M, de Jong F, Lamers WH, Bao ZZ, Palmer S, Biben C, Harvey RP, et al. Chamber formation and morphogenesis in the developing mammalian heart. Dev Biol. 2000a;223:266–278. doi: 10.1006/dbio.2000.9753. [DOI] [PubMed] [Google Scholar]
- Christoffels VM, Hoogaars WM, Tessari A, Clout DE, Moorman AF, Campione M. T-box transcription factor Tbx2 represses differentiation and formation of the cardiac chambers. Dev Dyn. 2004;229:763–770. doi: 10.1002/dvdy.10487. [DOI] [PubMed] [Google Scholar]
- Christoffels VM, Keijser AG, Houweling AC, Clout DE, Moorman AF. Patterning the embryonic heart: identification of five mouse Iroquois homeobox genes in the developing heart. Dev Biol. 2000b;224:263–274. doi: 10.1006/dbio.2000.9801. [DOI] [PubMed] [Google Scholar]
- Danesh SM, Villasenor A, Chong D, Soukup C, Cleaver O. BMP and BMP receptor expression during murine organogenesis. Gene Expr Patterns. 2009;9:255–265. doi: 10.1016/j.gep.2009.04.002. [DOI] [PMC free article] [PubMed] [Google Scholar]
- Darmanis S, Sloan SA, Zhang Y, Enge M, Caneda C, Shuer LM, Hayden Gephart MG, Barres BA, Quake SR. A survey of human brain transcriptome diversity at the single cell level. Proc Natl Acad Sci U S A. 2015;112:7285–7290. doi: 10.1073/pnas.1507125112. [DOI] [PMC free article] [PubMed] [Google Scholar]
- Devine WP, Wythe JD, George M, Koshiba-Takeuchi K, Bruneau BG. Early patterning and specification of cardiac progenitors in gastrulating mesoderm. Elife. 2014;3:e03848. doi: 10.7554/eLife.03848. [DOI] [PMC free article] [PubMed] [Google Scholar]
- Dobin A, Davis CA, Schlesinger F, Drenkow J, Zaleski C, Jha S, Batut P, Chaisson M, Gingeras TR. STAR: ultrafast universal RNA-seq aligner. Bioinformatics. 2013;29:15–21. doi: 10.1093/bioinformatics/bts635. [DOI] [PMC free article] [PubMed] [Google Scholar]
- Dodou E, Verzi MP, Anderson JP, Xu SM, Black BL. Mef2c is a direct transcriptional target of ISL1 and GATA factors in the anterior heart field during mouse embryonic development. Development. 2004;131:3931–3942. doi: 10.1242/dev.01256. [DOI] [PubMed] [Google Scholar]
- Epstein JA. Franklin H. Epstein Lecture. Cardiac development and implications for heart disease. N Engl J Med. 2010;363:1638–1647. doi: 10.1056/NEJMra1003941. [DOI] [PubMed] [Google Scholar]
- Evans SM, Yelon D, Conlon FL, Kirby ML. Myocardial lineage development. Circ Res. 2010;107:1428–1444. doi: 10.1161/CIRCRESAHA.110.227405. [DOI] [PMC free article] [PubMed] [Google Scholar]
- Feiner L, Webber AL, Brown CB, Lu MM, Jia L, Feinstein P, Mombaerts P, Epstein JA, Raper JA. Targeted disruption of semaphorin 3C leads to persistent truncus arteriosus and aortic arch interruption. Development. 2001;128:3061–3070. doi: 10.1242/dev.128.16.3061. [DOI] [PubMed] [Google Scholar]
- Garside VC, Cullum R, Alder O, Lu DY, Vander Werff R, Bilenky M, Zhao Y, Jones SJ, Marra MA, Underhill TM, et al. SOX9 modulates the expression of key transcription factors required for heart valve development. Development. 2015 doi: 10.1242/dev.125252. [DOI] [PubMed] [Google Scholar]
- Harvey RP. Patterning the vertebrate heart. Nat Rev Genet. 2002;3:544–556. doi: 10.1038/nrg843. [DOI] [PubMed] [Google Scholar]
- Kattman SJ, Adler ED, Keller GM. Specification of multipotential cardiovascular progenitor cells during embryonic stem cell differentiation and embryonic development. Trends Cardiovasc Med. 2007;17:240–246. doi: 10.1016/j.tcm.2007.08.004. [DOI] [PubMed] [Google Scholar]
- Kattman SJ, Huber TL, Keller GM. Multipotent flk-1+ cardiovascular progenitor cells give rise to the cardiomyocyte, endothelial, and vascular smooth muscle lineages. Dev Cell. 2006;11:723–732. doi: 10.1016/j.devcel.2006.10.002. [DOI] [PubMed] [Google Scholar]
- Kattman SJ, Witty AD, Gagliardi M, Dubois NC, Niapour M, Hotta A, Ellis J, Keller G. Stage-specific optimization of activin/nodal and BMP signaling promotes cardiac differentiation of mouse and human pluripotent stem cell lines. Cell Stem Cell. 2011;8:228–240. doi: 10.1016/j.stem.2010.12.008. [DOI] [PubMed] [Google Scholar]
- Kelly RG, Brown NA, Buckingham ME. The arterial pole of the mouse heart forms from Fgf10-expressing cells in pharyngeal mesoderm. Dev Cell. 2001;1:435–440. doi: 10.1016/s1534-5807(01)00040-5. [DOI] [PubMed] [Google Scholar]
- Langfelder P, Horvath S. WGCNA: an R package for weighted correlation network analysis. BMC Bioinformatics. 2008;9:559. doi: 10.1186/1471-2105-9-559. [DOI] [PMC free article] [PubMed] [Google Scholar]
- Lescroart F, Chabab S, Lin X, Rulands S, Paulissen C, Rodolosse A, Auer H, Achouri Y, Dubois C, Bondue A, et al. Early lineage restriction in temporally distinct populations of Mesp1 progenitors during mammalian heart development. Nat Cell Biol. 2014;16:829–840. doi: 10.1038/ncb3024. [DOI] [PMC free article] [PubMed] [Google Scholar]
- Li G, Plonowska K, Kuppusamy R, Sturzu A, Wu SM. Identification of cardiovascular lineage descendants at single-cell resolution. Development. 2015;142:846–857. doi: 10.1242/dev.116897. [DOI] [PMC free article] [PubMed] [Google Scholar]
- Lin CJ, Lin CY, Chen CH, Zhou B, Chang CP. Partitioning the heart: mechanisms of cardiac septation and valve development. Development. 2012;139:3277–3299. doi: 10.1242/dev.063495. [DOI] [PMC free article] [PubMed] [Google Scholar]
- Liu C, Liu W, Palie J, Lu MF, Brown NA, Martin JF. Pitx2c patterns anterior myocardium and aortic arch vessels and is required for local cell movement into atrioventricular cushions. Development. 2002;129:5081–5091. doi: 10.1242/dev.129.21.5081. [DOI] [PubMed] [Google Scholar]
- Luxan G, Casanova JC, Martinez-Poveda B, Prados B, D'Amato G, MacGrogan D, Gonzalez-Rajal A, Dobarro D, Torroja C, Martinez F, et al. Mutations in the NOTCH pathway regulator MIB1 cause left ventricular noncompaction cardiomyopathy. Nat Med. 2013;19:193–201. doi: 10.1038/nm.3046. [DOI] [PubMed] [Google Scholar]
- Lyons I, Parsons LM, Hartley L, Li R, Andrews JE, Robb L, Harvey RP. Myogenic and morphogenetic defects in the heart tubes of murine embryos lacking the homeo box gene Nkx2-5. Genes Dev. 1995;9:1654–1666. doi: 10.1101/gad.9.13.1654. [DOI] [PubMed] [Google Scholar]
- Maaten van der LJP, Hinton GE. Visualizing High-Dimensional Data Using t-SNE. Journal of Machine Learning Research. 2008;9:2579–2605. [Google Scholar]
- Maere S, Heymans K, Kuiper M. BiNGO: a Cytoscape plugin to assess overrepresentation of gene ontology categories in biological networks. Bioinformatics. 2005;21:3448–3449. doi: 10.1093/bioinformatics/bti551. [DOI] [PubMed] [Google Scholar]
- Masters M, Riley PR. The epicardium signals the way towards heart regeneration. Stem Cell Res. 2014;13:683–692. doi: 10.1016/j.scr.2014.04.007. [DOI] [PMC free article] [PubMed] [Google Scholar]
- Mi H, Muruganujan A, Thomas PD. PANTHER in 2013: modeling the evolution of gene function, and other gene attributes, in the context of phylogenetic trees. Nucleic Acids Res. 2013;41:D377–386. doi: 10.1093/nar/gks1118. [DOI] [PMC free article] [PubMed] [Google Scholar]
- Moretti A, Caron L, Nakano A, Lam JT, Bernshausen A, Chen Y, Qyang Y, Bu L, Sasaki M, Martin-Puig S, et al. Multipotent embryonic isl1+ progenitor cells lead to cardiac, smooth muscle, and endothelial cell diversification. Cell. 2006;127:1151–1165. doi: 10.1016/j.cell.2006.10.029. [DOI] [PubMed] [Google Scholar]
- Murry CE, Keller G. Differentiation of embryonic stem cells to clinically relevant populations: lessons from embryonic development. Cell. 2008;132:661–680. doi: 10.1016/j.cell.2008.02.008. [DOI] [PubMed] [Google Scholar]
- Olson EN. Gene regulatory networks in the evolution and development of the heart. Science. 2006;313:1922–1927. doi: 10.1126/science.1132292. [DOI] [PMC free article] [PubMed] [Google Scholar]
- Paige SL, Plonowska K, Xu A, Wu SM. Molecular regulation of cardiomyocyte differentiation. Circ Res. 2015;116:341–353. doi: 10.1161/CIRCRESAHA.116.302752. [DOI] [PMC free article] [PubMed] [Google Scholar]
- Pereira FA, Qiu Y, Zhou G, Tsai MJ, Tsai SY. The orphan nuclear receptor COUP-TFII is required for angiogenesis and heart development. Genes Dev. 1999;13:1037–1049. doi: 10.1101/gad.13.8.1037. [DOI] [PMC free article] [PubMed] [Google Scholar]
- Picelli S, Bjorklund AK, Faridani OR, Sagasser S, Winberg G, Sandberg R. Smart-seq2 for sensitive full-length transcriptome profiling in single cells. Nat Methods. 2013;10:1096–1098. doi: 10.1038/nmeth.2639. [DOI] [PubMed] [Google Scholar]
- Prall OW, Menon MK, Solloway MJ, Watanabe Y, Zaffran S, Bajolle F, Biben C, McBride JJ, Robertson BR, Chaulet H, et al. An Nkx2-5/Bmp2/Smad1 negative feedback loop controls heart progenitor specification and proliferation. Cell. 2007;128:947–959. doi: 10.1016/j.cell.2007.01.042. [DOI] [PMC free article] [PubMed] [Google Scholar]
- Saga Y, Kitajima S, Miyagawa-Tomita S. Mesp1 expression is the earliest sign of cardiovascular development. Trends Cardiovasc Med. 2000;10:345–352. doi: 10.1016/s1050-1738(01)00069-x. [DOI] [PubMed] [Google Scholar]
- Satija R, Farrell JA, Gennert D, Schier AF, Regev A. Spatial reconstruction of single-cell gene expression data. Nat Biotechnol. 2015;33:495–502. doi: 10.1038/nbt.3192. [DOI] [PMC free article] [PubMed] [Google Scholar]
- Sun Y, Liang X, Najafi N, Cass M, Lin L, Cai CL, Chen J, Evans SM. Islet 1 is expressed in distinct cardiovascular lineages, including pacemaker and coronary vascular cells. Dev Biol. 2007;304:286–296. doi: 10.1016/j.ydbio.2006.12.048. [DOI] [PMC free article] [PubMed] [Google Scholar]
- Tanaka M, Chen Z, Bartunkova S, Yamasaki N, Izumo S. The cardiac homeobox gene Csx/Nkx2.5 lies genetically upstream of multiple genes essential for heart development. Development. 1999;126:1269–1280. doi: 10.1242/dev.126.6.1269. [DOI] [PubMed] [Google Scholar]
- Tarnawski L, Xian X, Monnerat G, Macaulay IC, Malan D, Borgman A, Wu SM, Fleischmann BK, Jovinge S. Integrin Based Isolation Enables Purification of Murine Lineage Committed Cardiomyocytes. PLoS One. 2015;10:e0135880. doi: 10.1371/journal.pone.0135880. [DOI] [PMC free article] [PubMed] [Google Scholar]
- Trapnell C, Cacchiarelli D, Grimsby J, Pokharel P, Li S, Morse M, Lennon NJ, Livak KJ, Mikkelsen TS, Rinn JL. The dynamics and regulators of cell fate decisions are revealed by pseudotemporal ordering of single cells. Nat Biotechnol. 2014;32:381–386. doi: 10.1038/nbt.2859. [DOI] [PMC free article] [PubMed] [Google Scholar]
- Treutlein B, Brownfield DG, Wu AR, Neff NF, Mantalas GL, Espinoza FH, Desai TJ, Krasnow MA, Quake SR. Reconstructing lineage hierarchies of the distal lung epithelium using single-cell RNA-seq. Nature. 2014;509:371–375. doi: 10.1038/nature13173. [DOI] [PMC free article] [PubMed] [Google Scholar]
- Tsuda T, Wang H, Timpl R, Chu ML. Fibulin-2 expression marks transformed mesenchymal cells in developing cardiac valves, aortic arch vessels, and coronary vessels. Dev Dyn. 2001;222:89–100. doi: 10.1002/dvdy.1172. [DOI] [PubMed] [Google Scholar]
- Wu AR, Neff NF, Kalisky T, Dalerba P, Treutlein B, Rothenberg ME, Mburu FM, Mantalas GL, Sim S, Clarke MF, et al. Quantitative assessment of single-cell RNA-sequencing methods. Nat Methods. 2014;11:41–46. doi: 10.1038/nmeth.2694. [DOI] [PMC free article] [PubMed] [Google Scholar]
- Wu SM, Chien KR, Mummery C. Origins and fates of cardiovascular progenitor cells. Cell. 2008;132:537–543. doi: 10.1016/j.cell.2008.02.002. [DOI] [PMC free article] [PubMed] [Google Scholar]
- Wu SM, Fujiwara Y, Cibulsky SM, Clapham DE, Lien CL, Schultheiss TM, Orkin SH. Developmental origin of a bipotential myocardial and smooth muscle cell precursor in the mammalian heart. Cell. 2006;127:1137–1150. doi: 10.1016/j.cell.2006.10.028. [DOI] [PubMed] [Google Scholar]
- Xue Z, Huang K, Cai C, Cai L, Jiang CY, Feng Y, Liu Z, Zeng Q, Cheng L, Sun YE, et al. Genetic programs in human and mouse early embryos revealed by single-cell RNA sequencing. Nature. 2013;500:593–597. doi: 10.1038/nature12364. [DOI] [PMC free article] [PubMed] [Google Scholar]
- Yang L, Cai CL, Lin L, Qyang Y, Chung C, Monteiro RM, Mummery CL, Fishman GI, Cogen A, Evans S. Isl1Cre reveals a common Bmp pathway in heart and limb development. Development. 2006;133:1575–1585. doi: 10.1242/dev.02322. [DOI] [PMC free article] [PubMed] [Google Scholar]
- Zhang H, Pu W, Li G, Huang X, He L, Tian X, Liu Q, Zhang L, Wu SM, Sucov HM, et al. Endocardium Minimally Contributes to Coronary Endothelium in the Embryonic Ventricular Free Walls. Circ Res. 2016;118:1880–1893. doi: 10.1161/CIRCRESAHA.116.308749. [DOI] [PubMed] [Google Scholar]
Associated Data
This section collects any data citations, data availability statements, or supplementary materials included in this article.