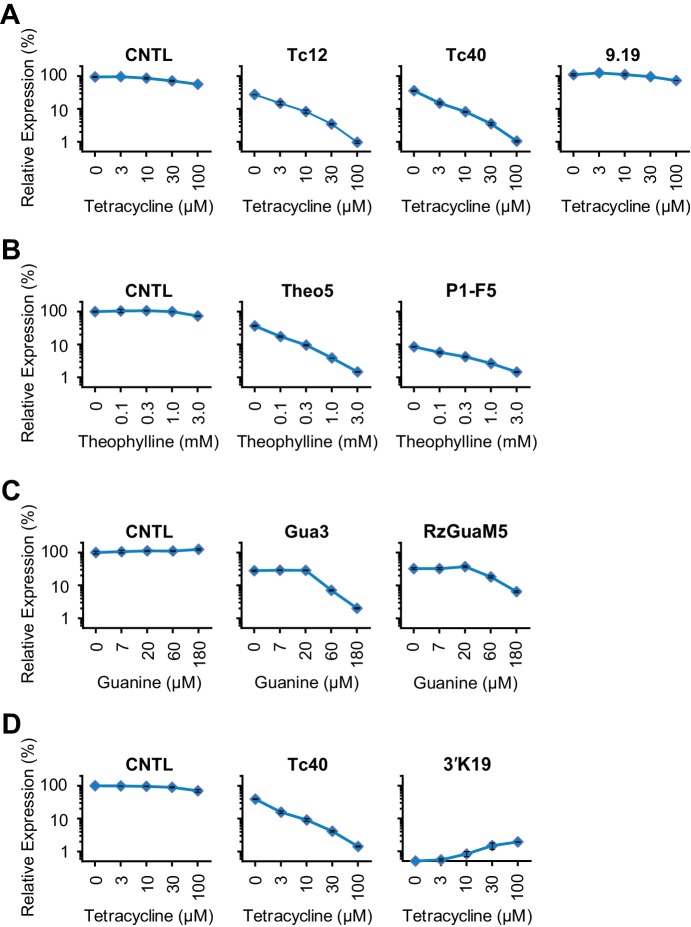
Figure 3. Validation of the design principles.
(A–D) Secondary structures of Tc-P1 (A) or Tc-P2 (C) aptazymes, varying in communication-module lengths and the stem to which the ribozyme is attached, are shown without their ribozyme domains. HeLa cells transiently transfected with plasmids expressing GLuc regulated by Tc-P1 (B) or Tc-P2 (D) aptazymes were cultured with 0, 3, 10, 30, or 100 µM of Tc for 2 days. GLuc secreted into the culture supernatant was measured by a luminescence assay, and CDRs were calculated as in Figure 1E. WHSS values for each aptazyme are shown above figures. () Secondary structure of a theophylline (Theo) aptazyme, with its ribozyme domain omitted. (F) Experiments similar to (B) except that HeLa cells transiently transfected with plasmids expressing GLuc regulated by Theo aptazymes were cultured with 0, 0.1, 0.3, 1.0, 3.0 mM theophylline for 2 days. WHSS values are shown above figure. (G) Secondary structure of a guanine (Gua) aptazyme, with ribozyme omitted. (H) Experiments similar to (B) except that 293T cells transiently transfected with plasmids expressing GLuc regulated by Gua aptazymes were cultured with 0, 7, 20, 60, or 180 µM of guanine for 1 day. WHSS values are shown above figure. BE, LE, and CDR values of all validation-panel aptazymes are available in Figure 3—source data 1. (I) BE and LE of all aptazyme variants from the test panel and the four validation panels were plotted against WHSS of the corresponding variant. (J) CDRs of all aptazymes were similarly plotted against their WHSS values. (K–M) Aptazymes with the highest CDRs from each class (olive) are compared to previously described aptazyme off-switches (white) with the highest reported dynamic ranges. Tc-P1 aptazyme Tc12 and Tc-P2 aptazyme Tc40 are compared to 9.19 (Wittmann and Suess, 2011) (K); Theo5 is compared to P1-F5 (Auslander et al., 2010) (L); and Gua3 aptazyme is compared to RzGuaM5 (Nomura et al., 2012) (M). (N) Tc40 is compared to a previously described aptazyme on-switch, 3’K19 (Beilstein et al., 2015). Data shown are representative of two or three independent experiments. Data points in panels I and J represent mean of three biological replicates, and data points in remaining figures represent mean ± S.D. of three biological replicates.
DOI: http://dx.doi.org/10.7554/eLife.18858.009


