

Abstract
One exercise session can induce subsequently elevated insulin sensitivity that is largely attributable to greater insulin-stimulated glucose uptake by skeletal muscle. Because skeletal muscle is a heterogeneous tissue comprised of diverse fiber types, our primary aim was to determine exercise effects on insulin-independent and insulin-dependent glucose uptake by single fibers of different fiber types. We hypothesized that each fiber type featuring elevated insulin-independent glucose uptake immediately postexercise (IPEX) would be characterized by increased insulin-dependent glucose uptake at 3.5 h postexercise (3.5hPEX). Rat epitrochlearis muscles were isolated and incubated with 2-[3H]deoxyglucose. Muscles from IPEX and sedentary (SED) controls were incubated without insulin. Muscles from 3.5hPEX and SED controls were incubated ± insulin. Glucose uptake (2-[3H]deoxyglucose accumulation) and fiber type (myosin heavy chain isoform expression) were determined for single fibers dissected from the muscles. Major new findings included the following: 1) insulin-independent glucose uptake was increased IPEX in single fibers of each fiber type (types I, IIA, IIB, IIBX, and IIX), 2) glucose uptake values from insulin-stimulated type I and IIA fibers exceeded the values for the other fiber types, 3) insulin-stimulated glucose uptake for type IIX exceeded IIB fibers, and 4) the 3.5hPEX group vs. SED had greater insulin-stimulated glucose uptake in type I, IIA, IIB, and IIBX but not type IIX fibers. Insulin-dependent glucose uptake was increased at 3.5hPEX in each fiber type except for IIX fibers, although insulin-independent glucose uptake was increased IPEX in all fiber types (including type IIX). Single fiber analysis enabled the discovery of this fiber type-related difference for postexercise, insulin-stimulated glucose uptake.
Keywords: glucose transport, insulin sensitivity and insulin resistance, exercise
skeletal muscle is the major site of whole body insulin-mediated glucose clearance, and insulin resistance in skeletal muscle plays a central role in the development of type 2 diabetes (12, 21, 28, 40). Accordingly, it is imperative to understand interventions that effectively oppose skeletal muscle insulin resistance. A single exercise bout by rats, mice, or humans can improve subsequent whole body insulin sensitivity, and this benefit is attributable largely to enhanced insulin-stimulated glucose uptake by skeletal muscle (5, 6, 22, 37, 46).
Because skeletal muscle is a heterogeneous tissue comprised of several metabolically diverse muscle fiber types (47), it is necessary to test rigorously for possible fiber type-selective differences in glucose uptake after exercise. The gold-standard approach for identifying muscle fiber type is based on myosin heavy chain isoform (MHC) expression (35), and skeletal muscle from adult rats expresses four MHC isoforms: types I, IIA, IIB, and IIX (23). The conventional approach to evaluate possible fiber type differences has been to measure glucose uptake by multiple rodent muscles or regions of muscles with differing fiber type profiles (22, 25, 37). However, tissue analyses cannot resolve fiber type differences in glucose uptake at the cellular level because 1) whole muscles include multiple fiber types; 2) apparently, no rodent muscle that is mostly comprised of type IIX fibers has been identified; 3) measurement of glucose uptake by fibers expressing multiple MHC isoforms (i.e., hybrid fibers) requires single fiber analysis, and hybrid fibers can account for ∼10–30% of fibers in rat muscle (4, 23), so ignoring hybrid fibers disregards a significant portion of the muscle; and 4) various cell types (including neural, vascular, and adipose cells) contribute to glucose uptake that is determined in muscle tissue samples.
The limitations of muscle tissue analysis motivated us to recently develop and validate the first method to determine both glucose uptake and fiber type in a single rat skeletal muscle fiber (33). Our novel approach revealed substantial differences among the fiber types for insulin-dependent glucose uptake. We have also used this approach to assess the influence of obesity, aging, and electrically stimulated muscle contractile activity on glucose uptake by single fibers (8, 32, 33).
The current study is the first test of exercise effects on glucose uptake by single muscle fibers of differing fiber types. We assessed insulin-independent glucose uptake immediately after acute exercise and both insulin-independent and insulin-dependent glucose uptake at 3.5 h postexercise (3.5hPEX). Previous research has repeatedly demonstrated a substantial elevation in insulin-dependent glucose uptake by skeletal muscle of rats at ∼3–4 h after acute exercise (3, 7, 9, 17, 18, 41, 45).
There were many reasons for using the rat epitrochlearis muscle in this study. It is well-suited for ex vivo incubation experiments because it is a very thin muscle, and its geometry allows for adequate diffusion of nutrients into the muscle (44). It is recruited during swim exercise, as indicated by increased AMP-activated protein kinase phosphorylation, glycogen depletion, and increased insulin-independent glucose uptake (3, 18, 41). The epitrochlearis has been successfully used to isolate single fibers and determine both fiber type and glucose uptake (8, 33). In addition, the fiber type composition of the epitrochlearis (type I = 8%, IIA = 13%, IIB = 51%, and IIX = 28%) (10) is roughly similar to the fiber type of the entire hindlimb muscle mass in the rat (type I = 6%, IIA = 5%, IIB = 71%, and IIX = 18%) (13).
All previous studies on insulin-stimulated glucose uptake by single fibers used a supraphysiological insulin concentration (32, 33), so it is noteworthy that the current study used a physiological insulin concentration. Our earlier research was limited to type II (fast-twitch) fiber types (8, 32, 33). An important breakthrough of the current study is that we measured glucose uptake in single fibers expressing each of the MHC isoforms, including fibers expressing type I (slow-twitch) MHC. Insulin-independent glucose uptake by the active skeletal muscle tissue is increased during and shortly after exercise, and the improved insulin-stimulated glucose uptake after exercise is localized to the previously exercised skeletal muscle at the whole muscle level (2, 38, 39, 46). We hypothesized that each fiber type that was found to be characterized by elevated insulin-independent glucose uptake immediately postexercise would also be characterized by increased insulin-dependent glucose uptake at 3.5hPEX.
MATERIALS AND METHODS
Materials.
The reagents and apparatus for SDS-PAGE were from Bio-Rad Laboratories (Hercules, CA). 2-[3H]deoxyglucose (2-[3H]DG; NET328001MC) was from Perkin-Elmer (Waltham, MA). Tissue Protein Extraction Reagent, T-PER (PI78510), and SimplyBlue SafeStain (LC6065) were from ThermoFisher (Pittsburgh, PA). Collagenase type 2 (305 U/mg) was from Worthington Biochemical (LS004177) (Lakewood, NJ).
Animal treatment.
Procedures for animal care were approved by the University of Michigan Committee on Use and Care of Animals. Male Wistar rats (∼250 g; Envigo, Indianapolis, IN) were provided with standard rodent chow (Laboratory Diet no. 5001; PMI Nutrition International, Brentwood, MO) ad libitum until they were fasted the night before the experiment at ∼1700.
We used an exercise protocol that has been demonstrated repeatedly to induce increased insulin-stimulated glucose uptake by whole epitrochlearis muscles from rats at ∼3–4 h following completion of the exercise (3, 9, 17, 18, 41, 42). Beginning at ∼0730, exercised rats swam in a barrel filled with water (35°C, ∼45 cm in depth; 6 rats/barrel) for four 30-min bouts, with a 5-min rest between bouts. Some rats (n = 7) were anesthetized (intraperitoneal pentobarbital sodium, 50 mg/kg weight) immediately postexercise (IPEX) along with time-matched sedentary controls (SED; n = 7), and their epitrochlearis muscles were isolated. Muscles were used for insulin-independent glucose uptake by either whole muscles or single fibers. Other exercising rats (n = 15) were dried and returned to their cages without food for 3.5 h and then anesthetized along with their time-matched sedentary controls (n = 15). The epitrochlearis muscles of both groups were dissected out to measure insulin-independent and insulin-dependent glucose uptake (3.5hPEX).
Muscle ex vivo incubations for single-fiber glucose uptake.
Isolated muscles were incubated in glass vials gassed (95% O2-5% CO2) in a temperature-controlled bath for a four-step process (35°C during steps 1, 2, and 4; step 3 was on ice) throughout all of the incubation steps. For IPEX muscles and their time-matched SED controls, step 1 (10 min) muscles were placed in vials containing 2 ml of media 1 [Krebs-Henseleit buffer (KHB) supplemented with 0.1% bovine serum albumin (BSA), 2 mM sodium pyruvate, and 6 mM mannitol]. For step 2 (30 min), each muscle was transferred to a vial containing 2 ml of step 2 media {KHB supplemented with 0.1% BSA, 0.1 mM 2-DG (13.5 mCi/mmol 2-[3H]DG), 2 mM sodium pyruvate, and 6 mM mannitol}. For step 3, muscles underwent three washes (5 min/wash with shaking at 115 rpm) in ice-cold wash media (Ca2+-free KHB supplemented with 0.1% BSA and 8 mM glucose) to clear the extracellular space of 2-[3H]DG. For step 4 (60 min), muscles were incubated in vials containing collagenase media [wash media supplemented with 8 mM glucose and 1.5% type 2 collagenase] for enzymatic digestion of muscle collagen (collagenase-treated muscles are hereafter referred to as fiber bundles). For 3.5hPEX muscles and their time-matched SED-controls, step 1 (30 min) media included KHB supplemented with 2 mM sodium pyruvate and 6 mM mannitol and either 0 or 0.6 nM insulin. For step 2 (60 min), muscles were transferred to the same media as in step 1 supplemented with 0.1 mM 2-deoxy-d-glucose and 13.5 mCi/mmol 2-[3H]DG. Steps 3 and 4 in the 3.5hPEX experiment were identical to the same steps described above for the IPEX experiment.
Isolation and processing of single fibers for glucose uptake and MHC isoform identification.
After incubation step 4, fiber bundles were removed from collagenase media and rinsed with wash media at room temperature. Under a dissecting microscope (EZ4D; Leica, Buffalo Grove, IL), intact single fibers (∼35 fibers/muscle) were gently teased away from the fiber bundle using forceps. After isolation, each fiber was imaged using a camera-enabled microscope with Leica Application Suite EZ software. We modified and improved our method for determining muscle fiber size using ImageJ software (National Institutes of Health). Our original method estimated fiber volume based on measurement of fiber length and the average of three measurements of fiber width, where V = πr2l; V is volume, r is radius as determined by half of the mean width measurement, and l is length (33). We compared estimated volume to an alternative measurement of fiber size: fiber area calculated with ImageJ software based on determination of fiber perimeter. Two experienced researchers analyzed an identical set of fiber images, and the coefficient of determination was greater for calculated fiber area (r2 = 0.9885) compared with estimated fiber volume (r2 = 0.9317). Therefore, we expressed 2-[3H]DG accumulation relative to calculated fiber area (picomoles/mm−2). After imaging, each fiber was transferred by pipette with 20 μl of wash media to a microcentrifuge tube. Lysis buffer (30 μl; T-PER supplemented with 1% Triton X-100, 1 mM Na3VO4, 1 mM EDTA, 1 mM EGTA, 2.5 mM sodium pyrophosphate tetrabasic decahydrate, 1 mM β-glycerophosphate, 1 μg/ml leupeptin, and 1 mM phenylmethylsulfonyl fluoride) and 2× Laemmli buffer (50 μl) were added to each isolated fiber tube. Tubes were then vortexed and heated to 95–100°C for 10 min. Samples were then cooled and stored at −20°C until glucose uptake and MHC isoform abundance were determined.
Single-fiber glucose uptake.
An aliquot of each lysed single fiber was pipetted into a separate vial containing 8 ml of a scintillation cocktail. The single fiber disintegrations per minute together with the 2-[3H]DG in the media (disintegrations·min−1·pmol−1) were then used to calculate the accumulation of 2-[3H]DG expressed relative to fiber area (pmol/mm−2).
MHC isoform identification.
MHC isoforms in aliquots of single-fiber lysates were separated and identified by SDS-PAGE essentially as described previously (8). MHC isoform expression was determined by comparing the migration of MHC protein band(s) from each fiber with a MHC isoform standard [6 μg of protein of a 3:2 mixture of homogenized rat extensor digitorum longus (EDL) and soleus muscles] containing all four MHC isoforms: I, IIA, IIB, and IIX.
Statistics.
Statistical analysis was performed using Sigma Plot (San Rafael, CA) version 11.0. A Mann-Whitney rank sum test was used to compare two groups. The Kruskal-Wallis one-way analysis of variance on ranks followed by Dunn's method for multiple comparisons was used for comparisons between more than two groups. Data were expressed as means ± SE. A P value of ≤0.05 was considered statistically significant.
RESULTS
MHC isoforms were identified in 3,065 single fibers using SDS-PAGE, followed by protein staining (representative gel; Fig. 1). In the IPEX/SED groups, fiber numbers were types I (4/10), IIA (50/76), IIB (217/224), IIBX (106/103), and IIX (196/172). For the 3.5hPEX no insulin/3.5hPEX insulin/SED no insulin/SED insulin groups, the fiber numbers were types I (18/21/17/33), IIA (35/63/58/56), IIB (162/174/221/227), IIBX (97/83/85/80), and IIX (148/93/119/117). Glucose uptake was also determined for each fiber.
Fig. 1.
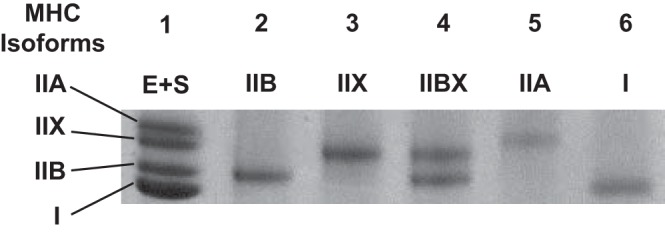
Representative SDS-PAGE of single fibers. Lane 1: rat extensor digitorum longus (EDL) and soleus muscle (E + S), pooled EDL + soleus standard. Lane 2: type IIB fiber. Lane 3: type IIX fiber. Lane 4: type IIBX fiber. Lane 5: type IIA fiber. Lane 6: type I fiber. MHC, myosin heavy chain.
For the IPEX group compared with their SED controls, insulin-independent glucose uptake was significantly increased (P < 0.05) within each fiber type: I, IIA, IIB, IIBX, and IIX (Fig. 2). These results suggest that each fiber type was recruited by the exercise protocol.
Fig. 2.

Effect of exercise on insulin-independent glucose uptake in single fibers from each fiber type. *P < 0.05, immediately postexercise (IPEX) vs. sedentary (SED) for each fiber type. 2-DG, 2-[3H]deoxyglucose.
This study was the first to assess possible fiber type differences for single fiber glucose uptake in which 1) an insulin concentration in the high physiological range was used and 2) type I fibers were included in the analysis (Fig. 3). In every fiber type from the SED rats, there was a significant (P < 0.001) increase in insulin-stimulated glucose uptake compared with the same fiber type without insulin. Glucose uptake by insulin-stimulated type I and IIA fibers significantly exceeded (P < 0.01) the values for type IIB, IIBX, and IIX fibers. Glucose uptake by insulin-stimulated type IIX fibers was greater (P < 0.001) than the values for insulin-stimulated type IIB fibers. Insulin-independent glucose uptake for type IIA fibers was greater (P < 0.001) than insulin-independent glucose uptake for type IIB fibers.
Fig. 3.
Effects of fiber type and insulin on glucose uptake in single fibers from SED rats. *P < 0.001, insulin vs. no insulin within each fiber type; †P < 0.01, types I and IIA with insulin vs. types IIB, IIBX, and IIX with insulin; #P < 0.001, type IIX with insulin vs. type IIB with insulin; ‡P < 0.001, type IIA no insulin vs. type IIB no insulin.
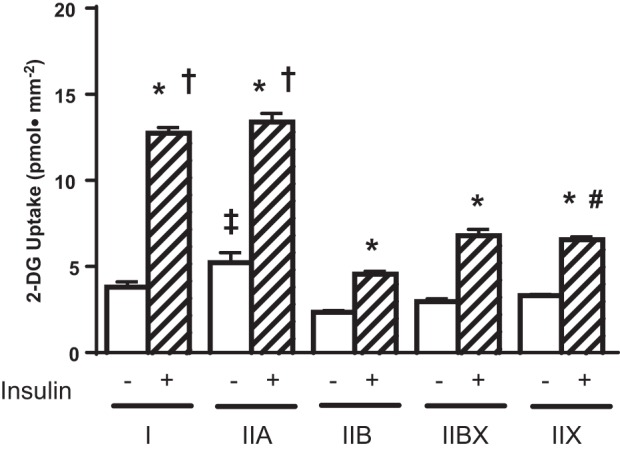
For the 3.5hPEX group compared with their SED controls, there was a small but significant (P < 0.01) increase in insulin-independent glucose uptake for type IIB, IIBX, and IIX fibers (Fig. 4). For type I, IIA, IIB, and IIBX fibers from muscles incubated with insulin, glucose uptake was greater (P < 0.05) for the 3.5hPEX group vs. SED controls. In contrast to all of the other fiber types, the glucose uptake from insulin-stimulated type IIX fibers from the 3.5hPEX was not significantly different from the insulin-stimulated IIX fibers from the SED controls.
Fig. 4.

Effects of insulin and exercise on insulin-independent and insulin-dependent glucose uptake in single fibers from each fiber type. *P < 0.001, insulin vs. no insulin within the same fiber type in both the SED and the 3.5 h postexercise (3.5hPEX) groups; †P < 0.05, 3.5hPEX with insulin vs. SED with insulin within the same fiber type; ‡P < 0.01, 3.5hPEX no insulin vs. SED no insulin in the same fiber type.
DISCUSSION
Conventional tissue analysis cannot elucidate glucose uptake in skeletal muscle at the cellular level. Accordingly, the current analysis of single fibers revealed a number of valuable and novel insights. The major new findings included the following: 1) exercise led to elevated insulin-independent glucose uptake IPEX in single fibers of each fiber type; 2) 0.6 nM insulin (a concentration in the high physiological range) significantly increased glucose uptake by single fibers of each fiber type; 3) glucose uptake values from insulin-stimulated muscles for types I and IIA were greater than the values for the other fiber types; 4) insulin-stimulated glucose uptake were greater for type IIX vs. type IIB fibers; and 5) the 3.5hPEX group vs. their SED controls had greater insulin-stimulated glucose uptake in type I, IIA, IIB, and IIBX but not type IIX fibers.
The current study was the first to successfully isolate and measure glucose uptake in single type I fibers. Multiple factors likely contributed to the failure of earlier studies to isolate type I fibers from rat epitrochlearis muscles (8, 32, 33). Among all fiber types in rat epitrochlearis muscle, relative abundance is lowest for type I fibers (10). Fiber width in rat muscles is lower for type I compared with type IIB, IIBX, and IIX fibers (4). Type I fibers are localized primarily near the central portion of the rat epitrochlearis (44). The successful strategy for isolating all fiber types, including type I fibers, was to sample a very large number of fibers and to intentionally include fibers with a range of diameters that were located in both peripheral and central regions of the fiber bundles.
The current study was also the first to assess glucose uptake by single fibers that were characterized for fiber type and stimulated with a physiological insulin concentration. In muscles from SED rats, the insulin-stimulated values were not different for type I compared with IIA fibers, and insulin-stimulated values for both of these fiber types exceeded the values of the other fiber types (IIB, IIBX, and IIX). Earlier research using a supraphysiological insulin concentration also found the highest glucose uptake in type IIA fibers (type I fibers were not isolated in the earlier study) and the lowest glucose uptake in type IIB fibers (33). These results for single fibers were comparable with the results of Henriksen et al. (25), who reported glucose uptake for rat muscle tissue preparations with a supraphysiological insulin concentration. Insulin-stimulated glucose uptake for the soleus (predominantly type I) was similar to the flexor digitorum brevis (predominantly type IIA), and the values for these highly oxidative muscles exceeded the values for the epitrochlearis and the EDL (both predominantly type IIB). Apparently, no rat muscle that is comprised predominantly of type IIX fibers has been identified, and glucose uptake by hybrid fibers cannot be discerned from tissue analysis. Therefore, the current study provides unique information about the glucose uptake of type IIX and IIBX fibers with a physiological insulin dose.
At the whole muscle level, elevated insulin-independent glucose uptake immediately after electrically stimulated contraction or exercise is a hallmark indicator of muscle recruitment (11, 14, 39). Recently, we reported that an electrical stimulation protocol that would be expected to recruit all fiber types resulted in increased insulin-independent glucose uptake by single fibers in every fiber type analyzed (8). In this context, the greater insulin-independent glucose uptake determined that IPEX in each fiber type provides strong evidence that each fiber type was recruited by the current exercise protocol. The increased glucose uptake in muscle tissue stimulated by either electrically stimulated contractions or in vivo exercise is attributable to redistribution of intracellular GLUT4 protein transporters to cell surface membranes (14, 19, 39). Electrically stimulated contraction has been shown to increase GLUT4 redistribution to the cell surface membranes of single fibers (31), but the possible effects of fiber type on GLUT4 translocation induced by contractions or exercise have not been assessed in single fibers.
The same exercise protocol that was used in the current study has previously been reported to cause a two- to fourfold increase in insulin-independent increase in glucose uptake determined in the whole epitrochlearis muscles immediately after exercise (3, 9, 17, 18, 42). The relative magnitude of this increase is comparable with the range of increases (1.8- to 4-fold) found for single fibers in the current study. By 3 to 4 h after exercise, the elevated insulin-independent glucose uptake by whole epitrochlearis muscles has been reported to be either mostly (3, 9, 42) or completely (17, 18) reversed. The results for whole muscles are similar to the findings for single fibers that were characterized by either no significant residual increase (type I and IIA fibers) or only a modest residual increase (type IIB, IIBX, and IIX fibers) in insulin-independent glucose uptake at 3.5hPEX. The increased GLUT4 in cell surface membranes of skeletal muscle fibers that was described previously immediately after electrically stimulated contractions was ∼80–90% reversed at 130 min postcontraction (31). It seems reasonable to expect that the nearly complete reversal of the increased insulin-independent glucose uptake in each fiber type at 3.5hPEX might be explained by a similarly transient exercise effect on insulin-independent GLUT4 translocation.
Although there are caveats when using tissue analysis for understanding fiber type-related differences, data from muscle tissue preparations can provide useful information. The original study by Richter et al. (37) that first demonstrated increased insulin sensitivity in the perfused rat hindlimb muscle preparation at ∼60 min after acute exercise (47 min of treadmill running) was also the first study to include data for the effect of acute exercise on glucose uptake by individual insulin-stimulated (75 μU/ml insulin) muscles and muscle regions of differing fiber types. They studied muscles that were known to differ markedly in their relative fiber type composition: the soleus (type I = 88%, type IIA = 12%, type IIB = 0%, and type IIX = 0%), red gastrocnemius (RG; type I = 20%, type IIA = 17%, type IIB = 32%, and type IIX = 31%), and white gastrocnemius (WG; type I = 1%, type IIA = 7%, type IIB = 72%, and type IIX = 20%) (10). Exercise significantly increased glucose uptake only in the RG, along with a nonsignificant trend for greater glucose uptake in the WG and no evidence for an increase in the soleus. Oakes et al. (34) reported that in rats consuming a high-fat diet, glucose uptake in both the red quadriceps (RQ) and white quadriceps (WQ) muscle during a euglycemic hyperinsulinemic clamp (∼0.9nM insulin) was greater 24 h after acute exercise (120-min swim) vs. sedentary controls. The fiber type percentages for these rat muscles have been reported to be as follows: RQ type I = 10%, type IIA = 22%, type IIB = 38%, type IIX = 29%; and WQ type I = 0%, type IIA = 0%, type IIB = 69%, type IIX = 31% (15). Hamada et al. (22) reported that in mice studied ∼75 min after acute exercise (60 min of treadmill running), insulin-stimulated (0.36 nM) glucose uptake was elevated in isolated soleus, EDL, and epitrochlearis muscles. In the mouse, fiber type percentages have been reported for the soleus (type I = 54%, type IIA = 31%, type IIB = 0%, and type IIX = 15%) and EDL (type I = 4%, type IIA = 0%, type IIB = 87%, and type IIX = 9%) (1), but apparently not for the epitrochlearis. A simple relationship between fiber type and susceptibility to exercise-induced improvement in insulin sensitivity does not emerge from the results of these earlier studies. The complexity is probably attributable to various experimental differences, including species, exercise models, methods and timing of glucose uptake analysis, and the muscles studied. None of these previous studies included a muscle that was comprised predominantly of either type IIA or IIX fibers, and the earlier tissue analysis provided no information about exercise effects on hybrid fibers. Accordingly, the current approach provides unprecedented new insights that were impossible based on research using conventional tissue analysis.
Many studies have attempted to elucidate the relationship between muscle glycogen and the insulin-independent increase in glucose uptake during and shortly after exercise and the enhanced insulin-stimulated glucose uptake that is evident for hours after exercise is completed (5, 26, 27, 29, 39). Multiple lines of evidence from this research suggest that reduction in muscle glycogen levels may not be essential for either the increased insulin-independent glucose uptake immediately after exercise or the long-lasting increase in insulin sensitivity several hours following exercise. However, glycogen concentration may play a significant modulatory role in each of these exercise-induced effects. For example, it has been suggested that the reaccumulation of glycogen in muscle after exercise may play a role in reversing the enhanced insulin sensitivity for glucose uptake (5, 7). It would be interesting to determine in single fibers the extent to which glycogen was reduced immediately after exercise and to assess the level of glycogen resynthesis at 3.5hPEX.
A model for understanding the increased insulin-stimulated glucose uptake by muscle after acute exercise has been proposed recently (5). Triggers are the initial events that stimulate subsequent memory elements that store information, which in turn is transmitted to mediators that translate the memory into action by regulating an end effector that is the element that is directly responsible for producing greater insulin-stimulated glucose transport. Previous research has offered preliminary ideas about candidates for each of the sequential steps. There is evidence that stimulation of AMP-activated protein kinase may be a potential trigger (5, 16, 29, 30). The postexercise sequestration of GLUT4 to an unidentified intracellular location characterized by enhanced susceptibility for subsequent recruitment by insulin has been suggested as a possible memory element (5, 20). Greater AS160 (Akt substrate of 160 kDa; also known as TBC1D4) phosphorylation has been proposed as a candidate to serve as a mediator (5). There is strong evidence that increased cell surface GLUT4 glucose transporter content is the likely end effector that leads directly to greater insulin-stimulated glucose uptake (5, 24). The previous research related to these mechanisms comes from tissue analysis, and these ideas have not yet been tested at the cellular level.
The results of this study create an opportunity to design future experiments focused on the mechanisms that lead to improved insulin sensitivity in single fibers after exercise. Earlier research using muscle tissue implicated elevated site-selective phosphorylation of AS160 as an attractive candidate to serve as a mediator for the increased insulin sensitivity (3, 5, 9, 17, 18, 36, 41, 43), leading ultimately to increased cell surface GLUT4 content. In view of the current results, our new working hypothesis is that AS160 phosphorylation and cell surface GLUT4 levels will be increased in insulin-stimulated type I, IIA, IIB, and IIBX fibers but not IIX fibers at 3.5hPEX. The current study represents an important step forward in the long process aimed at ultimately identifying the cellular mechanisms for increased insulin sensitivity in skeletal muscle after exercise.
GRANTS
This work was supported by a grant to G. D. Cartee from the National Institutes of Health (DK-71771).
DISCLOSURES
No conflicts of interest, financial or otherwise, are declared by the authors.
AUTHOR CONTRIBUTIONS
G.D.C. conception and design of research; G.D.C. and C.S.Y. analyzed data; G.D.C. interpreted results of experiments; G.D.C. drafted manuscript; G.D.C., E.B.A., C.S.Y., and M.W.P. edited and revised manuscript; G.D.C., E.B.A., C.S.Y., and M.W.P. approved final version of manuscript; E.B.A., C.S.Y., and M.W.P. performed experiments.
ACKNOWLEDGMENTS
We thank Yilin Nie and Kallisse Dent for their excellent technical assistance.
REFERENCES
- 1.Agbulut O, Noirez P, Beaumont F, Butler-Browne G. Myosin heavy chain isoforms in postnatal muscle development of mice. Biol Cell 95: 399–406, 2003. [DOI] [PubMed] [Google Scholar]
- 2.Annuzzi G, Riccardi G, Capaldo B, Kaijser L. Increased insulin-stimulated glucose uptake by exercised human muscles one day after prolonged physical exercise. Eur J Clin Invest 21: 6–12, 1991. [DOI] [PubMed] [Google Scholar]
- 3.Arias EB, Kim J, Funai K, Cartee GD. Prior exercise increases phosphorylation of Akt substrate of 160 kDa (AS160) in rat skeletal muscle. Am J Physiol Endocrinol Metab 292: E1191–E1200, 2007. [DOI] [PubMed] [Google Scholar]
- 4.Bloemberg D, Quadrilatero J. Rapid determination of myosin heavy chain expression in rat, mouse, and human skeletal muscle using multicolor immunofluorescence analysis. PLoS One 7: e35273, 2012. [DOI] [PMC free article] [PubMed] [Google Scholar]
- 5.Cartee GD. Mechanisms for greater insulin-stimulated glucose uptake in normal and insulin-resistant skeletal muscle after acute exercise. Am J Physiol Endocrinol Metab 309: E949–E959, 2015. [DOI] [PMC free article] [PubMed] [Google Scholar]
- 6.Cartee GD, Holloszy JO. Exercise increases susceptibility of muscle glucose transport to activation by various stimuli. Am J Physiol Endocrinol Metab 258: E390–E393, 1990. [DOI] [PubMed] [Google Scholar]
- 7.Cartee GD, Young DA, Sleeper MD, Zierath J, Wallberg-Henriksson H, Holloszy JO. Prolonged increase in insulin-stimulated glucose transport in muscle after exercise. Am J Physiol Endocrinol Metab 256: E494–E499, 1989. [DOI] [PubMed] [Google Scholar]
- 8.Castorena CM, Arias EB, Sharma N, Bogan JS, Cartee GD. Fiber type effects on contraction-stimulated glucose uptake and GLUT4 abundance in single fibers from rat skeletal muscle. Am J Physiol Endocrinol Metab 308: E223–E230, 2015. [DOI] [PMC free article] [PubMed] [Google Scholar]
- 9.Castorena CM, Arias EB, Sharma N, Cartee GD. Postexercise improvement in insulin-stimulated glucose uptake occurs concomitant with greater AS160 phosphorylation in muscle from normal and insulin-resistant rats. Diabetes 63: 2297–2308, 2014. [DOI] [PMC free article] [PubMed] [Google Scholar]
- 10.Castorena CM, Mackrell JG, Bogan JS, Kanzaki M, Cartee GD. Clustering of GLUT4, TUG, and RUVBL2 protein levels correlate with myosin heavy chain isoform pattern in skeletal muscles, but AS160 and TBC1D1 levels do not. J Appl Physiol 111: 1106–1117, 2011. [DOI] [PMC free article] [PubMed] [Google Scholar]
- 11.Constable SH, Favier RJ, Cartee GD, Young DA, Holloszy JO. Muscle glucose transport: interactions of in vitro contractions, insulin, and exercise. J Appl Physiol 64: 2329–2332, 1988. [DOI] [PubMed] [Google Scholar]
- 12.DeFronzo RA, Jacot E, Jequier E, Maeder E, Wahren J, Felber JP. The effect of insulin on the disposal of intravenous glucose. Results from indirect calorimetry and hepatic and femoral venous catheterization. Diabetes 30: 1000–1007, 1981. [DOI] [PubMed] [Google Scholar]
- 13.Delp MD, Duan C. Composition and size of type I, IIA, IID/X, and IIB fibers and citrate synthase activity of rat muscle. J Appl Physiol 80: 261–270, 1996. [DOI] [PubMed] [Google Scholar]
- 14.Douen AG, Ramlal T, Rastogi S, Bilan PJ, Cartee GD, Vranic M, Holloszy JO, Klip A. Exercise induces recruitment of the “insulin-responsive glucose transporter”. Evidence for distinct intracellular insulin- and exercise-recruitable transporter pools in skeletal muscle. J Biol Chem 265: 13427–13430, 1990. [PubMed] [Google Scholar]
- 15.Drummond MJ, Conlee RK, Mack GW, Sudweeks S, Schaalje GB, Parcell AC. Myogenic regulatory factor response to resistance exercise volume in skeletal muscle. Eur J Appl Physiol 108: 771–778, 2010. [DOI] [PubMed] [Google Scholar]
- 16.Fisher JS, Gao J, Han DH, Holloszy JO, Nolte LA. Activation of AMP kinase enhances sensitivity of muscle glucose transport to insulin. Am J Physiol Endocrinol Metab 282: E18–E23, 2002. [DOI] [PubMed] [Google Scholar]
- 17.Funai K, Schweitzer GG, Castorena CM, Kanzaki M, Cartee GD. In vivo exercise followed by in vitro contraction additively elevates subsequent insulin-stimulated glucose transport by rat skeletal muscle. Am J Physiol Endocrinol Metab 298: E999–E1010, 2010. [DOI] [PMC free article] [PubMed] [Google Scholar]
- 18.Funai K, Schweitzer GG, Sharma N, Kanzaki M, Cartee GD. Increased AS160 phosphorylation, but not TBC1D1 phosphorylation, with increased postexercise insulin sensitivity in rat skeletal muscle. Am J Physiol Endocrinol Metab 297: E242–E251, 2009. [DOI] [PMC free article] [PubMed] [Google Scholar]
- 19.Gao J, Ren J, Gulve EA, Holloszy JO. Additive effect of contractions and insulin on GLUT-4 translocation into the sarcolemma. J Appl Physiol 77: 1597–1601, 1994. [DOI] [PubMed] [Google Scholar]
- 20.Geiger PC, Han DH, Wright DC, Holloszy JO. How muscle insulin sensitivity is regulated: testing of a hypothesis. Am J Physiol Endocrinol Metab 291: E1258–E1263, 2006. [DOI] [PubMed] [Google Scholar]
- 21.Goodpaster BH, Bertoldo A, Ng JM, Azuma K, Pencek RR, Kelley C, Price JC, Cobelli C, Kelley DE. Interactions among glucose delivery, transport, and phosphorylation that underlie skeletal muscle insulin resistance in obesity and type 2 Diabetes: studies with dynamic PET imaging. Diabetes 63: 1058–1068, 2014. [DOI] [PMC free article] [PubMed] [Google Scholar]
- 22.Hamada T, Arias EB, Cartee GD. Increased submaximal insulin-stimulated glucose uptake in mouse skeletal muscle after treadmill exercise. J Appl Physiol 101: 1368–1376, 2006. [DOI] [PubMed] [Google Scholar]
- 23.Hamalainen N, Pette D. Patterns of myosin isoforms in mammalian skeletal muscle fibres. Microsc Res Tech 30: 381–389, 1995. [DOI] [PubMed] [Google Scholar]
- 24.Hansen PA, Nolte LA, Chen MM, Holloszy JO. Increased GLUT-4 translocation mediates enhanced insulin sensitivity of muscle glucose transport after exercise. J Appl Physiol 85: 1218–1222, 1998. [DOI] [PubMed] [Google Scholar]
- 25.Henriksen EJ, Bourey RE, Rodnick KJ, Koranyi L, Permutt MA, Holloszy JO. Glucose transporter protein content and glucose transport capacity in rat skeletal muscles. Am J Physiol Endocrinol Metab 259: E593–E598, 1990. [DOI] [PubMed] [Google Scholar]
- 26.Jensen J, Rustad PI, Kolnes AJ, Lai YC. The role of skeletal muscle glycogen breakdown for regulation of insulin sensitivity by exercise. Front Physiol 2: 112, 2011. [DOI] [PMC free article] [PubMed] [Google Scholar]
- 27.Jensen TE, Richter EA. Regulation of glucose and glycogen metabolism during and after exercise. J Physiol 590: 1069–1076, 2012. [DOI] [PMC free article] [PubMed] [Google Scholar]
- 28.Karlsson HK, Zierath JR. Insulin signaling and glucose transport in insulin resistant human skeletal muscle. Cell Biochem Biophys 48: 103–113, 2007. [DOI] [PubMed] [Google Scholar]
- 29.Kim J, Solis RS, Arias EB, Cartee GD. Postcontraction insulin sensitivity: relationship with contraction protocol, glycogen concentration, and 5′ AMP-activated protein kinase phosphorylation. J Appl Physiol 96: 575–583, 2004. [DOI] [PubMed] [Google Scholar]
- 30.Kjobsted R, Treebak JT, Fentz J, Lantier L, Viollet B, Birk JB, Schjerling P, Björnholm M, Zierath JR, Wojtaszewski JF. Prior AICAR stimulation increases insulin sensitivity in mouse skeletal muscle in an AMPK-dependent manner. Diabetes 64: 2042–2055, 2015. [DOI] [PubMed] [Google Scholar]
- 31.Lauritzen HP, Galbo H, Toyoda T, Goodyear LJ. Kinetics of contraction-induced GLUT4 translocation in skeletal muscle fibers from living mice. Diabetes 59: 2134–2144, 2010. [DOI] [PMC free article] [PubMed] [Google Scholar]
- 32.Mackrell JG, Arias EB, Cartee GD. Fiber type-specific differences in glucose uptake by single fibers from skeletal muscles of 9- and 25-month-old rats. J Gerontol A Biol Sci Med Sci 67: 1286–1294, 2012. [DOI] [PMC free article] [PubMed] [Google Scholar]
- 33.Mackrell JG, Cartee GD. A novel method to measure glucose uptake and myosin heavy chain isoform expression of single fibers from rat skeletal muscle. Diabetes 61: 995–1003, 2012. [DOI] [PMC free article] [PubMed] [Google Scholar]
- 34.Oakes ND, Bell KS, Furler SM, Camilleri S, Saha AK, Ruderman NB, Chisholm DJ, Kraegen EW. Diet-induced muscle insulin resistance in rats is ameliorated by acute dietary lipid withdrawal or a single bout of exercise: parallel relationship between insulin stimulation of glucose uptake and suppression of long-chain fatty acyl-CoA. Diabetes 46: 2022–2028, 1997. [DOI] [PubMed] [Google Scholar]
- 35.Pandorf CE, Caiozzo VJ, Haddad F, Baldwin KM. A rationale for SDS-PAGE of MHC isoforms as a gold standard for determining contractile phenotype. J Appl Physiol 108: 222–222; author reply 226, 2010. [DOI] [PubMed] [Google Scholar]
- 36.Pehmøller C, Brandt N, Birk JB, Høeg LD, Sjøberg KA, Goodyear LJ, Kiens B, Richter EA, Wojtaszewski JF. Exercise alleviates lipid-induced insulin resistance in human skeletal muscle-signaling interaction at the level of TBC1 domain family member 4. Diabetes 61: 2743–2752, 2012. [DOI] [PMC free article] [PubMed] [Google Scholar]
- 37.Richter EA, Garetto LP, Goodman MN, Ruderman NB. Muscle glucose metabolism following exercise in the rat: increased sensitivity to insulin. J Clin Invest 69: 785–793, 1982. [DOI] [PMC free article] [PubMed] [Google Scholar]
- 38.Richter EA, Garetto LP, Goodman MN, Ruderman NB. Enhanced muscle glucose metabolism after exercise: modulation by local factors. Am J Physiol Endocrinol Metab 246: E476–E482, 1984. [DOI] [PubMed] [Google Scholar]
- 39.Richter EA, Hargreaves M. Exercise, GLUT4, and skeletal muscle glucose uptake. Physiol Rev 93: 993–1017, 2013. [DOI] [PubMed] [Google Scholar]
- 40.Samuel VT, Petersen KF, Shulman GI. Lipid-induced insulin resistance: unravelling the mechanism. Lancet 375: 2267–2277, 2010. [DOI] [PMC free article] [PubMed] [Google Scholar]
- 41.Schweitzer GG, Arias EB, Cartee GD. Sustained postexercise increases in AS160 Thr642 and Ser588 phosphorylation in skeletal muscle without sustained increases in kinase phosphorylation. J Appl Physiol 113: 1852–1861, 2012. [DOI] [PMC free article] [PubMed] [Google Scholar]
- 42.Schweitzer GG, Castorena CM, Hamada T, Funai K, Arias EB, Cartee GD. The B2 receptor of bradykinin is not essential for the post-exercise increase in glucose uptake by insulin-stimulated mouse skeletal muscle. Physiol Res 60: 511–519, 2011. [DOI] [PMC free article] [PubMed] [Google Scholar]
- 43.Treebak JT, Frøsig C, Pehmøller C, Chen S, Maarbjerg SJ, Brandt N, MacKintosh C, Zierath JR, Hardie DG, Kiens B, Richter EA, Pilegaard H, Wojtaszewski JF. Potential role of TBC1D4 in enhanced post-exercise insulin action in human skeletal muscle. Diabetologia 52: 891–900, 2009. [DOI] [PMC free article] [PubMed] [Google Scholar]
- 44.Wallberg-Henriksson H. Glucose transport into skeletal muscle. Influence of contractile activity, insulin, catecholamines and diabetes mellitus. Acta Physiol Scand Suppl 564: 1–80, 1987. [PubMed] [Google Scholar]
- 45.Wallberg-Henriksson H, Constable SH, Young DA, Holloszy JO. Glucose transport into rat skeletal muscle: interaction between exercise and insulin. J Appl Physiol 65: 909–913, 1988. [DOI] [PubMed] [Google Scholar]
- 46.Wojtaszewski JF, Hansen BF, Gade, Kiens B, Markuns JF, Goodyear LJ, Richter EA. Insulin signaling and insulin sensitivity after exercise in human skeletal muscle. Diabetes 49: 325–331, 2000. [DOI] [PubMed] [Google Scholar]
- 47.Zierath JR, Hawley JA. Skeletal muscle fiber type: influence on contractile and metabolic properties. PLoS Biol 2: e348, 2004. [DOI] [PMC free article] [PubMed] [Google Scholar]