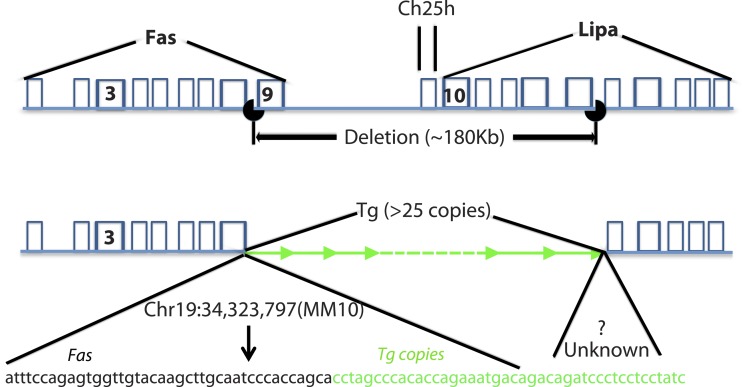
We provide an explanation for striking pathology found in a subset of genetically engineered mice homozygous for a rat CaVβ2a transgene (Tg+/+). Multiple transgene (Tg) copies inserted into chromosome 19; at this same site a large deletion occurred, ablating cholesterol 25-hydroxylase and partially deleting lysosomal acid lipase and CD95. Their loss of function can account for lipid build up and immune system hypertrophy, which defines this phenotype and serendipitously provides a novel model of lysosomal storage disorder.
Keywords: CACNB2, lincRNA, lysosomal storage disorders, miRNA, TNF Receptor Superfamily Member 6
Abstract
Knockout technology has proven useful for delineating functional roles of specific genes. Here we describe and provide an explanation for striking pathology that occurs in a subset of genetically engineered mice expressing a rat CaVβ2a transgene under control of the cardiac α-myosin heavy chain promoter. Lesions were limited to mice homozygous for transgene and independent of native Cacnb2 genomic copy number. Gross findings included an atrophied pancreas; decreased adipose tissue; thickened, orange intestines; and enlarged liver, spleen, and abdominal lymph nodes. Immune cell infiltration and cell engulfment by macrophages were associated with loss of pancreatic acinar cells. Foamy macrophages diffusely infiltrated the small intestine's lamina propria, while similar macrophage aggregates packed liver and splenic red pulp sinusoids. Periodic acid-Schiff-positive, diastase-resistant, iron-negative, Oil Red O-positive, and autofluorescent cytoplasm was indicative of a lipid storage disorder. Electron microscopic analysis revealed liver sinusoids distended by clusters of macrophages containing intracellular myelin “swirls” and hepatocytes with enlarged lysosomes. Additionally, build up of cholesterol, cholesterol esters, and triglycerides, along with changes in liver metabolic enzyme levels, were consistent with a lipid processing defect. Because of this complex pathology, we examined the transgene insertion site. Multiple transgene copies inserted into chromosome 19; at this same site, an approximate 180,000 base pair deletion occurred, ablating cholesterol 25-hydroxylase and partially deleting lysosomal acid lipase and CD95. Loss of gene function can account for the altered lipid processing, along with hypertrophy of the immune system, which define this phenotype, and serendipitously provides a novel mouse model of lysosomal storage disorder.
NEW & NOTEWORTHY
We provide an explanation for striking pathology found in a subset of genetically engineered mice homozygous for a rat CaVβ2a transgene (Tg+/+). Multiple transgene (Tg) copies inserted into chromosome 19; at this same site a large deletion occurred, ablating cholesterol 25-hydroxylase and partially deleting lysosomal acid lipase and CD95. Their loss of function can account for lipid build up and immune system hypertrophy, which defines this phenotype and serendipitously provides a novel model of lysosomal storage disorder.
many different cell types in a wide variety of tissues express L-type voltage-gated Ca2+ channels (L-VGCCs), where they participate in immune responses, activity-dependent gene induction, excitation-contraction coupling, and excitation-secretion coupling (8, 9, 33, 42). The accessory β-subunit, CaVβ2 (β2), couples to L-VGCCs, including CaV1.2, CaV1.3, and CaV1.4 in cardiac, endocrine, photoreceptor, and inner hair cells, where it serves important roles in tissue development (3, 45) and/or L-VGCC function (10, 33). β2 is extensively spliced with at least six functional variants (41).
The developmental and functional importance of the different β2 splice variants remains incompletely understood. Knockout of Cacnb2 (Cacnb2−/−) in mice is embryonic lethal very early in development (embryonic days 7–8) due to a failure in heart formation (3, 45). Therefore, transgenic approaches have resulted in selective expression of β2 in the heart either using a Cre-lox strategy, or by inserting back into the genome a rat palmitoylated β2a splice variant as a Tg, driven by the cardiac α-myosin heavy chain (Myh6) promoter to rescue developing Cacnb2−/− mice (3, 28). Using the Cacnb2−/−/Tg mouse model, we have documented the importance of β2 in development of the outer plexiform layer of the retina and synaptic transmission onto the inner retina (3), as well as in development of inner hair cells and exocytosis from them (33). Given these results, we were interested in examining the functional role of β2 in other tissues using the Cacnb2−/−/Tg mouse. Mouse colonies were established at three medical centers. However, as each colony expanded, a percentage of the mice presented with a similar disorder, superficially characterized by a rounded posture, paddling gate, diminished size, and a distended abdomen, which appeared “bloated.”
We, therefore, undertook this study to determine the underlying cause of the pathology by searching for correlations between genotype and the bloated phenotype. We found a consistent and striking profile. Lesions were limited to mice homozygous for the Tg (Tg+/+) and were independent of the presence or absence of native Cacnb2 copy number. Changes were identified at the gross, cellular, ultrastructural, and biochemical levels in various abdominal organs, consistent with a lysosomal storage disorder similar to Wolman disease (WD) or cholesterol ester storage disease (CESD) (28, 31). Lastly, we sought to determine the underlying source of the pathology and found that the Tg insertion resulted in deletion of a segment of chromosome 19. Notably, the lysosomal acid lipase (Lipa) and CD95, also called TNF Receptor Superfamily Member 6 or Fas, genes were partially deleted. Additionally, the sequence encoding cholesterol 25-hydroylase (Ch25h) and three RNA genes of unknown function were deleted. Decreased LIPA activity and a dramatic build up of cholesterol esters in the liver of bloated mice were consistent with the genomic deletion profile. Our findings document the underlying cause of the bloated phenotype and raise the possibility that the Tg+/+ mice have the potential to serve as a model for studying lysosomal storage disorders, as well as novel nonalcoholic fatty liver diseases.
MATERIALS AND METHODS
Three mouse colonies (University of Arkansas Medical Center, University of Louisville School of Medicine, and University of Massachusetts Medical School) were expanded from animals heterozygous for the VGCC β2-subunit (Cacnb2tm1Rgg) and for the Tg (Myh6-Cacnb2)1Rgg transgene, a T7-tagged β2a splice variant controlled by the cardiac Myh6 promoter for cardiac-specific expression (3, 22). These animals are referred to as Cacnb2+/− and Tg+/−, respectively. Mice were euthanized via decapitation, decerebration, or overdose of CO2, as outlined in each University's animal use protocol. All protocols were submitted to, and approved by, an institutional review board committee, as designated by each university and sanctioned by the National Institutes of Health. Complete gross examination was conducted for each mouse before tissue processing.
PCR for Cacnb2 WT and knockout alleles.
Mouse genotypes were determined by PCR of DNA extracted from ear punches or tail snips of all mice, following the protocol of Ball et al. (3). The following primers were used to detect wild-type: 5′-GGT TCG GCA GAC TCC TAC ACC AGC C-3′ (mB2-11 = P6) and 5′-ACA ATA GCA GGC ATG CTG GGG ATG-3′ (BZERO = P1); knockout: 5′-GGT TCG GCA GAC TCC TAC ACC AGC C (mB2-11) and 5′-CCC AAT TAT GCC CGT GTT AAG CC-3′ (mB2-34); and Tg: ATC GTA AGG AGT GTG CT (rtB2-2) and 5′-TCA TCA TCC AGT TTG GGT GA-3′ (mB2-7). PCR reactions contained the following: 4 μl of 5× Green Go Taq Reaction Buffer (Promega), 1 unit of Go Taq polymerase (Promega), 4 μM of each primer, 4 mM dNTPs, and 1 μl DNA in a final volume of 20 μl. Cycling conditions were determined empirically, but in general were as follows: 30 s at 98°C, followed by 38 cycles of 10 s at 95°C, 10 s at the annealing temperature of 60°C, and 10 s at 72°C, followed by a final incubation for 5 min at 72°C. Amplified samples were analyzed by agarose gel (3%) electrophoresis.
Genotyping for zygosity of the Tg insertion.
To examine whether Tg-positive mice are homozygous or heterozygous, 1 ng of genomic DNA extracted from each mouse was run in a triplicate using a TaqMan assay (assay identification no. Rn00587789_m1; ABI) relative to the endogenous control gene, rps15 (assay identification no. Rn01408642_g1; ABI). If the ΔCT difference between the Tg and rps15 assays was over 2.6, the mouse was determined to be Tg homozygous (Tg+/+), otherwise it was Tg heterozygous (Tg+/−). TaqMan gene expression assays were run on a Real-Time PCR System (7900HT; Applied Biosystems, Life Technologies, Foster City, CA), according to the manufacturer's instructions.
Next-generation sequencing.
Genomic DNA was isolated from Tg+/+ mice. Fifty nanograms were used to prepare a Nextera DNA library (Illumina). Two picomoles of the library were loaded on a NextSeq 500 High Output Kit, and paired end (150 bp) sequencing was performed. The resulting sequence reads were mapped to the mouse genome. On analysis, a junction fragment between the Fas gene and the Tg used to construct the mouse line was identified.
Tissue histology.
Tissue processing using standard methods was provided by the Translational Pathology Shared Resource, University of Arkansas for Medical Sciences, and the Morphology Core Facility, University of Massachusetts Medical School. Briefly, tissues were dissected, positioned in plastic grids, immediately placed in 4% or 10% neutral buffered formalin, processed and embedded into paraffin, sectioned at 4–5 μm, and stained with hematoxylin and eosin (H&E) for standard H&E examination using wide-field microscopy. Other sections (∼10 μm), counterstained with hematoxylin only, were stained with Oil Red O (PolySciences, Bay Shore, NY), following the manufacturer's instructions. Images were captured with NIS Element Microscope Imaging Software using an upright Eclipse 901 (Nikon Metrology, Brighton, MI) or with Axiovert 40 (version 4.6.3.0) software using an Axiovert 200M Inverted microscope (Carl Zeiss, Thornwood, NY). Some serial sections were stained with periodic acid Schiff plus or minus diastase, or Prussian blue. Selected sections were scanned for autofluorescence using a fluorescent slide scanner (AperioFL) at excitation 521-nm wavelength and emission 485-nm wavelength at ×200 magnification.
Immunohistochemistry.
Sections of pancreas were exposed to α-amylase antibodies (1:100, GenWay, San Diego, CA) or insulin (1:250, Dako, Carpinteria, CA), followed by secondary antibodies Alexa 488 or Alexa 594 (1:1,000, Invitrogen) or horseradish peroxidase (DAKO Auto Stainer Plus). Fluorescent images of α-amylase or insulin reactivity were collected using the Eclipse Ti series microscope. Fluorescence was quantitated using Nikon Elements image analysis software.
Transmission electron microscopy.
Samples were processed and analyzed at the University of Arkansas Medical Center and University of Massachusetts Medical School Electron Microscopy core facilities, according to standard procedures. Briefly, liver and pancreas were rapidly removed from mice. Small pieces of each tissue were immediately placed in 2.5% glutaraldehyde in 0.1 M sodium cacodylate buffer (pH 7.2) and left overnight at 4°C. The samples were then rinsed twice in the same fixation buffer and postfixed with 1% osmium tetroxide for 1 h at room temperature. Samples were washed twice with distilled H2O for 5 min and then dehydrated through a graded ethanol series of 20% increments, before two changes in 100% ethanol. Samples were then infiltrated first with two changes of 100% propylene oxide and then with a 50%:50% propylene oxide/SPI-Pon 812 resin mixture. The following day samples were infiltrated with three changes of fresh 100% SPI-Pon 812 resin and then polymerized at 68°C in plastic capsules. Thin sections of ∼70 nm were placed on copper support grids and contrasted with lead citrate and uranyl acetate. Sections were examined using the FEI Tecani 12 BT with 80 KV accelerating voltage, and images were captured using a Gatan transmission electron microscopy charge-coupled device camera.
Liquid chromatography tandem mass spectrometry analysis.
Lipids were extracted from homogenized mouse liver using methyl tert-butyl ether extraction (30). Ten microliters (500 ng) of 1,3(d5)-ditetradecanoyl-2-(9Z-hexadecenoyl)-glycerol was spiked into 250 μl (30.0–117.5 mg wet tissue/ml) of homogenized mouse liver and served as an internal standard. Methanol (1.25 ml) was added, vortexed for 30 s, followed by the addition of 5 ml of methyl tert-butyl ether. The samples were shaken at 1,000 rpm at room temperature for 1 h, and then 1.25 ml of distilled water was added to induce two phases. After incubation at room temperature for 10 min, the samples were centrifuged at 1,000 g for 10 min. The upper phase was collected and dried down under a stream of nitrogen. Total lipid mass of the dried lipid pellet was recorded. Lipid residues were reconstituted in chloroform-methanol (2:1) at a concentration of 10 mg/ml and then diluted with methanol to 1 mg/ml for liquid chromatography-mass spectrometry analysis.
Lipids were analyzed on a Thermo Scientific (Waltham, MA) Accela HPLC system coupled to a Thermo Orbitrap Velos Pro mass spectrometer. A 10-μl aliquot of each sample (1 mg lipid/ml of methanol) was injected at a flow rate of 200 μl/min onto a Waters (Milford, MA) CSH C18 column (2.1 × 150 mm, 1.7 μm) maintained at 40°C. The mobile phase consisted of 10 mM ammonium acetate in water-acetonitrile (40:60) with 0.1% (vol/vol) formic acid (A) and 10 mM ammonium acetate in acetonitrile-isopropanol (10:90) with 0.1% (vol/vol) formic acid (B). Gradient conditions were as follows: 0–5 min, 40–45% B; 5–6 min, 45–55% B; 6–36 min, 55–80% B; 36.1 min, 80–99% B; 36.1–40 min, 99% B; 40.1 min, 99-40% B; 50 min, 40% B. The mass spectrometer was operated in the positive ion electrospray mode with spray voltage set at 4.5 kV. The capillary temperature was set to 350°C, and S-lens radio frequency level was set to 56.3%. Full scan mass spectra were acquired in the Orbitrap mass analyzer with a resolution of 60,000 (mass-to-charge range 300–1,500). Quantitative analysis of cholesterol, cholesterol esters, and triglycerides was conducted in the QualBrowser feature of Xcalibur (Thermo, version 2.2). Peak areas were derived from extracted ion chromatograms corresponding to the [M+NH4]+ of the analytes and the internal standard (14:0–16:1–14:0 TG-d5) for each of the three lipid groups within a mass tolerance of 10 ppm. A single-point calibration was used. The data were processed using 7-point Gaussian smoothing. Technical replicates were averaged for each biological sample. Concentrations of analytes were then normalized to the wet tissue weight.
Lysosomal acid lipase assay.
Liver homogenates were assayed for LIPA activity following the methods of Yan et al. (46). Briefly, liver tissue was homogenized, sonicated, and extracted in NP-40 (Boston Bioproducts) lysis buffer supplemented with 10 mM dithiothreitol (Sigma-Aldrich) and 0.02% sodium azide (Sigma-Aldrich). Homogenates were centrifuged at 10,000 g for 15 min. Supernatant was separated from the pellet and stored at −20°C. Protein content was determined using a BCA assay kit (Pierce, Rockford, IL). Aliquots of homogenate were incubated in a microtiter plate at pH 5.5 in a shaking incubator (37°C), in the presence of a fluorogenic substrate, 4-methylumbelliferyl-oleate (4-MUO; Sigma-Aldrich) where catalytic cleavage of oleate, by Lipa was allowed to progress for 30 min. Following the addition of 0.75 mM Tris stop solution (pH 8.0), free oleate fluorescence was measured and recorded (Gen 5 1.11 software) using an excitation wavelength of 360 nm and an emission wavelength of 460 nm. The values of fluorescent units were compared with a standard curve, made from known concentrations of fluorescing product, 4-methylumbelliferone (4-MU; Sigma-Aldrich), to estimate LIPA activity in each homogenate. All samples were assayed in triplicate. One unit of activity (U) is defined as 1 μmol·l 4-MU−1·min−1. LIPA activity is expressed as mU/mg liver.
Intracellular cytokine staining.
Splenocytes (2 × 10⁵ cells), isolated from healthy and bloated spleens, were seeded in 96-well plates in 0.2 ml of RPMI 1640 (Invitrogen), supplemented with 10% fetal bovine serum (Gibco BRL) and 1× Pen/Strep. Cells were then stimulated with soluble anti-mouse CD3 monoclonal antibody (BD Biosciences). Monensin (BD Biosciences) was added at 1× to block cytokine secretion. After 4 h, the cells were harvested for CD3, CD8, CD4, and CD44 membrane staining. After fixation and permeabilization using the manufacturer's protocol (Fixation Permeabilization buffer; BD Biosciences), intracellular cytokine staining for IL-2, TNF, and interferon (IFN)-γ was performed.
Western blot analysis.
A small piece of frozen liver was dounce-homogenized in lysis buffer (25 mM Tris pH 7.5, 150 mM NaCl, 1 mM EDTA, 1% Triton X-100, 0.1% SDS, 0.5% sodium deoxycholate), supplemented with HALT protease inhibitors (Pierce) and phosphatase inhibitors. Small pieces of pancreas taken from the tail region were homogenized in T-Per (Thermoscientific/Pierce), supplemented with EDTA protease inhibitor cocktail tablet (Roche) and 1:100 protease inhibitor (Sigma-Aldrich). Crude liver and pancreas lysates were rocked end over end for 15 min, followed by centrifugation at 14,000 g for 10 min. Supernatants were assayed for protein concentration, and SDS sample loading buffer was added to bring stock liver samples to 2–5 mg/ml. Additional lysis buffer was added to pancreas supernatants to further dilute stock samples to 1–1.5 mg/ml. Samples (15 or 20 μg protein/lane) were subjected to SDS-PAGE, followed by transferring proteins to nitrocellulose membranes. Blots of liver homogenate were processed for Western blotting and imaged with the LICOR Odyssey Imaging system. The following antibodies were used: mammalian long-chain acyl-CoA synthetase (ACSL1), aldolase A, ATP citrate lyase, acyl-CoA carboxylase (ACC1), beclin-1, fatty acid binding protein (FABP) 4, Grp94, LC3, liver phosphofructokinase (PFKL), pyruvate kinase M2 isoform (PKM2) (Cell Signaling Technology); β-actin and FABP1 (Proteintech); and β-catenin and FAS (BD Biosciences). These antibodies were used at a dilution of 1:1,000, except LC3, which was used at a 1:250 dilution. Blots of pancreas homogenate were processed for Western blotting using chemiluminescence and standard use of film exposure using the following antibodies: α-amylase (1:250; GenWay), trypsinogen (1:1,000; Abcam), and actin (1:1,000, Millipore). Band densities were quantitated using Nikon Elements image analysis software.
Statistics.
Significance between two genetic groups was determined using a two-way t-test for two means. Differences in data were considered statistically significant at P < 0.05 level.
RESULTS
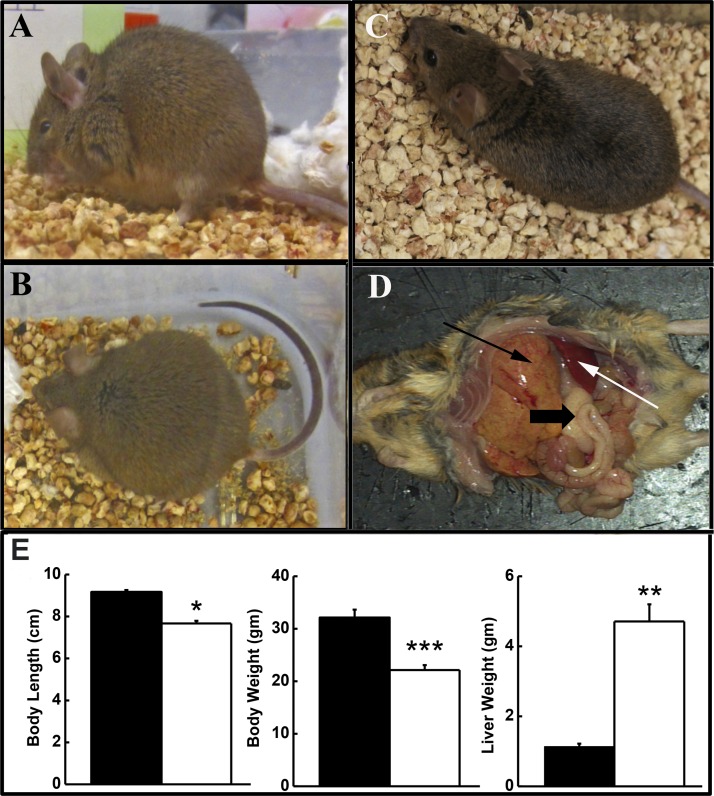
Affected mice from the three university colonies presented with a similar disorder, superficially characterized by a distended abdomen (Fig. 1A), rounded posture (Fig. 1B), and a slow, paddling gate. Figure 1C shows a healthy mouse for comparison. A dramatically enlarged, yellow-orange liver highlighted the gross changes in abdominal organs (Fig. 1D). Liver weights of “bloated” animals were 4.13-fold greater than those of healthy animals (Fig. 1E) and had a dry, rubbery consistency. Body length and weight were significantly decreased in the afflicted vs. healthy mice, despite the enlarged liver (Fig. 1E). Thickened, orange intestines, enlarged spleen and abdominal lymph nodes, an atrophied pancreas, and decreased abdominal fat were also observed.
Fig. 1.
Profile of bloated mice. Affected mice develop abdominal distention (bloated; A), a rounded posture (B), and stunted growth compared with healthy littermates (C). D: gross findings include enlarged, yellow-orange liver with prominent granular pattern (thin black arrow) filled with lipid, thickened, orange intestines also with a prominent granular pattern (thick black arrow), enlarged spleen (white arrow) and lymph nodes, atrophied pancreas, and decreased adipose tissue, including the absence of an abdominal fat pad. E: body length and weight as well as liver weight were significantly different in bloated animals (open bars) from healthy mice (solid bars). Values are means ± SE; n = 10–20/group. *P ≤ 0.05. **P ≤ 0.01. ***P ≤ 0.001. Liver weight as percent of body weight was 18–26% in affected animals.
Genotypes of healthy and bloated mice were compared. We found that the bloated phenotype occurred independently of a mouse's cognate Cacnb2 genotype, since a percentage of Cacnb2+/+, Cacnb2+/−, and Cacnb2−/− mice were bloated (Table 1). Instead, all bloated mice were positive for at least one copy of the Tg; however, many healthy animals also tested positive for Tg. Since initial PCR conditions could not distinguish between Tg+/− and Tg+/+ genotypes, quantitative genotyping of mice was performed using quantitative PCR to determine whether bloated mice might have a different Tg copy number than healthy mice. Of the bloated mice genotyped, 100% (n = 14) were homozygous for the Tg (Tg+/+) compared with 0% of healthy (n = 21) mice (Table 1); healthy mice carried zero or one Tg allele. The male-to-female ratio of bloated mice approached 50:50 (Table 2). The simplest interpretation of these results is that all mice homozygous for Tg (Tg+/+) developed the bloated phenotype, regardless of either sex or cognate Cacnb2 copy number.
Table 1.
Mice homozygous for transgene (Tg+/+) exhibit the bloated phenotype
| Genotype | Total No. Mice | No. Bloated | %Bloated |
|---|---|---|---|
| Cacnb2+/+/Tg−/− | 10 | 0 | 0 |
| Cacnb2+/+/Tg+/− | 1 | 0 | 0 |
| Cacnb2+/+/Tg+/+ | 5 | 5 | 100 |
| Cacnb2−/−/Tg+/− | 4 | 0 | 0 |
| Cacnb2−/−/Tg+/+ | 4 | 4 | 100 |
| Cacnb2+/−/Tg+/− | 6 | 0 | 0 |
| Cacnb2+/−/Tg+/+ | 5 | 5 | 100 |
Mice from the UMMS colony were genotyped for transgene copy number. Quantitative PCR for DNA revealed that lesions were limited to mice bearing two copies of the transgene and were independent of native Cacnb2 genomic copy number.
Table 2.
Sex distribution of the bloated phenotype
| Cacnb2+/+ | Cacnb2−/− | Cacnb2+/− | Total | |
|---|---|---|---|---|
| Male/female | 6/9 | 14/13 | 9/8 | 29/30 |
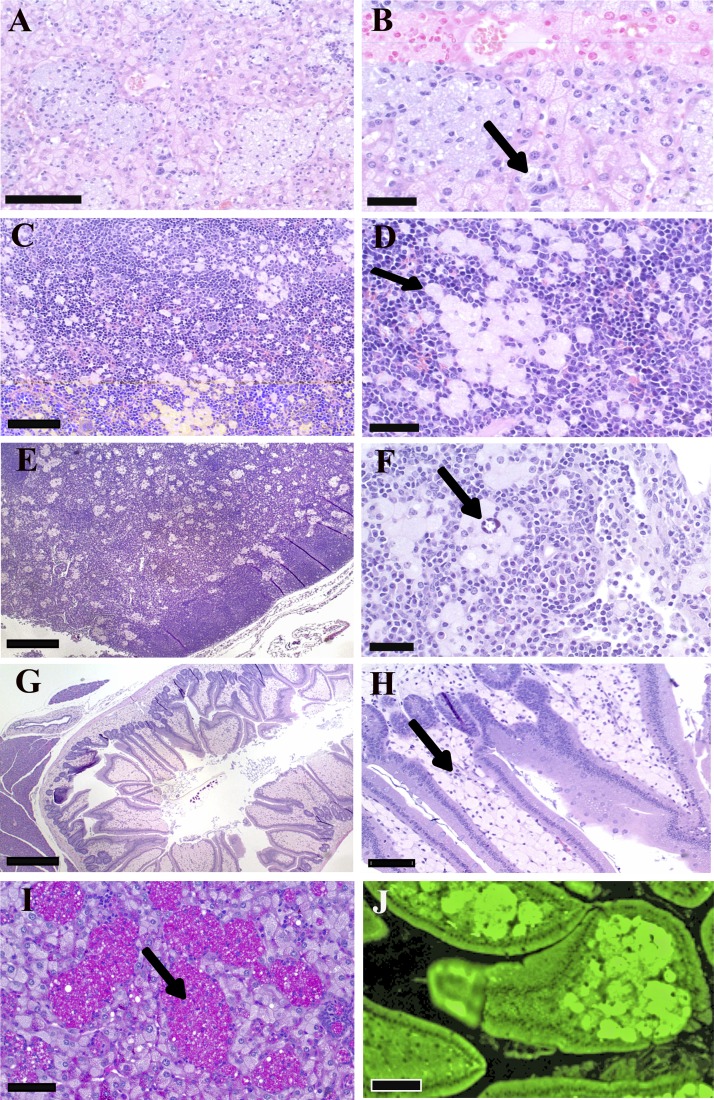
Histologically, bloated mice had sinusoids (discontinuous capillaries) in liver (Fig. 2, A and B), spleen (Fig. 2, C and D), and lymph nodes (Fig. 2, E and F) distended by clusters of large, occasionally multinucleated macrophages containing abundant amphophilic, foamy cytoplasmic material with occasional small clefts, suggestive of cholesterol crystals (Fig. 2F). Hepatocytes also appeared to have foamy material in the cytoplasm (Figs. 2B and 3C, blue arrow). Foamy material observed in macrophages is usually the result of lipid uptake, often cholesterol esters (see Ref. 17). Macrophage aggregates also were present in bone marrow (data not shown), while the lamina propria of the small intestine was diffusely infiltrated by sheets of similar macrophages (Fig. 2, G and H). Subsequent staining of tissue sections revealed that cytoplasmic material was periodic acid Schiff positive, diastase resistant, iron negative (Fig. 2I), and strongly autofluorescent (Fig. 2J), a profile suggestive of a lysosomal storage disorder for lipid processing.
Fig. 2.
Hemoxylin and eosin (H&E) histology of storage cells found in bloated mice. A and B: liver. Storage cells in sinusoids contain amphophilic, amorphous to foamy storage material (arrow). C and D: spleen. Foam cells in red pulp contain lightly amphophilic material (arrow). E and F: lymph node. Aggregates of foam cells are present throughout the medulla. Foam cells in liver and lymph node contain cytoplasmic clefts, suggestive of cholesterol crystals (arrow). G and H: duodenum. The lamina propria is markedly distended with storage cells (arrow). I: storage material contained in the macrophage clusters (arrow) in the liver is periodic acid-Schiff (PAS) positive, diastase resistant. J: cells in lamina propria are strongly autofluorescent. Scale bar = 100 μm (A, C, and F), 50 μm (B, D, H, I, and J), and 200 μm (E and G).
Fig. 3.
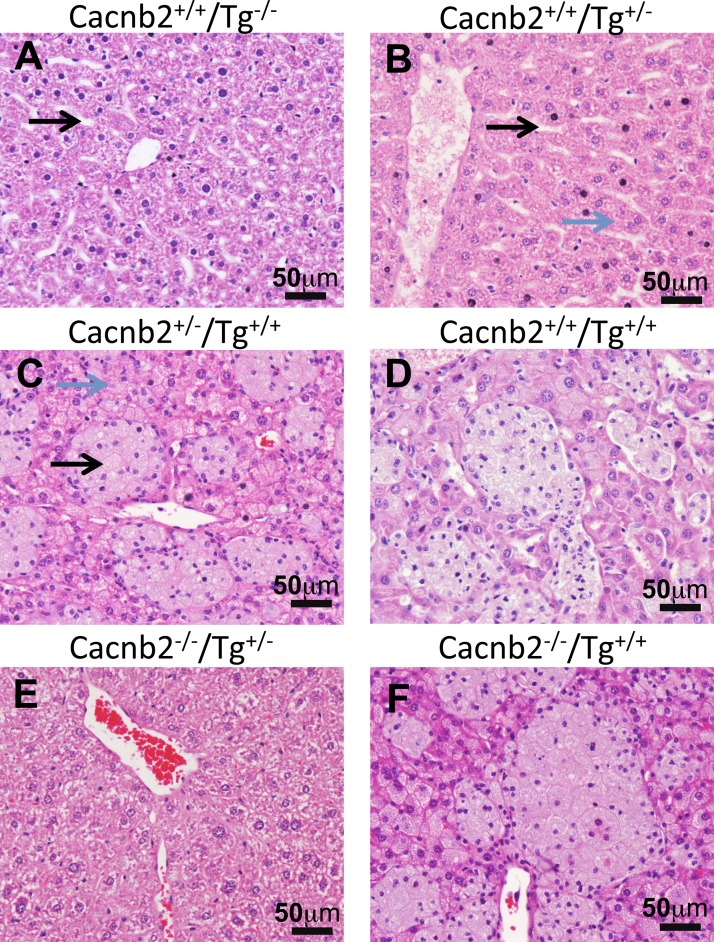
Liver histology from mice with different phenotypes. Pathology of bloated mice is independent of Cacnb2 genotype, but correlates with transgene (Tg) genotype; only Tg+/+ mice exhibit enlarged liver sinusoids filled with immune cells. Cacnb2+/+ mice with zero Tg (Tg−/−; A) or heterogeneous for Tg (Tg+/−; B) have healthy livers with long slender sinusoids (black arrows) that travel through the hepatocytes (blue arrow). In contrast, Cacnb2+/− mice (C) or Cacnb2+/+ mice (D) homozygous for Tg (Tg+/+) have distended liver sinusoids (black arrow) filled with large, occasionally multinucleated macrophages containing abundant amphophilic, foamy cytoplasmic material. Hepatocytes also contained foamy material (blue arrow). Cacnb2−/−/Tg+/− mice (E) have normal liver histology, whereas Cacnb2−/−/Tg+/+mice (F) exhibit liver pathology similar to other Tg+/+ mice (C and D).
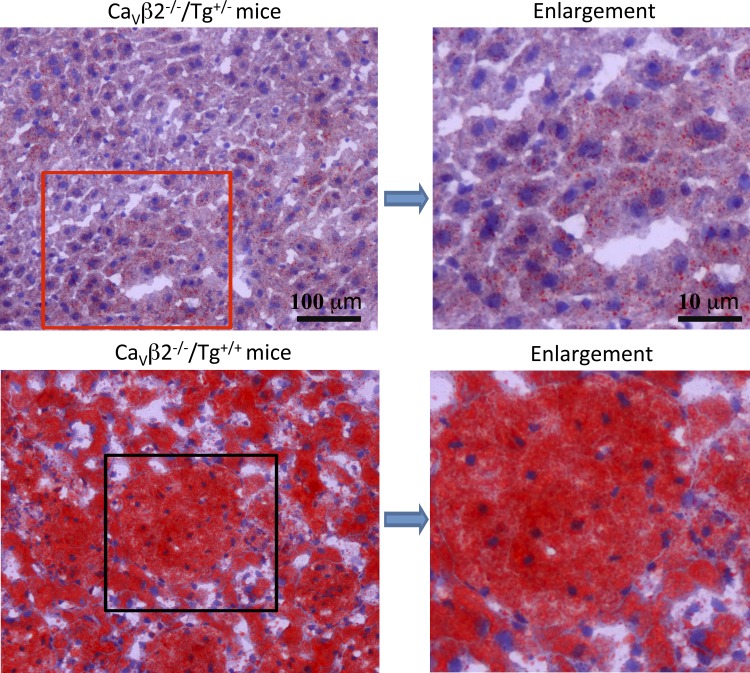
The sinusoidal distension by foamy macrophages was most extreme in the liver from Tg+/+ mice. Figure 3 shows examples of H&E staining of liver from six different genotypes. The H&E examples shown in Fig. 3, A, B, and E, illustrate that, when mice have zero or one copy of Tg, e.g., Tg−/− and Tg+/−, mice exhibit a similar, normal liver phenotype histologically, independent of Cacnb2 copy number, whereas the examples shown in Fig. 3, C, D, and F, illustrate the same profile of enlarged liver sinusoids filled with immune cells of Tg+/+ mice, irrespective of their native Cacnb2 genotype. The H&E histological findings are consistent with Oil Red O staining of neutral triglycerides and lipids (Fig. 4), which revealed the presence of excess lipid in both macrophages and hepatocytes of bloated mice (Fig. 4, bottom) compared with healthy livers (Fig. 4, top, n = 3 livers/group).
Fig. 4.
Oil Red O staining of mouse liver. Paraffin sections of liver from healthy (top) and bloated (bottom) mice are shown. Bloated mice show intense red staining over both the macrophage-filled sinusoids and hepatocytes.
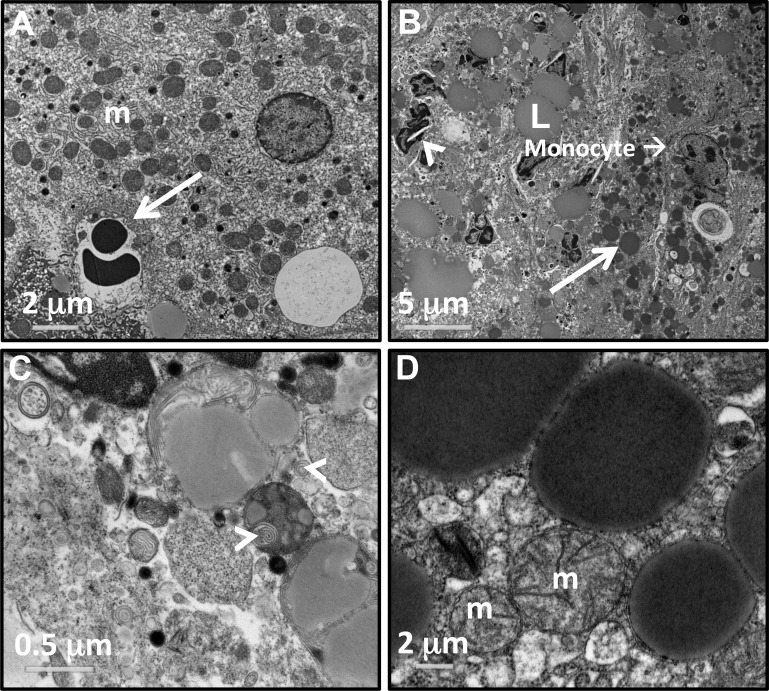
Inspection of liver ultrastructure using transmission electron microscopy revealed dramatic differences between Cacnb2+/+/Tg+/− and Cacnb2+/+/Tg+/+ genotypes. In healthy livers, lipid drops were rarely observed (Fig. 5A). In contrast, large lipid droplets (L) were widely distributed and concentrated in both immune cells and hepatocytes of Tg+/+ livers (Fig. 5B). These cells also contained many more lysosomes (white arrow in Fig. 5B) than observed in healthy livers, as well as crystal precipitates (arrowhead in Fig. 5B) reminiscent of cholesterol crystals observed in fatty liver disease (23) and WD (7). The enlarged sinusoids were packed with immune cells and cellular debris. Some immune cells contained vacuole-like structures filled with myelin-like “whirls” of membrane (Fig. 5C, white arrowheads). In contrast, mitochondria appeared undisturbed in Cacnb2+/+/Tg+/+ liver (Fig. 5D).
Fig. 5.
Electron micrographs show ultrastructural details of the bloated liver pathology. A: healthy hepatocytes with many mitochondria (m). White arrow marks a sinusoid containing 2 red blood cells. B and C: images of cells and debris in a liver sinusoid from a bloated animal. B: sinusoids are filled with debris and immune cells. Lipid droplets (L) overlay macrophages. White arrow marks an enlarged lysosome in a hepatocyte located at the edge of the sinusoid. White arrowhead marks a lipid crystal structure consistent with cholesterol build up. C: example of distended sinusoids contain myelin-like structures (white arrowheads). D: hepatocytes from bloated liver have normal mitochondria (m).
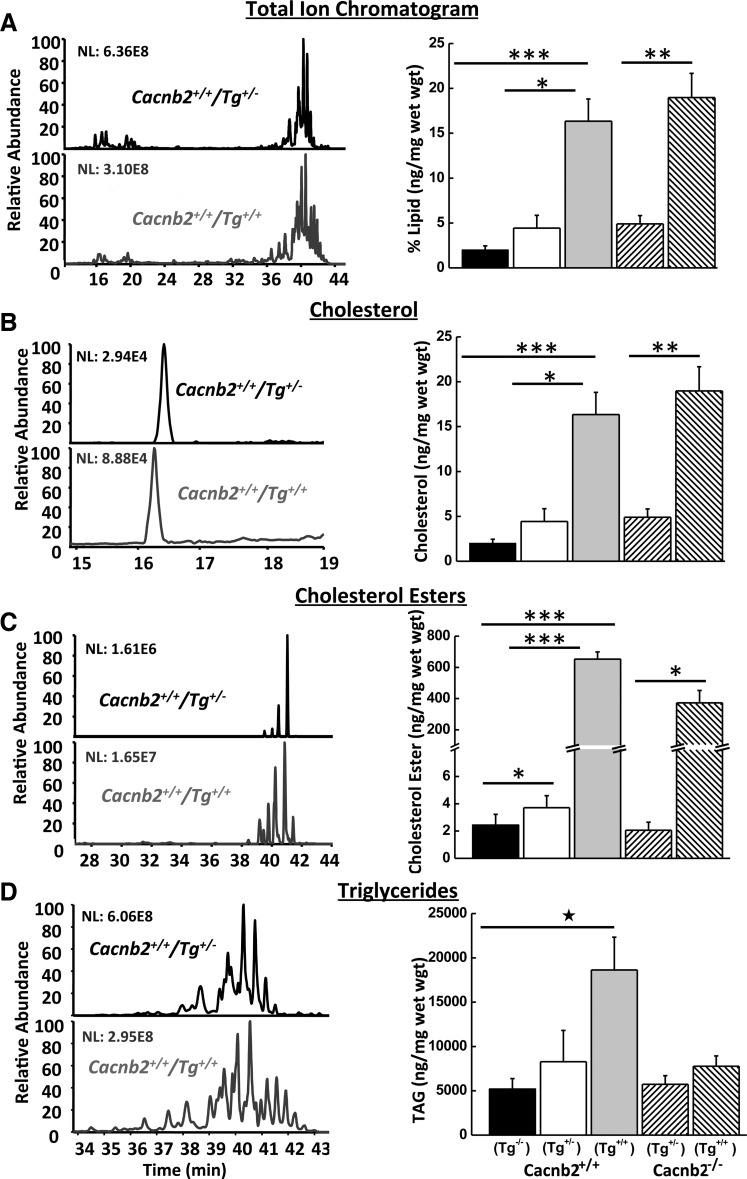
The fatty nature of the bloated liver's gross appearance, histological profile, and ultrastructural changes all indicated a build up of lipid. Taken together, the data show a profile of pathology that shares a striking resemblance to WD (12, 31) and CESD (7). In these disorders, excess material is stored within foamy cells and mutations in lysosomal acid lipase (LIPA) result in build up of cholesterol esters and triglycerides in the liver (12, 13, 15, 16). To test for a similar change in bloated mice, lipids were extracted from livers of different genotypes and assayed for changes in content by mass spectrometry (Fig. 6A). Consistent with disruption of lipid metabolism, the affected Cacnb2+/+/Tg+/+ livers contained 16% lipid/g liver compared with healthy Cacnb2+/+/Tg−/− animals with 2% lipid/g liver (n = 3/group; Fig. 6A).
Fig. 6.
Mass spectroscopy analysis of 10 mg of total liver lipid from mice with different genotypes. Left: example chromatographs of lipid extracted from a bloated Cacnb2+/+/Tg+/+ (gray bottom traces) mouse (#197L) and a healthy Cacnb2+/+/Tg+/− (black top traces) litter mate (#197R); chromatograms are displayed as 100% of the most abundant peak. NL, normalized intensity level. Right: summary bar graphs of lipid content per milligram liver weight for the different genotypes: total lipid (A), cholesterol (B), cholesterol esters (C), and triglycerides (D). Values are means ± SE; n = 3/group. *P ≤ 0.05. **P ≤ 0.01. ***P ≤ 0.005.
As predicted, Cacnb2+/+/Tg+/+ livers exhibited dramatic changes in cholesterol metabolism. Both cholesterol and cholesterol ester content were increased by 6.86-fold (Fig. 6B) and 267-fold (Fig. 6C), respectively, in Cacnb2+/+/Tg+/+ livers compared with Cacnb2+/+/Tg−/− livers. Cacnb2+/+/Tg+/− livers also exhibited a much smaller but nevertheless significant increase of 1.52-fold in cholesterol ester compared with Cacnb2+/+/Tg−/− livers, despite their normal appearance. Cholesterol ester levels in Cacnb2−/−/Tg+/− livers were not significantly different from wild-type (P ≥ 0.05 compared with either Cacnb2+/+/Tg−/− or Cacnb2+/+/Tg+/− livers), indicating loss of both copies of Cacnb2 had no effect on lipid processing. In contrast, Cacnb2−/−/Tg+/+ cholesterol ester levels increased 181-fold compared with Cacnb2−/−/Tg+/− liver levels. Similar to cholesterol ester metabolism, Cacnb2+/+/Tg+/+ livers had significantly (P < 0.05) elevated triglyceride levels compared with Cacnb2+/+/Tg−/− livers (Fig. 6D), with an average increase of 3.5-fold (n = 3/group). In contrast, Cacnb2−/−/Tg+/+ livers had a more modest increase in triglycerides compared with Cacnb2−/−/Tg+/− control livers of 36%. Despite the dramatic increase in cholesterol esters in the Tg+/+ livers, no fatty acid preference was found with disrupted cholesterol ester metabolism (data not shown). Moreover, all cholesterol ester species trended similarly, regardless of their relative abundance, consistent with a single enzyme responsible for cholesterol ester processing in the liver. It is worth noting that the composition of mouse chow would affect the composition of the relative abundance of various cholesterol ester species, due to different fatty acid content in different brands, but not the trending. Thus the dramatic increases in cholesterol and cholesterol ester content of livers occurred specifically in mice with the Tg+/+ genotype, consistent with disruption of LIPA activity.
To test whether LIPA activity was altered in bloated mice, we performed an in vitro assay (46) to measure LIPA activity in liver homogenates from Cacnb2+/+/Tg+/+ and Cacnb2+/+/Tg−/− mice. Homogenates were incubated with the LIPA substrate, 4-MUO, for 30 min under conditions that optimized a linear rate of 4-MUO cleavage to give rise to 4-MU, which autofluoresces at a basic pH. On average, 22.1 ± 1.85 mU/mg liver were produced from normal liver (Cacnb2+/+/Tg−/−) homogenates. Activity decreased significantly by 30.6% (P < 0.04, two-way t-test for 2 means) in bloated liver (Cacnb2+/+/Tg+/+) homogenates (n = 6/group, data not shown). Thus the lowered LIPA activity in bloated mice may contribute to the dramatic build up of cholesterol esters and triglycerides in the Tg+/+ livers.
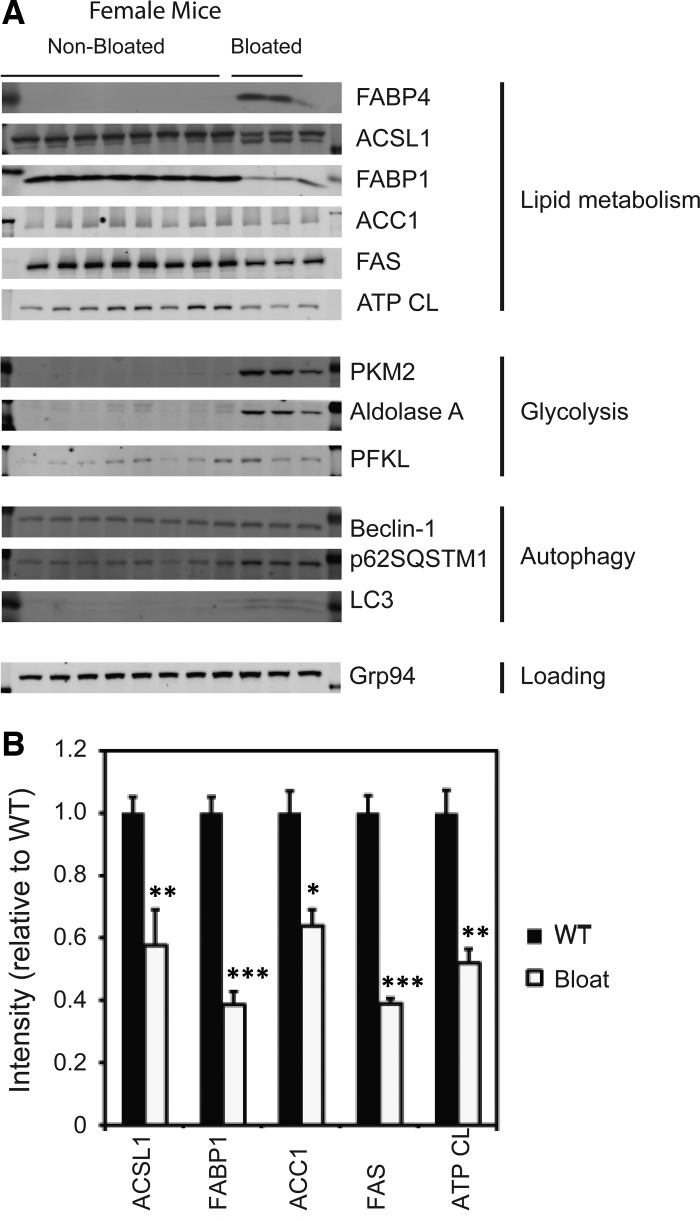
To further assess changes in liver metabolism, we tested for additional changes in levels of metabolic enzymes in bloated vs. healthy mice by Western blot analysis. Both male and female mice were examined. Ponceau staining of membranes revealed notable, reproducible changes in protein banding between healthy and enlarged livers, and, therefore, the blot was probed for changes in specific proteins. The enlarged livers from bloated mice exhibited dramatic changes in certain structural proteins compared with healthy mice (Fig. 7). Specifically, actin levels increased in the affected livers, possibly due to the massive structural changes and to immune infiltration; however, Grp94, β-catenin, and heat shock protein 90 levels did not change and thus could serve as loading controls (data not shown).
Fig. 7.
Western blot analysis of liver samples. A: Western blot analysis of 8 healthy and 3 fatty female liver samples show large changes in metabolic enzyme levels in Tg+/+ animals compared with healthy mice. B: quantitation of changes in protein levels involved in lipid metabolism in bloated mice were significantly different. Values are means ± SE. *P < 0.05, **P < 0.005, and ***P < 0.0005 compared with nonbloated mice (n = 6). Abbreviations of enzymes probed: ACC1, acetyl-CoA carboxylase (catalyzes the production of malonyl-CoA); ACSL1, acyl CoA synthetase 1, also known as long-chain fatty acid CoA ligase 1 (converts long-chain fatty acids into fatty acyl CoA esters); ATP CL, ATP citrate lyase; beclin-1, ATG6 autophagy related gene; FABP1, fatty acid binding protein 1 (normally found in liver); FABP4, fatty acid binding protein 4 also known as aP2 (adipocyte protein 2; normally found in adipocyte tissue of obese mice); FAS, fatty acid synthase; Hsp90, heat shock protein 90 (aids in protein degradation and serves as a chaperone protein for proper protein folding); LC3-I and LC3-II (ATG8-II; autophagy-related genes); PFKL, liver phosphofructokinase; PKM1, isoenzyme of pyruvate kinase.
Probing the blots for differences in liver lipid and carbohydrate metabolism in bloated vs. healthy mice revealed additional changes. Three female (Fig. 7) and four male (data not shown) affected livers exhibited abnormal, increased expression of FABP4/aP2, a fat-specific enzyme found in adipose cells and macrophages but usually not expressed in liver under normal conditions. Immune cells in the sinusoids may account for its increase, since FABP4 RNA has been detected in both monocytes and macrophages (25, 38). In contrast, the liver-specific isoform FABP1 was dramatically decreased in affected livers, possibly a reflection of negative feedback or the decreased percentage of the tissue composed of hepatocytes relative to macrophages in affected livers. Additionally, acyl-CoA synthetase long-chain family member 1, an enzyme involved in long-chain fatty acid metabolism, ACC1, ATP citrate lyase, and fatty acid synthase (FAS) decreased, possibly due to negative feedback by the accumulated lipid (39, 40). We also observed an accumulation of LC3 and the autophagy substrate p62SQSTM1, consistent with a lysosomal storage defect. Lastly, we observed an increase in the levels of certain glycolytic enzymes, namely PKM2 and aldolase A, which may correlate with increased liver growth (as opposed to just distention due to fat accumulation).
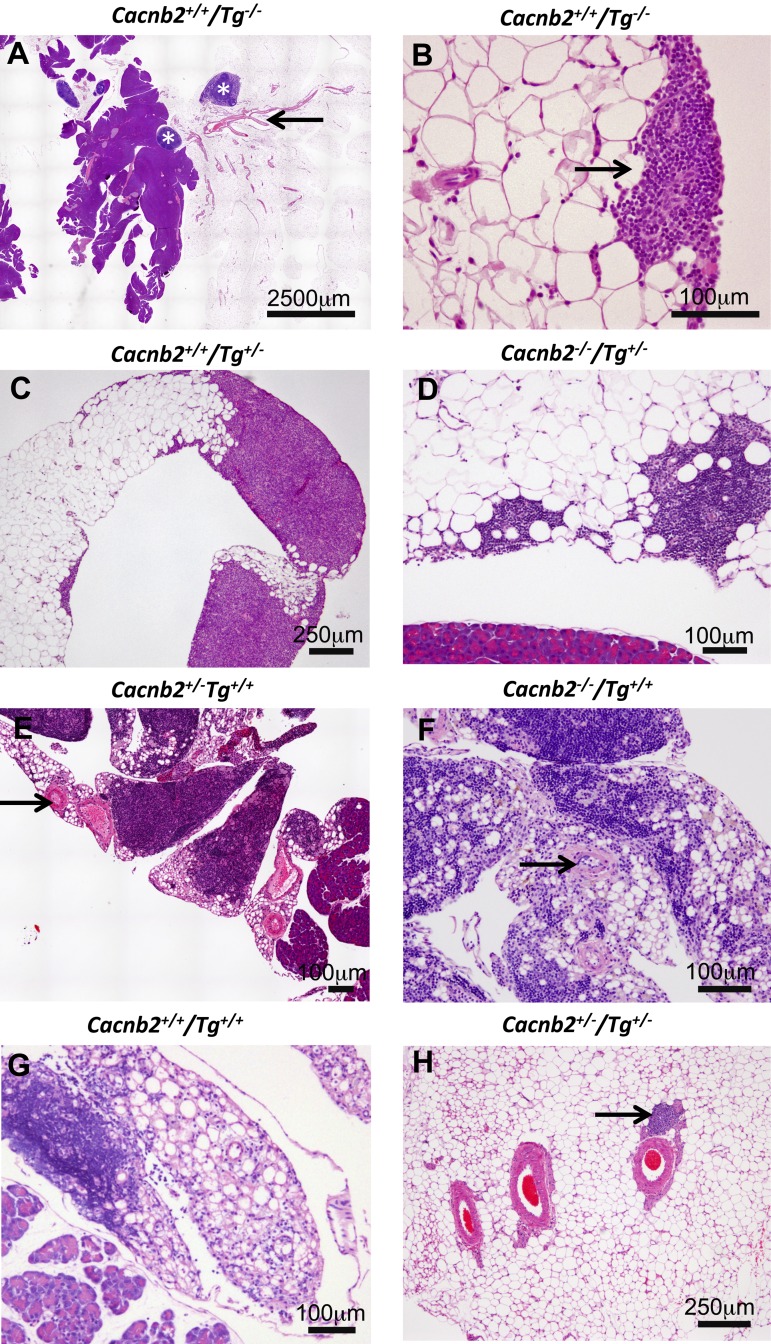
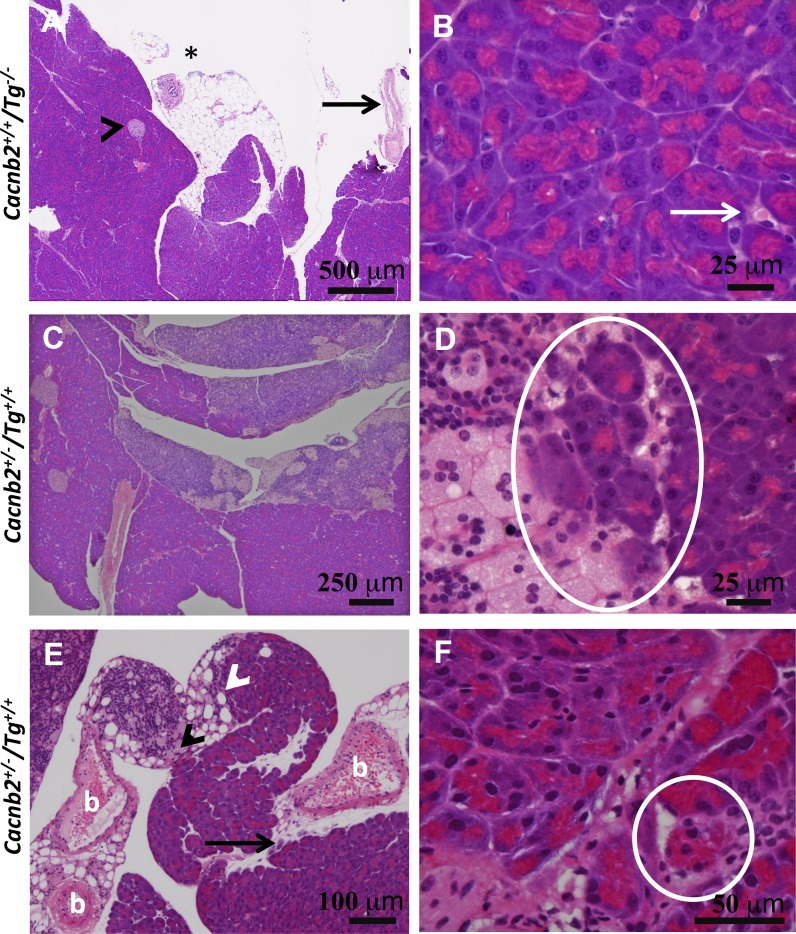
In contrast to the enlarged liver, both the pancreas and associated adipose tissue appeared atrophied in bloated mice and, therefore, were characterized further in mice from the University of Massachusetts Medical School colony. In healthy mice, sheets of adipocytes normally are attached to the pancreas with small lymph nodes located nearby. An example of this organization is shown for a Cacnb2+/+/Tg−/− mouse in Fig. 8A. At higher magnification, small immune cell aggregates are observed along edges of the adipose sheet (Fig. 8B), as has been described previously (21). Animals heterogeneous for Tg (Tg+/−) have normal-appearing adipose tissue, but expanded clusters of small immune cells located within the sheet of adipocytes sometimes are observed, as shown in Fig. 8, C and D. Tg+/+ mice showed a drastically altered profile where, in addition to expanded clusters of small immune cells, adipose tissue was infiltrated with foamy macrophages. Their presence, along with a thickened extracellular matrix, made the adipose tissue almost unrecognizable (Fig. 8, E–G). This profile was independent of whether mice were Cacnb2+/− (Fig. 8E), Cacnb2−/− (Fig. 8F), or Cacnb2+/+ (Fig. 8G) and was observed in all mice that were Tg+/+. Immune infiltration of the adipose tissue was sufficiently extensive that adipose tissue resembled lymph tissue; however, adipose tissue could be distinguished from lymph tissue by the prominent arteries that travel through adipose tissue (Figs. 8, A, E, and F, and 9A; arrows), whereas similar arteries are absent from lymph tissue. Figure 8H shows an example of three blood vessels and one lymph vessel (arrow) in healthy tissue at higher magnification.
Fig. 8.
H&E staining illustrates dramatic changes in adipocytes associated with the pancreas from Tg+/+ mice. A–D: healthy phenotypes. A: adipocytes along with lymph nodes (asterisks), associate with the pancreas of Cacnb2+/+/Tg−/− mice. B: immune cells are found at low density among the adipocytes and in small clusters (arrow) along borders of the adipose tissue. C and D: adipocytes and immune cell clusters from mice heterozygous for Tg (Tg+/−) appear similar to Tg−/− mice whether Cacnb2+/+/Tg+/− (C) or Cacnb2−/−/Tg+/− (D). E–G: mice of varying Cacnb2 genotypes homozygous for Tg (Tg+/+) exhibit extensive changes in adipose tissue. Adipocyte numbers are greatly reduced with thickened extracellular material between cells. Immune cells infiltrated the adipose tissue to such an extent that discriminating lymph vessels from adipose tissue is difficult. E and F: arrows highlight arteries, which remain associated with the adipocytes. H: three arteries and a lymph vessel (arrow) coursing through healthy adipose tissue.
Fig. 9.
Immune cells infiltrate the pancreas of bloated mice. A: low magnification showing lobes of healthy acinar tissue with one islet (arrowhead). Adipose sheet shows an immune cell cluster (asterisk) and large artery (arrow). B: higher magnification from the same pancreas shows immune cells (arrow) within the pancreas. C: low magnification showing enlarged lymph glands attached to lobes of the exocrine pancreas of a bloated mouse. D: higher magnification of the same pancreas showing macrophages, small immune cell infiltration, and phagocytosis of acinar cells (circle). E: concentration of small immune cells (white arrowhead) and foam cells (black arrowhead), located at the junction between adipose tissue and an exocrine lobe of the pancreas from a second Tg+/+ mouse. Black arrow highlights a second example of immune infiltration and possible acinar cell phagocytosis by macrophages. b, Blood vessels with thickened walls. F: higher magnification of acinar tissue from the same pancreas as in E shows massive immune cell infiltration, fibrosis, and apparent phagocytosis of one acinar cell highlighted by a white circle.
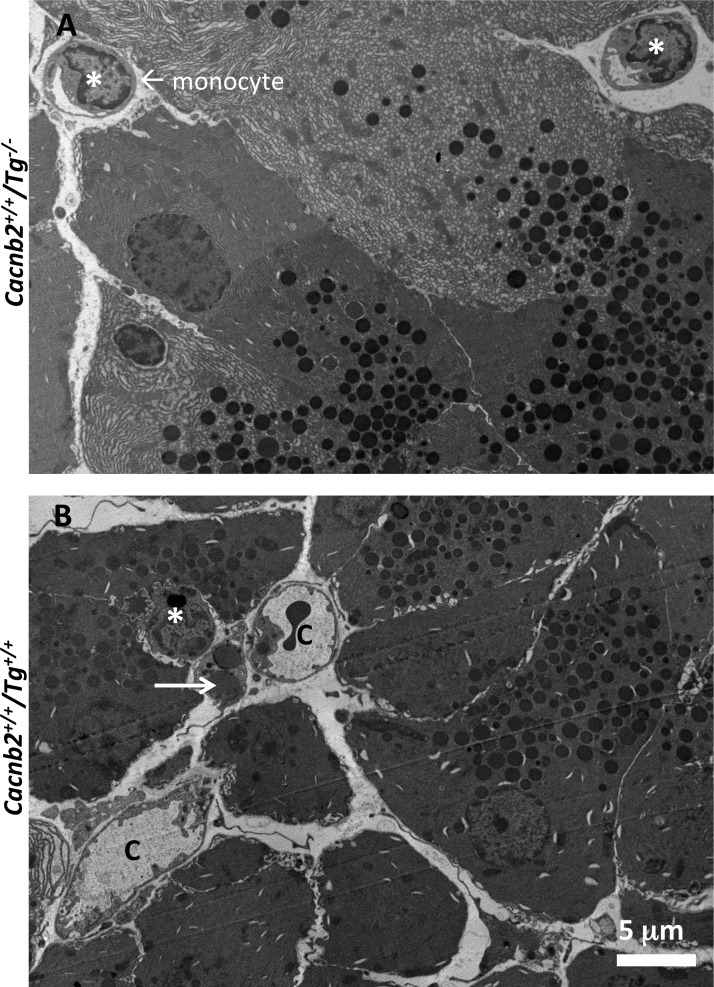
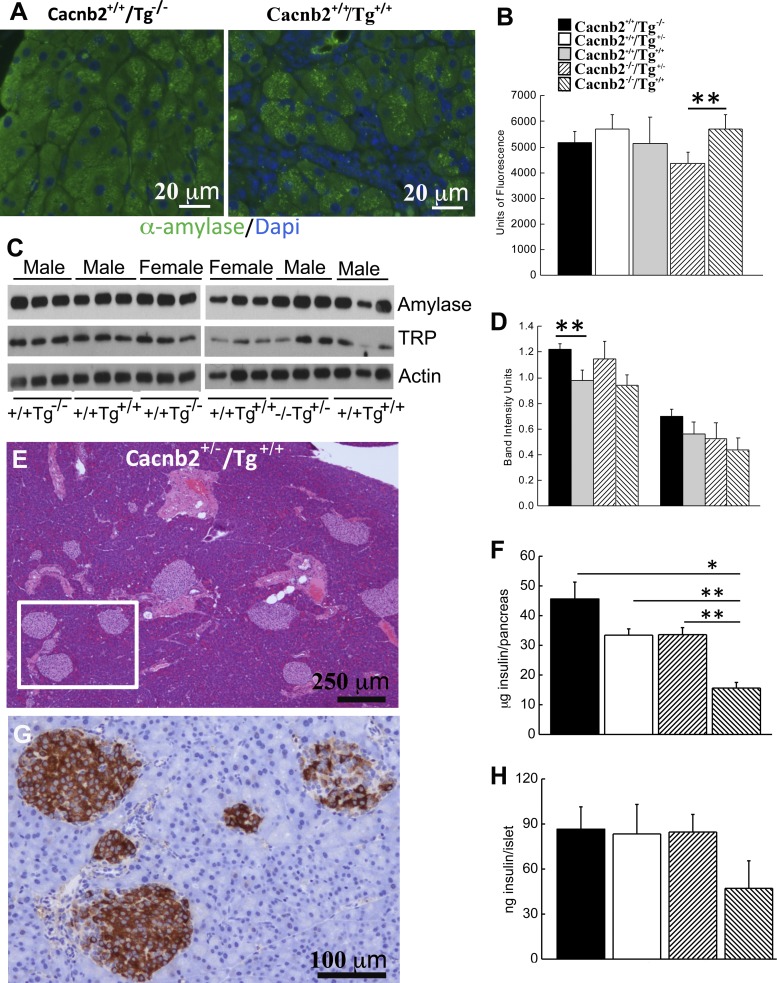
While a low incidence of immune cell infiltration was observed within the pancreatic acinar lobes of healthy mice (Fig. 9, A and B), extensive infiltration occurred in the exocrine pancreas of bloated mice. Tg+/+ animals exhibited enlarged lymph vessels or nodes that prominently associated with the pancreas. Some of these vessels, packed with both small immune cells as well as foamy macrophages, were found attached to acinar lobes of the pancreas (Fig. 9C). Macrophages and other immune cells amassed at this junction, as well as within the lobes and along outer edges of the pancreas (Fig. 9, C–F). At these sites, macrophages appear to engulf individual acinar cells [Fig. 9, D and F (within the circle) and E (arrow)]. At the electron microscopic level, acinar tissue from bloated mice exhibited noticeable cell debris, as well as invading immune cells in extracellular spaces (Fig. 10). Consistent with a loss of acinar cells in bloated mice, a decrease in mass was confirmed by comparing the weights of whole pancreas from Tg+/+ mice (178 ± 27.9 mg, n = 6) to Cacnb2+/+/Tg−/− mice (319 ± 12. 7 mg, P < 0.0001, n = 13) and Cacnb2+/+/Tg+/− mice (316 ± 15.8 mg, P < 0.0005, n = 11) or Cacnb2−/−/Tg+/− mice (368 ± 30.7 mg, P < 0.001, n = 6). When we examined α-amylase content by immunohistochemistry in Cacnb2+/+/Tg−/−, Cacnb2+/+/Tg+/−, and Cacnb2+/+/Tg+/+ mice, we found no significant change in immunostaining (Fig. 11, A and B). However, a small but significant increase (31%) in immunostaining occurred in Cacnb2−/−/Tg+/+ mice compared with Cacnb2−/−/Tg+/− mice. To further probe pancreatic enzyme levels in healthy and bloated mice, we performed Western blot analysis for α-amylase and trypsinogen (Fig. 11C). While both α-amylase and trypsinogen trended downward in bloated phenotypes, only an observed decrease in α-amylase in Cacnb2+/+/Tg+/+ compared with Cacnb2+/+/Tg−/− mice was significantly different (Fig. 11D). These findings are consistent with the notion that the majority of the acinar cells remain functional, despite apparent pancreas infiltration (Figs. 9 and 10) and phagocytosis by macrophages in bloated mice.
Fig. 10.
Electron micrographs reveal immune cell infiltration of the exocrine pancreas in Tg+/+ mice. A: healthy acinar tissue from a Cacnb2+/+/Tg−/− mouse. Note the immune cells (asterisks) in interstitial spaces. B: acinar tissue from a Cacnb2+/+/Tg+/+ sibling mouse. Note the increased number of immune cells (asterisk) with extended, thin processes, and the wider interstitial spaces. One immune cell by a capillary (c) contained large lipid droplets (arrow). Magnification, ×1,950.
Fig. 11.
Tg+/+ mice exhibit changes in protein levels. A: immunohistochemistry of α-amylase. Left: pancreas from Cacnb2+/+/Tg−/− mouse. Right: pancreas from Cacnb2+/+/Tg+/+mouse. B: quantitation of α-amylase immunostaining in pancreas of different genotypes (n = 2–3 mice/group). **P < 0.0016. C: Western blot analysis of exocrine pancreas from Cacnb2+/+/Tg−/− and Cacnb2+/+/Tg+/+ mice. Amylase, α-amylase; TRP, trypsinogen. Lanes 1–3, male Cacnb2+/+/Tg−/−; lanes 4–6, male Cacnb2+/+/Tg+/+; lanes 7–9, female Cacnb2+/+/Tg−/−; lanes 10–12, female Cacnb2+/+/Tg+/+; lanes 13–15, male Cacnb2−/−/Tg+/−; lanes 16–18, male Cacnb2−/−/Tg++. D: quantification of Western blot band densities (n = 3 mice/group). **P = 0.025. E: H&E image of bloated pancreas where islets are plentiful and appear normal. F: insulin/pancreas is significantly lower in bloated Cacnb2−/−/Tg+/+ mice compared with other healthy genotypes. *P < 0.05. **P < 0.01. G: enlargement of area within the square shown in E and stained with hemoxylin and an HRP-conjugated insulin antibody. H: this difference was also observed when insulin content per 25 islets from Cacnb2−/−/Tg+/+ mice was compared with other healthy genotypes. *P < 0.05. In healthy mice, no significant differences were observed in total insulin/pancreas or insulin content/islet, measured from 25 isolated islets. Values are means ± SE.
Despite the loss of acinar tissue, superficial inspection of pancreatic islets showed no obvious disruption in bloated animals with many islets clustered normally around large ducts (Fig. 11E). Immunohistochemical staining showed that islets from bloated mice stained positive for insulin, although some islets exhibited incomplete staining (Fig. 11G), suggesting that insulin content might have decreased. To test for this possibility, insulin content/pancreas was determined for the different genotypes. A significant ∼66% reduction in total insulin content/pancreas of Tg+/+ mice (15.6 ± 1.91 μg, n = 4) compared with healthy Cacnb2+/+/Tg−/− mice (45.6 ± 5.69 μg, n = 13, P ≤ 0.02) was found. Significant differences were also observed with Cacnb2+/+/Tg+/− (33.4 ± 2.07 μg, P ≤ 0.0005, n = 11) and Cacnb2−/−/Tg+/− mice (33.6 ± 2.35 μg, P ≤ 0.001, n = 6) (Fig. 11F). In contrast, insulin content/pancreas of Cacnb2−/−/Tg+/− mice did not differ significantly from Cacnb2+/+ mice, with (Tg+/−) or without (Tg−/−) a Tg allele, indicating that cognate Cacnb2 gene copy number does not contribute to decreases in insulin content observed in Tg+/+ mice. To determine whether a decline in insulin/islet could account for the reduction in total insulin, 25 islets were isolated from pancreas and then assayed for insulin content. We found that insulin content/islet declined ∼45% compared with healthy mice (Fig. 11H; n = 3). This reduction complements the decrease in total insulin/pancreas observed when comparing Cacnb2+/+/Tg+/− or Cacnb2−/−/Tg+/− to Tg+/+ mice values, suggesting that insulin content, but not islet numbers, decreases in bloated animals. Thus varied changes in the abdominal tissues examined contributed to the Tg+/+ phenotype.
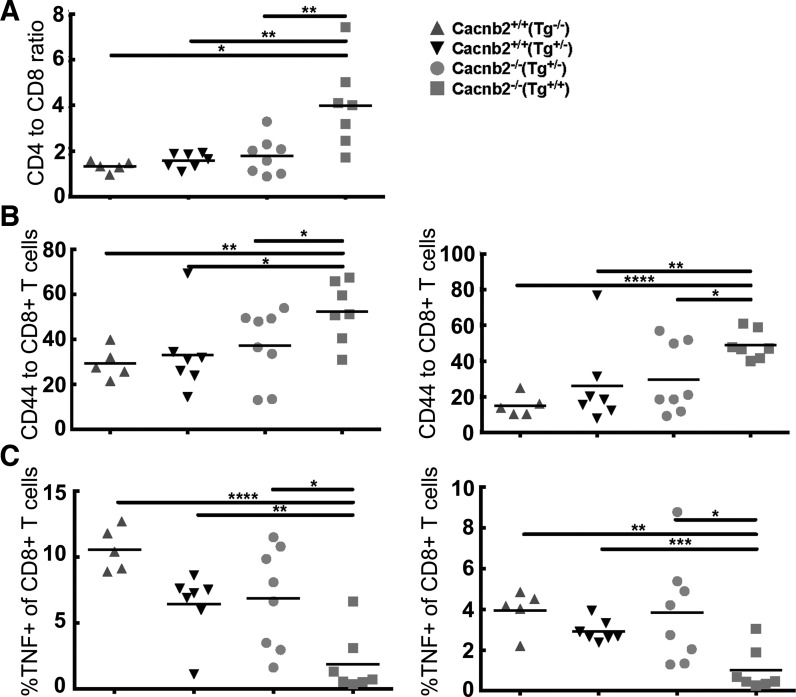
Since most of the tissues examined showed clusters of foamy macrophages, we performed cytokine assays on splenocytes isolated from healthy and bloated mice to further examine immune cell function (Fig. 12). The splenocytes from the Cacnb2−/−/Tg+/+ mice had a reduced frequency of CD8+ T cells compared with their cohorts from the three healthy groups (Cacnb2+/+/Tg−/−, Cacnb2+/+/Tg+/−, Cacnb2−/−/Tg+/) (Fig. 12A). Upon CD3 stimulation, the Cacnb2−/−/Tg+/+ mice also showed a significant increase in the surface expression of the activation marker CD44 on both CD4+ and CD8+ T cells, suggestive of a strongly activated phenotype (Fig. 12B). This activation, however, did correlate with cytokine production, as both the CD4+ and CD8+ T cells from the Cacnb2−/−/Tg+/+ mice, compared with the three healthy groups, showed a significantly reduced TNF (Fig. 12C), and a trend toward reduced IL-2, and IFN-γ production (data not shown). These data together are suggestive of a hyperactive and potentially exhausted immune microenvironment within the spleens of the Cacnb2−/−/Tg+/+ mice.
Fig. 12.
T-cell phenotype from spleens of bloated mice. Splenocytes were stimulated with CD3 in the presence of monensin for 4 h. Cells were first stained for CD3, CD8, CD4, and CD44. After fixation and permeabilization, intracellular staining for IFN-γ, IL-2, and TNF was performed. Summary of data representing the expression of CD44 and cytokines among T cells is shown. A: CD4-to-CD8 ratio of splenic T cells. B: surface expression of CD44 by CD4+ and CD8+ T cells. C: TNF producing CD4+ and CD8+ T cells. The horizontal bar represents the median value for each genotype. P values were derived by t-test. *P < 0.05. **P < 0.01. ***P < 0.001. ****P < 0.0001.
Correlation of the Tg+/+ genotype with the bloated phenotype was unanticipated. To understand better how Tg+/+ homozygosity might cause the bloated phenotype, the Tg+/+ mouse genome was sequenced using next-generation sequencing to identify Tg insertion site(s) and determine how many copies of Tg inserted per site. We found that multiple copies of the Tg (∼25) inserted at a single site on chromosome 19. Unexpectedly, we found that an approximate 180,000 base pair segment of DNA at the insertion site lacked any sequence coverage compared with, on average, 30× coverage across the remainder of the genome. We built primers to confirm the multi-Tg insertion site and defined the boundaries of the deletion, which are shown in Fig. 13. We found that the deletion impacted several genes. Lipa and the death receptor Tnfrsf6 (tumor necrosis factor receptor super family gene 6), also called CD95 or Fas (44), have exons 6–10 and exon 9 deleted, respectively. Additionally Ch25h, one LincRNA (Gm26902), one microRNA (Gm23060), and one unclassified RNA coding gene (Gm27818), located between Lipa and Fas, also were deleted.
Fig. 13.
Next-generation sequencing of a bloated mouse's genome revealed an approximate 180,000 base pair deletion on chromosome 19. At least 25 copies of the Tg (green) inserted into the genome at the deletion site. The precise location of the 5′ deletion breakpoint was identified (Chr19:34,323,797,mm10); however, because of the presence of repeat sequences, the exact location of the 3′ breakpoint could not be determined. The deletion disrupts the death receptor TNFRSF6 (tumor necrosis factor receptor super family gene 6), also called CD95 or Fas. Lipa, lysosomal acid lipase.
DISCUSSION
We have described a severe phenotype in mice homozygous for a CaVβ2a transgene (Tg). While phenotypically normal at birth, Tg+/+ mice develop a bloated appearance by ∼6 wk of age, grossly characterized by an enlarged yellow liver with significantly increased fat content, enlarged spleen, and thickened intestines that result in a bloated abdomen, despite a virtual absence of abdominal fat. Notably, cholesterol, cholesterol ester, and triglyceride levels all are significantly increased in the liver with cholesterol-like crystals observable at the electron microscopic level, suggestive of a lipid processing defect. Accompanying the lipid build up in the liver is a widespread accumulation of foamy macrophages. Specifically, H&E staining revealed clusters of these foamy macrophages packed into distended sinusoids in liver, spleen and lymph nodes. Additionally, the pancreas, associated adipocytes, and lamina propria of the small intestines exhibit extensive foam cell infiltration.
The Tg+/+ mouse phenotype bears a striking resemblance to WD (7, 29, 31) and CESD (5), autosomal recessive diseases caused by mutations in the Lipa gene. LIPA, a 378-amino acid protein found within lysosomes, hydrolyzes cholesterol esters and triglycerides to generate cholesterol and free fatty acids. LIPA also is required for lipid breakdown products to exit lysosomes (17). WD patients exhibit hepatomegaly and cachexia due to malabsorption of lipids, along with foamy macrophage accumulation in the villi of the small intestine and in liver sinusoids (7). This striking pathology results in a failure to thrive with a lifespan of ∼6 mo [see vom Dahl and Mengel (43) for review]. CESD is a less severe form of LIPA malfunction, where an enlarged fatty liver is the primary symptom, resulting from an accumulation of Kupffer cells engorged with cholesterol esters (5).
The mouse and human Lipa genes share a similar exon-intron organization (16) and Lipa mutations in mouse recapitulate WD and CESD phenotypes (13, 16, 32); enzyme therapy or adenovirus-mediated gene transfer of Lipa (12, 14, 15) corrects the observed pathology in mouse models. Notably, Du et al. (13) identified the source of the foamy macrophages in the Lipa−/− mouse liver as arising from proliferation of Kupffer cells and describe the pathology as primarily a macrophage disease. In support of this idea, conditional expression of h-LIPA selectively in macrophages of Lipa−/− mice significantly reduced lipid accumulation in liver and intestine that was accompanied by decreased inflammation and neutrophil infiltration (46). Similar to the Tg+/+ mice described here, by 1.5 mo Lipa−/− mice had significantly reduced white adipose tissue, and by 4 mo adipocytes were undetectable (13). The authors had no explanation for why an absence of LIPA would deplete white adipose tissue. However, adipose tissue expands and contracts based on the demand for lipid storage. It is possible that the build up of complex lipid in the liver with little metabolism or secretion into the circulation resulted in signaling for adipocyte apoptosis in both the Lipa−/− and Tg+/+ mice. Additionally with the Tg+/+ mice of this report, the markedly thickened intestinal lamina propria may result in decreased absorption of nutrients across the mucosa, leading to malnutrition. Fat stores are likely depleted due to negative energy balance in these mice.
The striking similarity of phenotypes among WD, CESD, and the Lipa−/− mouse model with the Tg+/+ mice was unanticipated, since VGCC subunits do not appear to play a role either in the human diseases or in the Lipa−/− mouse model. To determine whether the Tg insertion might have disrupted genomic DNA and more specifically the Lipa gene, genomic DNA from Tg+/+ mice was sequenced. We found multiple copies of Tg inserted into chromosome 19, as well as a 180-kilobase pair deletion at the insertion site. As suspected, one consequence of the large deletion was partial deletion of Lipa. The large build up of cholesterol esters and triglycerides and the significant decrease in in vitro LIPA activity in Tg+/+ livers indicate that the partial deletion of Lipa disrupts normal LIPA function. Notably, the enlarged livers show a downregulation of FABP1, normally expressed in hepatocytes, and prominent expression of FABP4, a macrophage-associated protein, reflective of the large increase in foamy macrophages packing and distorting liver sinusoids.
Additional genes within the deletion site include three RNA genes of unknown function (JBrowse chromosome 19) and Ch25h, a 32-kDa endoplasmic reticulum-associated glycoprotein that participates in innate immune responses and exhibits broad antiviral activity (6, 20, 26, 37). Lastly, CD95, also known as the death receptor Fas, was partially deleted. Loss of function of CH25H and CD95 may both contribute to the bloated phenotype. Macrophages within the liver as well as other organs are potentially a rich source of CH25H, where toll-like receptor−3 and −4 agonists, such as type I IFN, induce Ch25h's transcription (4, 11) during innate immune responses (35). Its product, 25-hydroxycholesterol suppresses IL-1β transcription, protein expression, and inflammasome activity, but also amplifies inflammatory signaling via activator protein-1 activity (20, 37) and stimulates cholesterol and fatty acid synthesis. A major metabolite of 25-hydroxycholesterol, 25-hydroxycholesterol-3 sulfate, downregulates cholesterol and fatty acid biosynthetic pathways in macrophages (27), creating a tight negative feedback loop. The ratio of these two sterols appears to regulate macrophage lipid homeostasis. Ch25h−/− macrophages exhibit elevated pro-IL-1β levels (37). However, the Tg+/+ in our study exhibited decreased levels of TNF-α, consistent with a hyperactive and potentially exhausted immune microenvironment within the spleens of the Cacnb2−/−/Tg+/+ mice. Based on these properties, CH25H's absence in Tg+/+ mice may enhance inflammatory activity brought on by the absence of functional LIPA, while simultaneously dampening further cholesterol build up and fatty acid synthesis.
CD95, a transmembrane receptor from the TNF receptor superfamily, is found in plasma membranes of most cells. Activation of CD95 normally triggers apoptosis (24), but, in certain cells, CD95 also participates in growth and proliferation. In particular, CD95 signaling coordinates the balance between hepatocyte proliferation and apoptosis, with the net outcome determined by the complement of downstream signaling molecules present (47). Loss of CD95 serves as a proliferative signal for hepatocytes (1), which may contribute to the enlarged liver, in addition to the accumulation of lipids.
CD95 binds to Fas ligand, a lymphocyte transmembrane protein, which induces CD95 to trimerize (44), leading to recruitment of Fadd and activation of caspase-8. Together, they form the death-inducing signaling complex [see Ashkenazi (2) for review]. Caloric restrictive conditions stimulate normal fat cells to become sensitized to CD95-induced apoptosis as a mechanism for downregulating adipose tissue (19). CD95 is also active in certain diseases, where CD95-induced apoptosis mediates loss of fat cells, such as in autoimmune lipodystrophy (18) and in a number of liver diseases (36). Defects in CD95 block apoptosis (44) and cause lymphoproliferative disease in mice, where CD4 and CD8 T-lymphocytes proliferate and accumulate in the liver of CD95−/− mice (34, 44). The increased immune cells found in the liver of Tg+/+ mice elevated CD44 expression on splenic T-cells (Fig. 12B), as well as the observed increase in CD4+-to-CD8+ ratio (Fig. 12A), are consistent with defective or nonfunctional CD95. Thus CD95 plays an active role in immune cell activation and proliferation, as well as apoptosis. In the bloated mice, compromised or lost CD95 activity may contribute further to immune cell expansion, hepatocyte proliferation, and infiltration and apoptosis of exocrine pancreas and adipose tissue. Lipa−/− mice also show tissue infiltration by immune cells and a profound loss of adipose tissue, raising the possibility that the consequences of nonfunctional CD95 may be redundant with LIPA dysfunction.
Interestingly, despite loss of pancreatic acinar cells that are known to express CD95, H&E staining of islets appeared normal, despite significant decreases in insulin levels in Tg+/+ mice. We imagine that the severe cachexia rather than a specific defect in β-cell functioning underlies decreased insulin content. This possibility is supported by findings that Lipa−/− mice were only slightly insulin resistant and were not diabetic (13). Moreover, with immunohistochemistry quantification, we found a small but significant increase in α-amylase only in acinar cells from Cacnb2−/−(Tg+/+) mice. The downward trend of α-amylase and trypsinogen levels found by WB analysis of pancreas, when comparing Tg−/− and Tg+/+ genotypes, may reflect the decreased number of acinar cells compared with islets and infiltrating immune cells within the pancreas. Taken together, the data suggest that, while a decrease in exocrine pancreatic mass occurs in bloated mice, the remaining acinar cells remain functional.
In summary, we have found Tg+/+ mice exhibit striking pathology, affecting many organ systems due to the loss of functional LIPA, CH25H, and CD95. Pathology is highlighted by lipid build up due to faulty lipid processing, loss of adipocytes, proliferation of macrophages, and immune infiltration of a variety of tissues. In contrast, Tg+/− mice suffer little of the bloated profile and continue to offer a useful model system for examining the role of β2 VGCC subunit in a variety of tissues. Thus the Cacnb2+/+/Tg+/+ mouse may be useful as a model to examine relationships among lipid storage dysfunction, immune activation, and inflammation.
GRANTS
This work was supported in part by UL1TR000039 (Clinical and Translational Science Award), R24 OD018259-02 (D. L. Greiner and R. Bortell), internal funds from University of Arkansas for Medical Sciences (UAMS) Department of Pathology (L. J. Hennings), and an in-house UMMS sabbatical Award (A. R. Rittenhouse). Lastly, the project described was supported by award no. S10RR027897 from the National Center For Research Resources.
DISCLAIMERS
The content is solely the responsibility of the authors and does not necessarily represent the official views of the National Center For Research Resources or the National Institutes of Health.
DISCLOSURES
No conflicts of interest, financial or otherwise, are declared by the author(s).
AUTHOR CONTRIBUTIONS
S.O.-M., R.J., A.J., K.-E.A., S.A.S., R.B., R.G., A.C., L.J.H., and A.R.R. conception and design of research; S.O.-M., R.J., A.J., K.-E.A., S.M., T.F., A.C., L.J.H., and A.R.R. performed experiments; S.O.-M., R.J., A.J., K.-E.A., S.M., S.A.S., R.B., A.C., L.J.H., and A.R.R. interpreted results of experiments; S.O.-M., A.J., K.-E.A., S.A.S., D.L.G., R.B., R.G., A.C., L.J.H., and A.R.R. edited and revised manuscript; S.O.-M., A.J., S.M., S.A.S., D.L.G., R.B., A.C., and A.R.R. approved final version of manuscript; R.J., A.J., S.M., T.F., A.C., and A.R.R. analyzed data; A.J., K.-E.A., S.M., S.A.S., R.G., A.C., L.J.H., and A.R.R. prepared figures; S.A.S., R.G., A.C., L.J.H., and A.R.R. drafted manuscript.
ACKNOWLEDGMENTS
Sam Behar, Philip DiIorio, Karin Green, Gregory Hendricks, Natalia Przewozniak, Keith Redding, Ann Rothstein, Lara Strittmatter, Otto Walter, and members of the University of Massachusetts Medical School (UMMS) Beta Cell Group provided helpful discussions concerning liver and pancreatic pathophysiology. We thank Nancy Rusch (University of Arkansas Medical School) for generously providing Cacnb2/Tg+/+ mice from her colony. We thank members of the UMMS EM facility, the Mass Spectrometry facility, the UMMS Morphology Core Facility, and the laboratories of Fumihiko Urano and Dale Greiner for technical help.
Present address of L. J. Hennings: Boehringher Manheim Co., 3808 NW 78th St., Kansas City, MO 64151.
REFERENCES
- 1.Adachi M, Suematsu S, Kondo T, Ogasawara J, Tanaka T, Yoshida N, Nagata S. Targeted mutation in the Fas gene causes hyperplasia in peripheral lymphoid organs and liver. Nat Genet 11: 294–300, 1995. [DOI] [PubMed] [Google Scholar]
- 2.Ashkenazi A. Targeting the extrinsic apoptosis pathway in cancer. Cytokine Growth Factor Rev 19: 325–331, 2008. [DOI] [PubMed] [Google Scholar]
- 3.Ball SL, Powers PA, Shin HS, Morgans CW, Peachey NS, Gregg RG. Role of the beta(2) subunit of voltage-dependent calcium channels in the retinal outer plexiform layer. Invest Ophthalmol Vis Sci 43: 1595–1603, 2002. [PubMed] [Google Scholar]
- 4.Bauman DR, Bitmansour AD, McDonald JG, Thompson BM, Liang G, Russell DW. 25-Hydroxycholesterol secreted by macrophages in response to Toll-like receptor activation suppresses immunoglobulin A production. Proc Natl Acad Sci U S A 106: 16764–16769, 2009. [DOI] [PMC free article] [PubMed] [Google Scholar]
- 5.Beaudet AL, Ferry GD, Nichols BL, Rosenberg HS. Cholesterol ester storage disease: clinical, biochemical, and pathological studies. J Pediatr 90: 910–914, 1977. [DOI] [PubMed] [Google Scholar]
- 6.Blanc M, Hsieh WY, Robertson KA, Kropp KA, Forster T, Shui G, Lacaze P, Watterson S, Griffiths SJ, Spann NJ, Meljon A, Talbot S, Krishnan K, Covey DF, Wenk MR, Craigon M, Ruzsics Z, Haas J, Angulo A, Griffiths WJ, Glass CK, Wang Y, Ghazal P. The transcription factor STAT-1 couples macrophage synthesis of 25-hydroxycholesterol to the interferon antiviral response. Immunity 38: 106–118, 2013. [DOI] [PMC free article] [PubMed] [Google Scholar]
- 7.Boldrini R, Devito R, Biselli R, Filocamo M, Bosman C. Wolman disease and cholesteryl ester storage disease diagnosed by histological and ultrastructural examination of intestinal and liver biopsy. Pathol Res Pract 200: 231–240, 2004. [DOI] [PubMed] [Google Scholar]
- 8.Catterall WA. Structure and regulation of voltage-gated Ca2+ channels. Ann Rev Cell Dev Biol 16: 521–555, 2000. [DOI] [PubMed] [Google Scholar]
- 9.Chien AJ, Hosey MM. Post-translational modifications of beta subunits of voltage-dependent calcium channels. J Bioenerg Biomembr 30: 377–386, 1998. [DOI] [PubMed] [Google Scholar]
- 10.Colecraft HM, Alseikhan B, Takahashi SX, Chaudhuri D, Mittman S, Yegnasubramanian V, Alvania RS, Johns DC, Marban E, Yue DT. Novel functional properties of Ca(2+) channel beta subunits revealed by their expression in adult rat heart cells. J Physiol 541: 435–452, 2002. [DOI] [PMC free article] [PubMed] [Google Scholar]
- 11.Diczfalusy U, Olofsson KE, Carlsson AM, Gong M, Golenbock DT, Rooyackers O, Fläring U, Björkbacka H. Marked upregulation of cholesterol 25-hydroxylase expression by lipopolysaccharide. J Lipid Res 50: 2258–2264, 2009. [DOI] [PMC free article] [PubMed] [Google Scholar]
- 12.Du H, Cameron TL, Garger SJ, Pogue GP, Hamm LA, White E, Hanley KM, Grabowski GA. Wolman disease/cholesteryl ester storage disease: efficacy of plant-produced human lysosomal acid lipase in mice. J Lipid Res 49: 1646–1657, 2008. [DOI] [PMC free article] [PubMed] [Google Scholar]
- 13.Du H, Heur M, Duanmu M, Grabowski GA, Hui DY, Witte DP, Mishra J. Lysosomal acid lipase-deficient mice: depletion of white and brown fat, severe hepatosplenomegaly, and shortened life span. J Lipid Res 42: 489–500, 2001. [PubMed] [Google Scholar]
- 14.Du H, Heur M, Witte DP, Ameis D, Grabowski GA. Lysosomal acid lipase deficiency: correction of lipid storage by adenovirus-mediated gene transfer in mice. Hum Gene Ther 13: 1361–1372, 2002. [DOI] [PubMed] [Google Scholar]
- 15.Du H, Schiavi S, Levine M, Mishra J, Heur M, Grabowski GA. Enzyme therapy for lysosomal acid lipase deficiency in the mouse. Hum Mol Genet 10: 1639–1648, 2001. [DOI] [PubMed] [Google Scholar]
- 16.Du H, Sheriff S, Bezerra J, Leonova T, Grabowski GA. Molecular and enzymatic analyses of lysosomal acid lipase in cholesteryl ester storage disease. Mol Genet Metab 64: 126–134, 1998. [DOI] [PubMed] [Google Scholar]
- 17.Dubland JA, Francis GA. Lysosomal acid lipase: at the crossroads of normal and atherogenic cholesterol metabolism. Front Cell Dev Biol 3: 3, 2015. [DOI] [PMC free article] [PubMed] [Google Scholar]
- 18.Fischer-Posovszky P, Hebestreit H, Hofmann AK, Strauss G, Möller P, Debatin KM, Wabitsch M. Role of CD95-mediated adipocyte loss in autoimmune lipodystrophy. J Clin Endocrinol Metab 91: 1129–1135, 2006. [DOI] [PubMed] [Google Scholar]
- 19.Fischer-Posovszky P, Keuper M, Nagel S, Hesse D, Schürmann A, Debatin KM, Strauss G, Wabitsch M. Downregulation of FLIP by cycloheximide sensitizes human fat cells to CD95-induced apoptosis. Exp Cell Res 317: 2200–2209, 2011. [DOI] [PubMed] [Google Scholar]
- 20.Gold ES, Diercks AH, Podolsky I, Podyminogin RL, Askovich PS, Treuting PM, Aderem A. 25-Hydroxycholesterol acts as an amplifier of inflammatory signaling. Proc Natl Acad Sci U S A 111: 10666–10671, 2014. [DOI] [PMC free article] [PubMed] [Google Scholar]
- 21.Grant RW, Dixit VD. Adipose tissue as an immunological organ. Obesity (Silver Spring) 23: 512–518, 2015. [DOI] [PMC free article] [PubMed] [Google Scholar]
- 22.Gray AC, Raingo J, Lipscombe D. Neuronal calcium channels: splicing for optimal performance. Cell Calcium 42: 409–417, 2007. [DOI] [PMC free article] [PubMed] [Google Scholar]
- 23.Ioannou GN, Haigh WG, Thorning D, Savard C. Hepatic cholesterol crystals and crown-like structures distinguish NASH from simple steatosis. J Lipid Res 54: 1326–1334, 2013. [DOI] [PMC free article] [PubMed] [Google Scholar]
- 24.Itoh N, Yonehara S, Ishii A, Yonehara M, Mizushima S, Sameshima M, Hase A, Seto Y, Nagata S. The polypeptide encoded by the cDNA for human cell surface antigen Fas can mediate apoptosis. Cell 66: 233–243, 1991. [DOI] [PubMed] [Google Scholar]
- 25.Lee K, Santibanez-Koref M, Polvikoski T, Birchall D, Mendelow AD, Keavney B. Increased expression of fatty acid binding protein 4 and leptin in resident macrophages characterises atherosclerotic plaque rupture. Atherosclerosis 226: 74–81, 2013. [DOI] [PMC free article] [PubMed] [Google Scholar]
- 26.Liu SY, Aliyari R, Chikere K, Li G, Marsden MD, Smith JK, Pernet O, Guo H, Nusbaum R, Zack JA, Freiberg AN, Su L, Lee B, Cheng G. Interferon-inducible cholesterol-25-hydroxylase broadly inhibits viral entry by production of 25-hydroxycholesterol. Immunity 38: 92–105, 2013. [DOI] [PMC free article] [PubMed] [Google Scholar]
- 27.Ma Y, Xu L, Rodriguez-Agudo D, Li X, Heuman DM, Hylemon PB, Pandak WM, Ren S. 25-Hydroxycholesterol-3-sulfate regulates macrophage lipid metabolism via the LXR/SREBP-1 signaling pathway. Am J Physiol Endocrinol Metab 295: E1369–E1379, 2008. [DOI] [PMC free article] [PubMed] [Google Scholar]
- 28.Maehira F, Nakada F, Hokama T. Characteristics of acid esterase in Wolman's disease. Biochem Med 32: 322–330, 1984. [DOI] [PubMed] [Google Scholar]
- 29.Marshall WC, Ockenden BG, Fosbrooke AS, Cumings JN. Wolman's disease. A rare lipidosis with adrenal calcification. Arch Dis Child 44: 331–341, 1969. [DOI] [PMC free article] [PubMed] [Google Scholar]
- 30.Matyash V, Liebisch G, Kurzchalia TV, Shevchenko A, Schwudke D. Lipid extraction by methyl-tert-butyl ether for high-throughput lipidomics. J Lipid Res 49: 1137–1146, 2008. [DOI] [PMC free article] [PubMed] [Google Scholar]
- 31.Meikle PJ, Hopwood JJ, Clague AE, Carey WF. Prevalence of lysosomal storage disorders. JAMA 281: 249–254, 1999. [DOI] [PubMed] [Google Scholar]
- 32.Nakagawa H, Matsubara S, Kuriyama M, Yoshidome H, Fujiyama J, Yoshida H, Osame M. Cloning of rat lysosomal acid lipase cDNA and identification of the mutation in the rat model of Wolman's disease. J Lipid Res 36: 2212–2218, 1995. [PubMed] [Google Scholar]
- 33.Neef J, Gehrt A, Bulankina AV, Meyer AC, Riedel D, Gregg RG, Strenzke N, Moser T. The Ca2+ channel subunit beta2 regulates Ca2+ channel abundance and function in inner hair cells and is required for hearing. J Neurosci 29: 10730–10740, 2009. [DOI] [PMC free article] [PubMed] [Google Scholar]
- 34.Ohteki T, Seki S, Abo T, Kumagai K. Liver is a possible site for the proliferation of abnormal CD3+4–8- double-negative lymphocytes in autoimmune MRL-lpr/lpr mice. J Exp Med 172: 7–12, 1990. [DOI] [PMC free article] [PubMed] [Google Scholar]
- 35.Park K, Scott AL. Cholesterol 25-hydroxylase production by dendritic cells and macrophages is regulated by type I interferons. J Leukoc Biol 88: 1081–1087, 2010. [DOI] [PMC free article] [PubMed] [Google Scholar]
- 36.Pinkoski MJ, Brunner T, Green DR, Lin T. Fas and Fas ligand in gut and liver. Am J Physiol Gastrointest Liver Physiol 278: G354–G366, 2000. [DOI] [PubMed] [Google Scholar]
- 37.Reboldi A, Dang EV, McDonald JG, Liang G, Russell DW, Cyster JG. Inflammation. 25-Hydroxycholesterol suppresses interleukin-1-driven inflammation downstream of type I interferon. Science 345: 679–684, 2014. [DOI] [PMC free article] [PubMed] [Google Scholar]
- 38.Savage DB, Sewter CP, Klenk ES, Segal DG, Vidal-Puig A, Considine RV, O'Rahilly S. Resistin/Fizz3 expression in relation to obesity and peroxisome proliferator-activated receptor-gamma action in humans. Diabetes 50: 2199–2202, 2001. [DOI] [PubMed] [Google Scholar]
- 39.Soupene E, Kuypers FA. Mammalian long-chain acyl-CoA synthetases. Exp Biol Med (Maywood) 233: 507–521, 2008. [DOI] [PMC free article] [PubMed] [Google Scholar]
- 40.Soupene E, Kuypers FA. Multiple erythroid isoforms of human long-chain acyl-CoA synthetases are produced by switch of the fatty acid gate domains. BMC Mol Biol 7: 21, 2006. [DOI] [PMC free article] [PubMed] [Google Scholar]
- 41.Takahashi SX, Mittman S, Colecraft HM. Distinctive modulatory effects of five human auxiliary beta2 subunit splice variants on L-type calcium channel gating. Biophys J 84: 3007–3021, 2003. [DOI] [PMC free article] [PubMed] [Google Scholar]
- 42.Vandael DH, Mahapatra S, Calorio C, Marcantoni A, Carbone E. Cav1.3 Cav1.2 channels of adrenal chromaffin cells: emerging views on cAMP/cGMP-mediated phosphorylation and role in pacemaking. Biochim Biophys Acta 1828: 1608–1618, 2013. [DOI] [PubMed] [Google Scholar]
- 43.vom Dahl S, Mengel E. Lysosomal storage diseases as differential diagnosis of hepatosplenomegaly. Best Pract Res Clin Gastroenterol 24: 619–628, 2010. [DOI] [PubMed] [Google Scholar]
- 44.Watanabe-Fukunaga R, Brannan CI, Copeland NG, Jenkins NA, Nagata S. Lymphoproliferation disorder in mice explained by defects in Fas antigen that mediates apoptosis. Nature 356: 314–317, 1992. [DOI] [PubMed] [Google Scholar]
- 45.Weissgerber P, Held B, Bloch W, Kaestner L, Chien KR, Fleischmann BK, Lipp P, Flockerzi V, Freichel M. Reduced cardiac L-type Ca2+ current in Ca(V)beta2-/- embryos impairs cardiac development and contraction with secondary defects in vascular maturation. Circ Res 99: 749–757, 2006. [DOI] [PubMed] [Google Scholar]
- 46.Yan C, Lian X, Li Y, Dai Y, White A, Qin Y, Li H, Hume DA, Du H. Macrophage-specific expression of human lysosomal acid lipase corrects inflammation and pathogenic phenotypes in lal−/− mice. Am J Pathol 169: 916–926, 2006. [DOI] [PMC free article] [PubMed] [Google Scholar]
- 47.Zhou Y, Xu JC, Jia YF, Xu CS. Role of death receptors in the regulation of hepatocyte proliferation and apoptosis during rat liver regeneration. Genet Mol Res 14: 14066–14075, 2015. [DOI] [PubMed] [Google Scholar]


