Abstract
Continuous flow ventricular assist devices (cfVADs) provide a life-saving therapy for severe heart failure. However, in recent years, the incidence of device-related thrombosis (resulting in stroke, device-exchange surgery or premature death) has been increasing dramatically, which has alarmed both the medical community and the FDA. The objective of this study was to gain improved understanding of the initiation and progression of thrombosis in one of the most commonly used cfVADs, the Thoratec HeartMate II. A computational fluid dynamics simulation (CFD) was performed using our recently updated mathematical model of thrombosis. The patterns of deposition predicted by simulation agreed well with clinical observations. Furthermore, thrombus accumulation was found to increase with decreased flow rate, and can be completely suppressed by the application of anticoagulants and/or improvement of surface chemistry. To our knowledge, this is the first simulation to explicitly model the processes of platelet deposition and thrombus growth in a continuous flow blood pump and thereby replicate patterns of deposition observed clinically. The use of this simulation tool over a range of hemodynamic, hematological, and anticoagulation conditions could assist physicians to personalize clinical management to mitigate the risk of thrombosis. It may also contribute to the design of future VADs that are less thrombogenic.
Ventricular assist devices (VADs) offer a life-saving option for a great proportion of the 100,000 to 300,000 advanced heart failure patients in the United States1,2. However, this treatment is not exempt of serious adverse events. In particular, the current generation of these devices, so-called continuous flow VADs (cfVADs), have exhibited severe complications related to thrombosis, such as bleeding and stroke, that may negate the benefits of this therapy, and may require a subsequent pump-exchange surgery or lead to premature death3,4. In recent years, the rate of pump thrombosis has been increasing dramatically, which has raised grave concerns by the medical community5,6,7 and the FDA8. Although the inherent risk of thrombosis in these devices is well known, the precise mechanisms responsible for its initiation and progression have not yet been fully understood. Consequently, it is difficult to define best practices to ameliorate the risk of thrombosis without introducing other undesirable outcomes such as bleeding.
In general, it is likely that all three elements of Virchow’s triad play a role in pump thrombosis. But the complexities of the flow fields in these devices, combined with diverse biochemical, pharmacological, and biomaterial processes confound any attempt to seek a statistical model of thrombosis. Therefore, there is a need for a numerical predictive tool to supplant, or compliment, experimental trial-and-error. This has motivated our group over the past fifteen years to incrementally improve the fidelity of a multi-constituent model by adding important hemodynamic and biochemical pathways that are most relevant to blood-wetted devices. This paper reports the application of our most recent mathematical model to predict patterns of thrombus deposition that have been observed clinically in one of the most commonly used continuous flow VADs, the Thoratec HeartMate II (HMII).
Methods
Governing Equations
The thrombosis model presented here includes two groups of governing equations: equations of motion that determine the pressure and velocity fields and a set of coupled convection-diffusion-reaction (CDR) equations that govern the transport and inter-conversion of chemical and biological species – both within the thrombus and in the free stream. The mathematical details of this model have been recently reported in prior publications9,10, and are briefly summarized below.
Equations of Motion
Blood is treated as a multi-constituent mixture comprised of (1) a linear (Newtonian) fluid phase representing plasma and red blood cells (RBCs) and (2) a porous solid phase representing thrombus. The fluid phase, in the inertial frame of reference, is governed by the following continuity and momentum equations that also include interaction with the thrombus phase:
 |
 |
 |
where p is the pressure, Df is the symmetric part of the velocity gradient, and μf consists of both the dynamic viscosity (=3.5cP) and the turbulent eddy viscosity11. A scalar field ϕ is introduced to represent the volume fraction of deposited platelets (thrombus) at any given point in space. The density of the fluid phase is defined in terms of the volume fraction according to:
 |
where ρf0 is the density of the pure fluid phase (=1060 kg/m3), vf,I and vT,I are the velocity of the fluid and thrombus phases, respectively. The subscript I refers to the inertial frame of reference. The term C2f(ϕ)(vf − vT) is the resistance force on the fluid phase imposed by the thrombus, where the coefficient C2 = 2 × 10⁹ kg/(m3s) is computed by assuming the deposited platelets behave like densely compact particles, as described by Johnson et al.12 and Wu et al.13. The function f(ϕ) = ϕ(1 + 6.5ϕ) is the hindrance function, which is obtained from the generalization of the interaction force from a single particle to an assemblage of particles14. Within the rotating impeller section of the pump, the above continuity and momentum equations can be expressed as follows:
 |
 |
where vf,R = vf,I − ω × r is the velocity in rotating frame of reference, ω is the angular velocity of the impeller and r is the polar coordinate. For the thrombus phase, the only mechanical behavior we consider is the resistance force that it imparts on the fluid phase. Therefore, it does not require its own constitutive equation for stress. It should be noted that the velocity of the thrombus vT depends on the frame of reference to which it is attached. If attached to anywhere on the rotor, then vT,I = −ω × r and if attached to a static wall vT,I = 0. Conversely, vT,R = 0, if attached to the rotor, and vT,R = −ω × r if attached to a static wall.
Chemical and biological species
Based on the continuum assumptions for blood, thrombosis is modeled using a system of convection-diffusion-reaction equations. As shown in Fig. 1, the model of thrombus formation accounts for the transport of ten (10) chemical and biological species, summarized in Table 1. These include five categories (states) of platelets (1) RP: resting platelets (in the flow field); (2) AP: activated platelets, which we assume have released their granules and become reactive; (3) RPd: deposited (trapped) resting platelets, (4) APd: deposited active platelets, and (5) APs: deposited and stabilized platelets. An additional five biochemical species include (1) apr(ADP): platelet-released agonists, (2) aps(TxA2): platelet-synthesized agonists, which can be inhibited via first-order reactions; (3) PT: prothrombin; (4) T: thrombin, synthesized from prothrombin on the platelet phospholipid membrane; and (5) AT: anti-thrombin III (ATIII), which inhibits thrombin and whose action is catalyzed by heparin via the kinetic model of Griffith15,16.
Figure 1. Schematic depiction of the thrombosis model, comprised of platelet deposition, aggregation, and stabilization.
RP: resting platelet, AP: activated platelet, RPd and APd: deposited resting and active platelets, APs: stabilized deposited active platelets. Agonists that cause activation (RP to AP) are adenosine diphosphate, ADP; thromboxane A2, TxA2; shear, and thrombin, TB – which is synthesized from prothrombin (PT). The suffix b refers to the reaction with the boundary (surface). The constants kpa, kra, kaa, krpd,b, kapd,b, refer to the reaction rates for inter-conversion of the associated platelet states.
Table 1. Boundary conditions for platelets and biochemical species.
| Species | Units | Inlet Condition | Boundary Conditions(Flux) at Pump Surfaces |
|---|---|---|---|
| [RP] | PLTm−3 | 3.0 × 10¹⁴ |  |
| [AP] | PLTm−3 | 0.01[RP] |  |
| [apr] | nmol−3 | 0.0 |  |
| [aps] | nmol−3 | 0.0 |  |
| [PT] | nmol−3 | 1.1 × 10⁻⁶ |  |
| [T] | Um−3 | 0.0 |  |
| [AT] | nmol−3 | 2.844 × 10⁻⁶ | 0.0 |
| [RPd] | PLTm−3 | 0.0 |  |
| [APd] | PLTm−3 | 0.0 |  |
| [APs] | PLTm−3 | 0.0 |  |
See Wu et al.9 for explanation of the values and physical meanings of these terms.
As shown in Fig. 1, the model attempts to simulate the following mechanisms occurring in blood. 1. Platelet Activation: RP can be converted to be AP through exposure to critical levels of biochemical agonists, namely adenosine diphosphate (ADP), thromboxane A2 (TxA2), thrombin (TB), and shear. It is assumed that this conversion causes the platelets to become adherent to biomaterial surfaces and to other platelets already deposited. 2. Agonists generation: The release of granules (ADP) is caused by the conversion of AP to RP; TxA2 is synthesized by AP; thrombin (TB) is synthesized from prothrombin (PT) on the platelet phospholipid membrane. 3. Platelet Deposition: Both RP and AP in the free stream are capable of depositing onto a surface, such as a channel wall, whereupon they are designated RPd and APd, respectively. This process is mathematically modeled by a reaction flux at the boundary. Therefore, the adhesion property of AP/RP to different biomaterials can be described by different levels of the reaction flux. 4. Thrombus Propagation: When a given volume in space is fully occupied by the thrombus, i.e. the volume fraction of the deposited platelets (RPd and APd) reaches a specified value, the subsequent deposition will propagate to an adjacent space. 5. Thrombus Dissolution or Erosion: The shear stress exerted by the fluid phase is capable of cleaning deposited platelets, thereby corresponding to the phenomenon known as surface “washing”. Mathematically, this was modeled by a thrombus clearance term that is related to the shear stress. 6. Thrombus Inhibition: Anti-thrombin III in the free stream and within the thrombus may bind to thrombin, thus neutralizing the effect of thrombin in activating additional platelets. Griffith’s template model is applied for the kinetics of thrombin inactivation by ATIII. The inhibition of ADP and TxA2 are modeled by first-order reaction rate constants. 7. Thrombus Stabilization: Newly deposited platelets are converted by a constant rate to form a stable clot which cannot be removed by the hydrodynamic force. 8. Thrombus-fluid interaction: As the thrombus accumulates in space, the flow field of blood will be altered due to the porous/solid properties of the thrombus. The permeability of the thrombus is inversely related to the volume fraction of the deposited platelets. As represented in Equation (2) above, this is computed as a resistance force to the fluid flow, analogous to the behavior of packed granular slurries. Additional details and descriptions of the models are provided in Wu et al.9,10.
With the above assumptions, the transport of the species in the flow field is described by ten convection-diffusion-reaction equations15,16 of the form:
 |
where [Ci] is the concentration of species i, and Si is a reaction source term for species i. Di is the diffusivity of species i, given by:
 |
where Di,l refers to the laminar (molecular) diffusivity and Dt is the turbulent (eddy) contributions. The latter is computed as
 |
where vt is the turbulent momentum diffusivity11, and Sc is the Schmidt number which is chosen as 0.9 in current study. Deposited platelets (RPd, APd, and APs) do not have convection and diffusion terms associated with them, and are each governed by a concentration rate equation:
 |
Platelet-surface adhesion and all the other reactions are modeled by surface-flux boundary conditions. Here, similar to the reaction terms in the internal domain, a negative and a positive flux corresponds to consumption and generation, respectively. Additional details of our thrombosis model are provided in a prior publication, which includes the physical description of all the terms as well as the values and origins of all coefficients9,10.
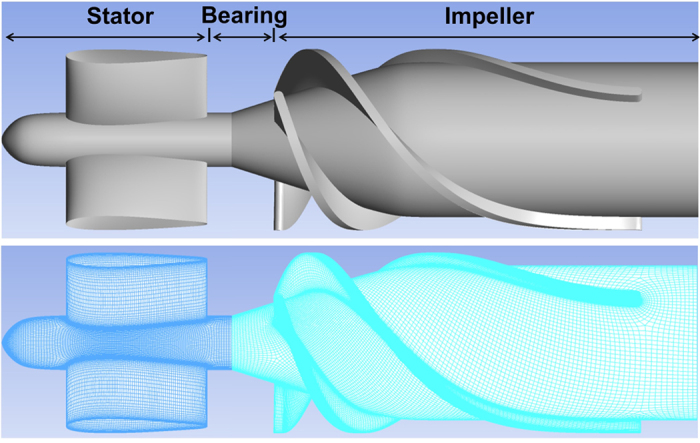
The above model was simulated on a high performance PC workstation (Dell T7910), using the libraries of OpenFOAM. The computational domain was comprised of two subdomains corresponding to the upstream flow straightener and the upstream portion of the impeller of the Thoratec HeartMate II. (See Fig. 2.) This was the primary region of interest for which clinical data was available. The remainder of the flow path was omitted to save computational cost. The mesh was generated using our internally developed automatic elliptic mesh generation system, ADO_Mesh (Advanced Design Optimization, Irvine, CA), with a total of 2.3 million elements. All simulations were solved with an unsteady (transient) solver and the k − ω model was applied to account for turbulence11,17. The rotational speed of the impeller was prescribed at the nominal rate of 9000 RPM. All other components including the shroud were considered static. The interface coupling between the rotational and stationary domains was modeled using the AMIcyclic boundary condition. At the inlet, a uniform velocity profile was applied and the outlet pressure boundary condition was set as 0 Pa. The corresponding boundary conditions for platelets and biochemical species are listed in Table 1. Additional details and descriptions of the physical meaning of each of these terms in Table 1 are provided in Wu et al.9,10.
Figure 2. Computational domain encompassing the geometry(top) and mesh(bottom) of the upstream portion of the HeartMate II pump.
Clinically, the process of thrombosis occurs over the course of hours to days. However, it would be computationally prohibitive to perform a simulation for a corresponding time scale (due to the large number of elements and small time step.) Therefore, to compare the simulation results (on the order of minutes) to clinical observations (on the order of hours) we scaled the reaction rates kra, kaa, krpdb and kapdb by a factor of 30. In the results and discussion sections, all the time of simulation results are also scaled by a factor of 30.
Results
Figure 3 shows the simulated thrombus distribution in the upstream stator and impeller regions of the HeartMate II after 6.25 hours, at the flow rate of 4.5 L/min and rotational speed of 9000 RPM. This simulation required approximately 120 hours (5 days) using 40 CPUs (2.4 GHz). All the coefficients of the model were derived from previously reported values by Wu et al.9, with one exception, namely the characteristic platelet-platelet cleavage shear stresses τsc which was reduced by half (from 30 to 15 dyne cm−2), a reduction factor determined by optimization to better replicate the experimental results. The figure illustrates the regions where the thrombus preferentially accumulates, including the majority of the upstream flow straightener hub, the rear of the straightener vanes and the upstream bearing region. This finding is in good agreement with the regions in which the thrombus has been reported clinically18,19,20 (See Fig. 3b and c). Conversely, the simulation also predicted the regions in which the thrombus was absent, such as the leading edge of the blades of the inlet straightener vane. These correspond to regions of higher shear stress, which accentuates the erosion rate of deposited platelets (See Fig. 4).
Figure 3.
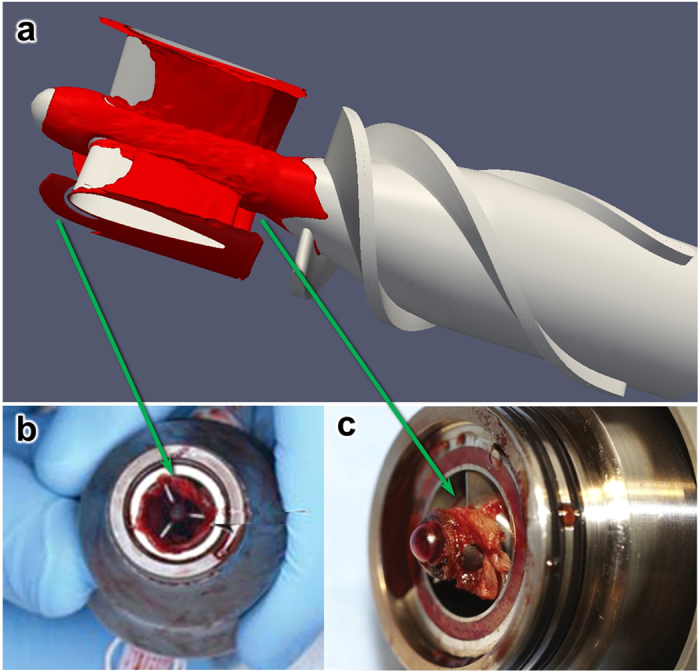
(a) Simulated thrombus deposition (in red) after 6.25 hours, corresponding to a flow rate of 4.5 L/min, and a rotational speed of 9000 RPM; (b) and (c): Clinical observation of thrombus deposition in HeartMate II removed from patients18,19. The correspondence is most remarkable upstream of the inlet straightener vane (b), and surrounding the front bearing (c). Figures (b) and (c) are used by permission.
Figure 4. Shear rate on surfaces of the flow straightener and impeller (4.5 L/min, 9000 RPM).
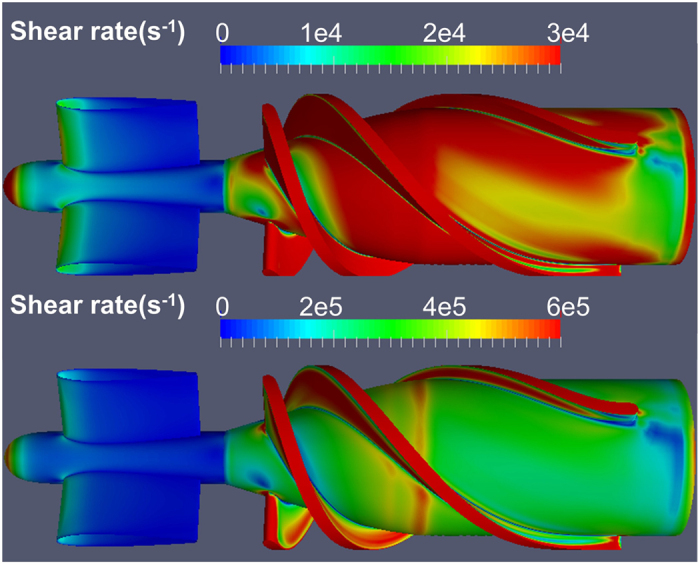
Color scales chosen to accentuate the hub surfaces (top) and impeller blades (bottom).
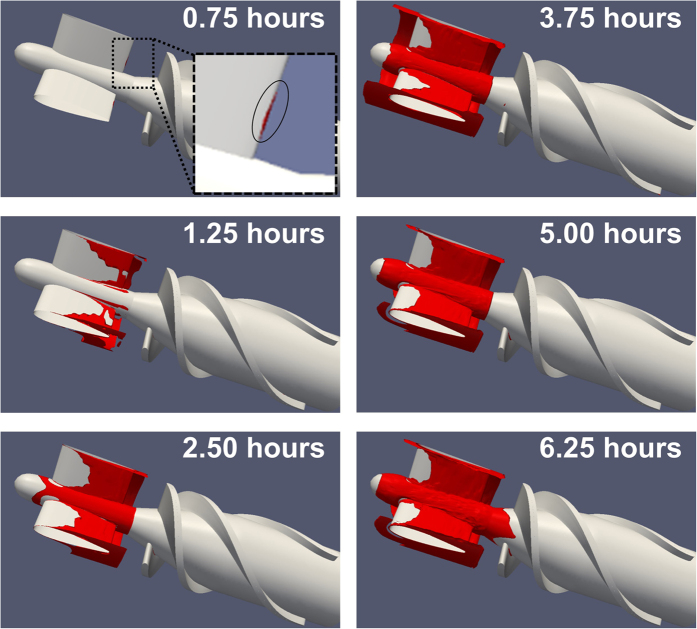
Figure 5 shows the evolution of the thrombus over time, which indicates that the thrombus initiated at the rear of the inlet straightener vane and gradually propagated both downstream into the bearing region and upstream along the straightener blades. The initial thrombus deposition provides a substrate for attachment of incoming platelets and generates biochemical agonists that activate surrounding platelets. This positive feedback is also illustrated in Fig. 6 which provides a quantification of the total accumulation of deposited platelets in different regions of the pump as a function of time. It can be observed that deposition in the stator and bearing regions exhibits an interesting phenomenon that during the initial 1.25 hours, the thrombus accumulation is quite slow but accelerates after the thrombus accumulation reaches a critical level. Conversely, the deposition on the impeller surfaces never achieves a critical level of deposition (within the duration of our simulation, namely 6.25 hr).
Figure 5. Progression of thrombus deposition in the upstream portion of the HeartMate II blood pump, corresponding to 0.75, 1.25, 2.50, 3.75, 5.00 and 6.25 hours in real-time.
(For a flow rate of 4.5 L/min, and a rotational speed of impeller of 9000 RPM).
Figure 6. Thrombus accumulation in the three regions of the blood pump for a flow rate of 4.5 LPM and a rotational speed of 9000 RPM.
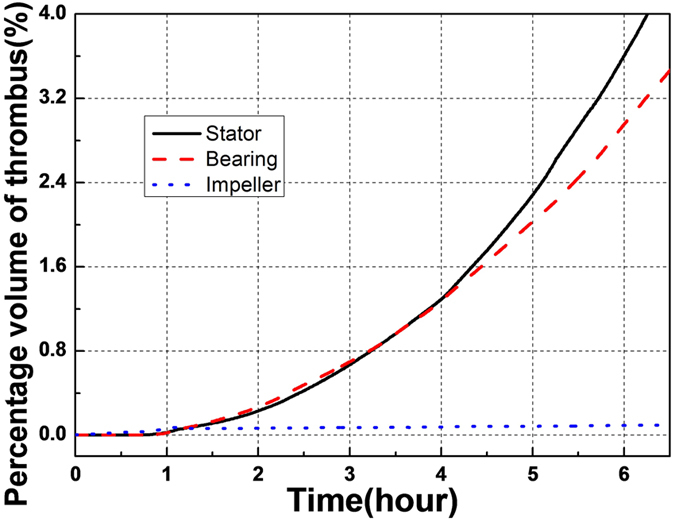
Percentage volume of thrombus here refers to the proportion of the fluid subdomain occupied by thrombus.
Effect of the flow rate on pump thrombosis
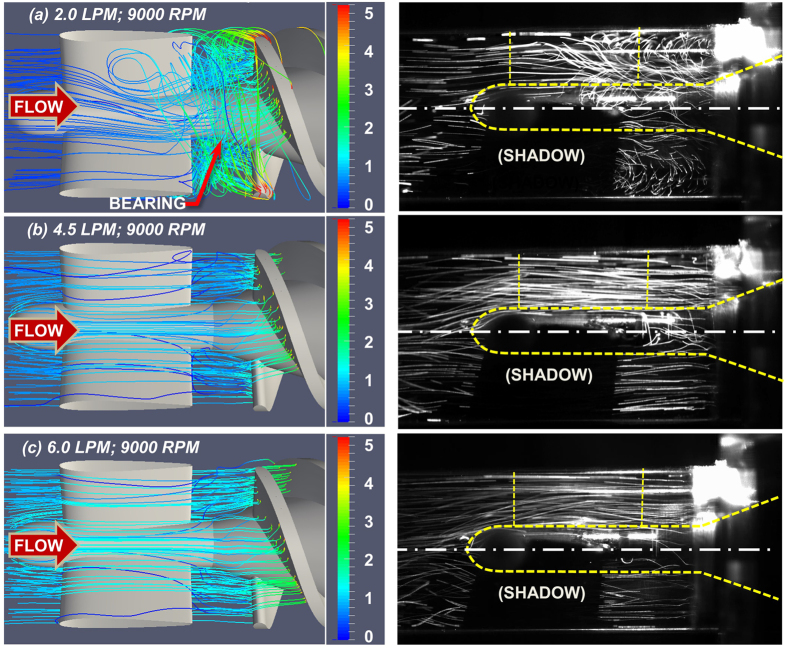
To evaluate the influence of off-design conditions on thrombus deposition, simulations were performed for three different volumetric flow rates: the nominal flow rate (4.5 LPM), a lower flow rate (2.0 LPM), and a greater flow rate (6.0 LPM), while maintaining the rotational speed at 9000 RPM. The simulated velocity fields correspond to in-vitro experimental observations reported previously by flow visualization21 (See Fig. 7).
Figure 7. Numerical simulation (left) and fluorescent particle path lines (right).
21 in the upstream region of the HeartMate II flow path. The rotational speed is 9000 RPM in all three cases. Path lines are colored by velocity magnitude (m/s). (Experimental images published with permission).
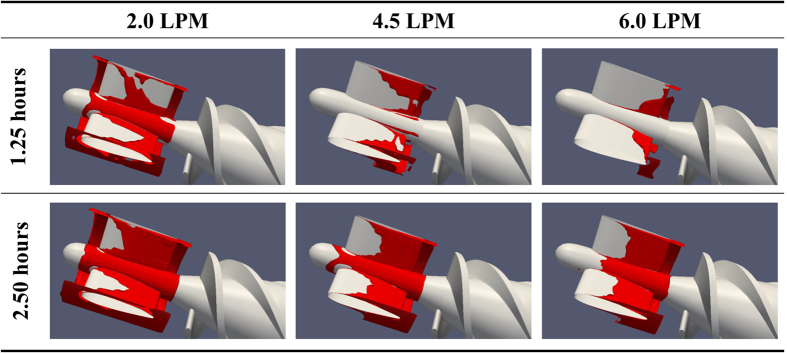
Figure 8 shows the thrombus deposition in the straightener vane and bearing regions for the three volumetric flow rates studied. It can be observed that the rate of the thrombus deposition is inversely related to the flow rate. By referring to Fig. 9 and Table 2, which illustrate the axial distribution of the total thrombus deposition (at 6.25 h), it is clear that increasing the flow rate above the nominal flow rate (from 4.5 to 6.0 LPM) reduces the deposition in the stator and bearing regions uniformly. However, a reduction of the flow rate (from 4.5 to 2.0 LPM) both increases the overall deposition and significantly amplifies the deposition at the leading and trailing edges of the stator blade. Furthermore, this low flow rate causes deposition to initiate at the trailing edge of the impeller blade.
Figure 8. Thrombus deposition in the flow straightener and the impeller for three flow rates.
For a rotational speed of 9000 RPM in all three cases.
Figure 9. Thrombus accumulation (at t = 6.25 hours) along axial direction at different flow rates with 9000 RPM.
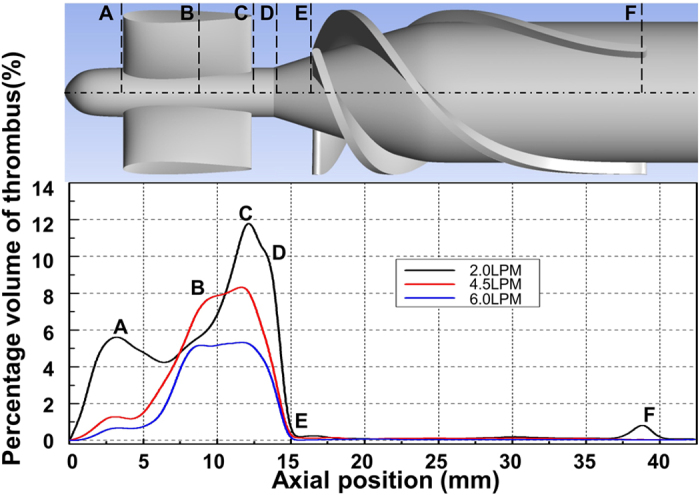
The percentage volume of thrombus here is the proportion of the local fluid domain along axial direction occupied by thrombus. The axial position of the lines shown in the figure are: A = 3.8 mm, B = 8.0 mm, C = 12.9 mm, D = 14.2 mm, E = 16.5 mm and F = 39.0 mm.
Table 2. Thickness of thrombus (mm) after 6.25 hours at different axial positions (See Fig. 9).
| FLOW | A | B | C | D | E | F | |
|---|---|---|---|---|---|---|---|
| Hub | 2.0 LPM | 0.155 | 0.170 | 0.190 | 0.200 | 0.05 | <0.001 |
| 4.51 LPM | 0.105 | 0.150 | 0.152 | 0.166 | 0.019 | 0.000 | |
| 6.0 LPM | 0.065 | 0.100 | 0.123 | 0.120 | <0.001 | 0.000 | |
| Shroud | 2.0 LPM | 0.200 | 0.050 | 0.360 | 0.370 | 0.000 | <0.001 |
| 4.5 LPM | 0.024 | 0.060 | 0.200 | 0.200 | 0.000 | 0.000 | |
| 6.0 LPM | 0.000 | 0.060 | 0.120 | 0.190 | 0.000 | 0.000 | |
| Blade | 2.0 LPM | N/A | 0.140 | N/A | N/A | N/A | 0.050 |
| 4.5 LPM | N/A | 0.090 | N/A | N/A | N/A | 0.000 | |
| 6.0 LPM | N/A | 0.090 | N/A | N/A | N/A | 0.000 |
Effect of heparin and material chemistry on pump thrombosis
Additional simulations were performed to investigate the beneficial effects of altering the chemistry of the blood-wetted surfaces and the addition of heparin. Figure 10 provides simulation results of the total platelet deposition as a function of time for two hypothetical test cases corresponding to a bolus infusion of heparin, and substitution of the Ti6Al4V blood-contacting material with MPC (2-methacryloyloxyethyl phosphorylcholine). In the former case, the circulating heparin was increased from the baseline level 0.1 nmol/m3 to 0.3 nmol/m3 (corresponding approximately to a bolus infusion of 80 IU/kg). The latter case was simulated by reducing the platelet-surface deposition rate, kapdb, and platelet-surface cleavage (shear cleaning) constant, τscb, by a factor of 10. Figure 10 illustrates a dramatic reduction of the deposition rate due to the administration of heparin, and virtually complete elimination of deposition due to combined effect of MPC coating and heparin.
Figure 10. Effect of heparin and pump surface chemistry on thrombus accumulation.
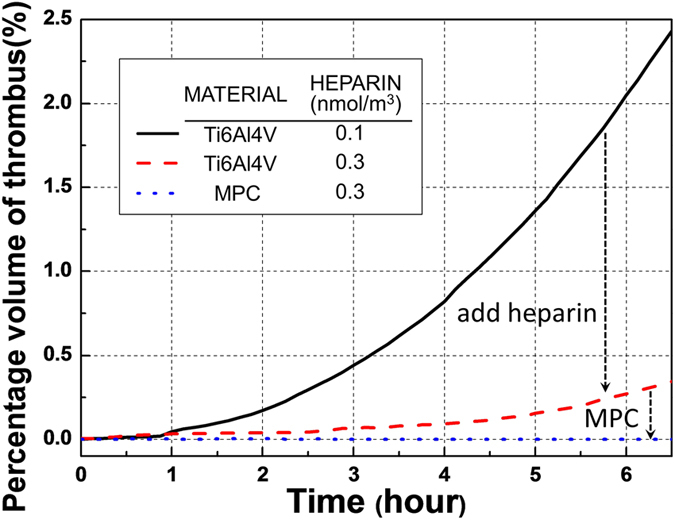
The percentage volume of thrombus here is the ratio of the entire fluid domain occupied by thrombus.
Discussion
The factors responsible for the recent escalation of thrombosis in the HeartMate II have evaded a definitive explanation5. This illustrates a persisting problem when developing any blood-wetted device. Despite best efforts to mitigate thrombosis during pre-clinical in-vivo validation and verification, new, unanticipated risk factors are revealed when introduced to humans. Unfortunately, there is no animal model that accurately reflects the milieu of pro-thrombotic factors that exists in patients with severe heart failure and multiple co-morbidities. Yet, in the clinical setting it is neither feasible, nor ethical, to investigate the myriad of independent device-related and patient-related variables that contribute to thrombosis. Hence is the motivation for a mathematical model: to enable virtual experimentation in-silico wherein hypotheses can be tested and treatments optimized rapidly, inexpensively, and without unwittingly injuring patients.
Over the past decades, a great deal of effort has been expended by many investigators to improve the performance of computational fluid dynamic models for continuous flow blood pumps22,23,24. Likewise great progress has been made in uncovering the mechanisms and feedback pathways for platelet activation and interaction with biomaterial surfaces25,26,27,28. Although some pathways (e.g. involving vonWillebrand factor) are not yet fully understood, there is now a great opportunity to combine the latest models of hemodynamics, platelet activation, transport, and anticoagulation into one high-fidelity model of thrombosis.
This is not meant to dismiss the value of less complicated approaches. For example, examination of flow patterns alone can reveal regions of flow recirculation and stagnation that are potentially thrombogenic. This can be accomplished both experimentally, through flow visualization, or numerically through computational fluid dynamics analysis. For instance, a recent CFD study by Chiu et al.29 performed a qualitative analysis of particle pathlines in the HeartMate II, and observed correlations between regions of recirculation zones and stagnant platelet trajectories with reported thrombus formation patterns. Yang et al.21 performed an analogous high-speed flow visualization of the upstream region of the HeartMate II under unsteady conditions, observing a toroidal vortex near the front bearing that corresponds to the thrombus deposition reported clinically. Both experimental and numerical analyses can elucidate an increased risk of thrombosis, but cannot provide definitive insight to the individual roles of hemodynamics, surface chemistry, and blood elements. Consequently, it is not uncommon for devices to be explanted from patients completely free of thrombus – despite the prevalence of pro-thrombotic flow patterns.
The interpretation of the thrombogenic potential of flow patterns is not trivial because they are highly three-dimensional, unsteady, and often chaotic. For example, it was somewhat counter-intuitive that the initial thrombus deposition in the present study occurred at the trailing edge of the stator blade, rather than within the large toroidal vortex. This finding is however consistent with clinically reported observations18. It was also surprising to observe that the thrombus propagates upstream, a phenomenon also observed in our previous simulation of thrombus growth at a site of injury in a blood vessel9 and corroborated by experimental observations30. This emphasizes the fact that thrombosis is caused by multiple interacting factors as espoused by Virchow’s triad.
An alternative approach to quantify the thrombogenic potential of the HeartMate II was reported by Girdhar et al.31 who employed the thrombogenicity emulation (DTE) methodology based on the shear-loading history of platelets31,32. This is a Lagrangian approach which computes the cumulative platelet activation level for a large representative population of platelets that traverse through the device. This model thereby combines aspects of both the hemodynamics (flow patterns) and the kinetics of platelet activation. However, it does not include a mechanism for deposition, and therefore does not predict the location within the pump where platelets are likely to deposit or accumulate. This model is also unable to distinguish between “bad” and “good” shear stress. On the one hand, shear exposure has an agonistic effect on platelet activation, but on the other hand it is well known that shear stress is needed to remove or clear agonists or platelets from regions of stagnation. This is often referred to as “washing” of blood-contacting surfaces33,34,35,36. The model presented in this report, in contrast, was able to predict that the impeller is free of thrombus while the upstream region experiences unbounded thrombus deposition – despite a similar concentration of active platelets in both regions.
From a design perspective it is impossible to create a rotodynamic pump with a perfectly laminar, attached flow field devoid of supra-physiological shear stress, while still performing its useful and intended function of generating pressure and flow. Therefore, every design must seek a compromise. For example, one unsolved challenge is to assess the influence of flow pulsatility caused by the cyclical contribution of the heart. For portions of the cardiac cycle the flow may be well behaved and attached, while during portions of the diastolic phase, the flow may become chaotic21. A confounding question for the designer is to determine whether the degree of chaotic flow is tolerable and for what period of time. The numerical simulation here provides a tool to address this challenge. For example, the time-course of thrombus growth in the upstream region, illustrated in Figs 5 and 6, indicates that once there is a critical amount of deposition, there is a positive-feedback effect that causes the platelets to deposit at a greater rate. This is due to the increased concentration of adhesive sites for incoming platelets and the release of platelet synthesized agonists, including ADP and TxA2. Likewise, the absence of thrombus deposition in the impeller can be explained by examining the relative influence of the transport terms of the equations which suggest that there is an equilibrium between deposition and erosion (washing) that interrupts this positive feedback. Therefore, this model could be used to simulate various scenarios of flow pulsatility to determine the critical conditions in which the rate of washing exceeds the rate of accumulation or deposition.
The model used in this study was the product of many years of evolution and has grown rather complex, preventing us from presenting all the details here. The interested reader is referred to a recent validation study by Wu et al. which explains all of the mathematical terms, origins of the coefficients, and the main assumptions9,10. Despite its sophistication, we acknowledge several remaining limitations, including (1) omission of plasma skimming, (2) high computational cost, (3) lack of experimental/clinical validation on the effect of heparin and surface chemistry on pump thrombosis and (4) absence of some potentially relevant pathways of coagulation as well as thrombolysis. The first assumption is justified throughout the majority of the flow field; however, cellular trafficking in regions of small features, such as crevices at the interface between rotating and non-rotating bearing elements, may possibly enhance the concentration of platelets near the surface9. Due to the fact that crevices may serve as a nidus for thrombus growth, the study of their effect will receive attention in our future work. The high computational cost of the model limited the number of simulations performed in this study, as well as their duration. Therefore, future work will also explore the possibility of substituting reduced-order models for some of the mechanisms to speed up the numerical process. This will also permit simulations to be performed for longer durations and possibly achieve an equilibrium wherein thrombus growth subsides. We will also consider a design-of-experiments approach to explore the matrix of independent variables – related to flow pulsatility, surface chemistry, hematology, and anticoagulation – more systematically and efficiently. Such a parametric study will provide additional validation of the model for a wider range of conditions beyond those presented here. We recognize one additional limitation of this study is our choice to scale the reaction rate for the sake of computational convenience (i.e. reduce the simulation to 5 days). However, the effect is limited due to the magnitude of the Damkohler (Da) number which exceeds 106 for all 10 species.
We also acknowledge that this study focused on one specific device, the HeartMate II, which will inevitably be supplanted by next-generation devices with a lower incidence of thrombosis. However, we believe that the lessons learned from this study are readily applicable to many other rotodynamic VADs, for example, the HVAD (HeartWare, Framingham, MA)37,38 which reported in April of 2015 a stroke rate of 27% per patient-year and an astonishing 45% stroke rate at 2 years38. Most recently, complications of thrombosis caused HeartWare to interrupt the clinical trial of their next-generation MVAD device8,39. For those VADs currently in clinical use, the model may be used by physicians to explore the influence of hypothetical interventions, such as a change in speed, introduction of pulsatility, hemodilution, and various anticoagulation regimens. We also hope that device developers and manufacturers would find this thrombosis model useful for optimizing future ventricular assist devices that are increasingly safe and effective.
Additional Information
How to cite this article: Wu, W.-T. et al. High fidelity computational simulation of thrombus formation in Thoratec HeartMate II continuous flow ventricular assist device. Sci. Rep. 6, 38025; doi: 10.1038/srep38025 (2016).
Publisher's note: Springer Nature remains neutral with regard to jurisdictional claims in published maps and institutional affiliations.
Acknowledgments
This research was supported by NIH grant 1 R01 HL089456.
Footnotes
Author Contributions W.-T.W. developed the mathematical model and CFD code, performed the simulations and contributed to the preparation of the manuscript. F.Y. performed the flow visualization. J.W. contributed to the generation of the pump geometry and mesh. N.A., M.M. and J.F.A. provided supervision of W.-T.W. J.F.A. contributed to the preparation of the manuscript and provided supervision of F.Y. All the authors contributed to the editing of the manuscript.
References
- Starling R. & Gorodeski E. In Mechanical circulatory support: a companion to Braunwald’s heart disease. (ed. Elsevier) 11–21 (2011). [Google Scholar]
- Krishnamani R., DeNofrio D. & Konstam M. A. Emerging ventricular assist devices for long-term cardiac support. Nat. Rev. Cardiol. 7, 71–76 (2010). [DOI] [PubMed] [Google Scholar]
- Kirklin J. K. et al. Interagency Registry for Mechanically Assisted Circulatory Support (INTERMACS) analysis of pump thrombosis in the HeartMate II left ventricular assist device. J. Heart Lung Transplant. 33, 12–22 (2014). [DOI] [PubMed] [Google Scholar]
- Starling R. C. et al. Unexpected abrupt increase in left ventricular assist device thrombosis. N. Engl. J. Med. 370, 33–40 (2014). [DOI] [PubMed] [Google Scholar]
- Jeffries N. et al. What is the truth behind pump thrombosis in the HeartMate II device? A National Heart, Lung, and Blood Institute perspective based on data from the Interagency Registry for Mechanically Assisted Circulatory Support. J. Heart Lung Transplant. 34, 1505–10 (2015). [DOI] [PubMed] [Google Scholar]
- Kirklin J. K. et al. Pump thrombosis in the Thoratec HeartMate II device: An update analysis of the INTERMACS Registry. J. Heart Lung Transplant. 34, 1515–26 (2015). [DOI] [PubMed] [Google Scholar]
- Blitz A. Pump thrombosis-A riddle wrapped in a mystery inside an enigma. Ann. Cardiothorac. Surg. 3, 450–71 (2014). [DOI] [PMC free article] [PubMed] [Google Scholar]
- Cipriano M. HeartWare Pauses Enrollment in Clinical Trial of MVAD Heart Pump | FDANews. (2015). Available at: http://www.fdanews.com/articles/173075-heartware-pauses-enrollment-in-clinical-trial-of-mvad-heart-pump. (Accessed: 11th September 2015).
- Wu W.-T., Aubry N., Massoudi M., Wagner W. R. & Antaki J. F. Multi-Constituent Simulation of Thrombus Deposition. ArXiv 1–17 (2016). [DOI] [PMC free article] [PubMed] [Google Scholar]
- Wu W.-T. Theoretical and Computational Studies on Thrombus Formation and Multiphase Characteristics of Blood Flow. Mechanical Engineering Ph.D. (Carnegie Mellon University, 2015). [Google Scholar]
- Pope S. B. Turbulent Flows. Meas. Sci. Technol. 12, 2020–2021 (2001). [Google Scholar]
- Johnson G., Massoudi M. & Rajagopal K. R. Flow of a fluid—solid mixture between flat plates. Chem. Eng. Sci. 46, 1713–1723 (1991). [Google Scholar]
- Wu W.-T., Yang F., Antaki J. F., Aubry N. & Massoudi M. Study of blood flow in several benchmark micro-channels using a two-fluid approach. Int. J. Eng. Sci. 95, 49–59 (2015). [DOI] [PMC free article] [PubMed] [Google Scholar]
- Wu W.-T., Aubry N. & Massoudi M. On the coefficients of the interaction forces in a two-phase flow of a fluid infused with particles. Int. J. Non. Linear. Mech. 59, 76–82 (2014). [Google Scholar]
- Sorensen E. N., Burgreen G. W., Wagner W. R. & Antaki J. F. Computational simulation of platelet deposition and activation: II. Results for Poiseuille flow over collagen. Ann Biomed Eng 27, 449–458 (1999). [DOI] [PubMed] [Google Scholar]
- Sorensen E. N., Burgreen G. W., Wagner W. R. & Antaki J. F. Computational simulation of platelet deposition and activation: I. Model development and properties. Ann Biomed Eng 27, 436–448 (1999). [DOI] [PubMed] [Google Scholar]
- Ferziger J. H. & Peric M. Computational Methods for Fluid Dynamics. Vasa (Springer Science & Business Media, 2002). [Google Scholar]
- Najib M. Q., Wong R. K., Pierce C. N., DeValeria P. A. & Chaliki H. P. An unusual presentation of left ventricular assist device thrombus. Eur. Hear. J. Cardiovasc. Imaging 13, 532 (2012). [DOI] [PubMed] [Google Scholar]
- Mokadam N. A., Andrus S. & Ungerleider A. Thrombus formation in a HeartMate II. Eur. J. Cardio-Thoracic Surg. 39, 414 (2011). [DOI] [PubMed] [Google Scholar]
- Meyer A. L. et al. Thrombus formation in a HeartMate II left ventricular assist device. J. Thorac. Cardiovasc. Surg. 135, 203–204 (2008). [DOI] [PubMed] [Google Scholar]
- Yang F., Kormos R. L. & Antaki J. F. High-speed visualization of disturbed pathlines in axial flow ventricular assist device under pulsatile conditions. J. Thorac. Cardiovasc. Surg. 150, 938–944 (2015). [DOI] [PMC free article] [PubMed] [Google Scholar]
- Zhang J., Zhang P., Fraser K. H., Griffith B. P. & Wu Z. J. Comparison and experimental validation of fluid dynamic numerical models for a clinical ventricular assist device. Artif. Organs 37, 380–9 (2013). [DOI] [PMC free article] [PubMed] [Google Scholar]
- Burgreen G. W., Antaki J. F., Wu Z. J. & Holmes A. J. Computational Fluid Dynamics as a Development Tool for Rotary Blood Pumps. Artif. Organs 25, 336–340 (2001). [DOI] [PubMed] [Google Scholar]
- Wu J., Antaki J. F., Verkaik J., Snyder S. & Ricci M. Computational Fluid Dynamics-Based Design Optimization for an Implantable Miniature Maglev Pediatric Ventricular Assist Device. J. Fluids Eng. 134, 41101 (2012). [Google Scholar]
- Mehrabadi M., Casa L. D. C., Aidun C. K. & Ku D. N. A Predictive Model of High Shear Thrombus Growth. Ann. Biomed. Eng. (2016). [DOI] [PubMed] [Google Scholar]
- Herbig B. A. & Diamond S. L. Pathological von Willebrand factor fibers resist tissue plasminogen activator and ADAMTS13 while promoting the contact pathway and shear-induced platelet activation. J. Thromb. Haemost. 13, 1699–1708 (2015). [DOI] [PMC free article] [PubMed] [Google Scholar]
- Eckman P. M. & John R. Bleeding and thrombosis in patients with continuous-flow ventricular assist devices. Circulation 125, 3038–47 (2012). [DOI] [PubMed] [Google Scholar]
- Kenny D., Morateck P. A., Gill J. C. & Montgomery R. R. The critical interaction of glycoprotein (GP) IBbeta with GPIX-a genetic cause of Bernard-Soulier syndrome. Blood 93, 2968–75 (1999). [PubMed] [Google Scholar]
- Chiu W.-C., Slepian M. J. & Bluestein D. Thrombus Formation Patterns in the HeartMate II Ventricular Assist Device: Clinical Observations Can Be Predicted by Numerical Simulations. ASAIO J. 60, 237–40 (2014). [DOI] [PMC free article] [PubMed] [Google Scholar]
- Begent N. & Born G. V. R. Growth rate in vivo of platelet thrombi, produced by iontophoresis of ADP, as a function of mean blood flow velocity. Nature 227, 926–930 (1970). [DOI] [PubMed] [Google Scholar]
- Girdhar G. et al. Device thrombogenicity emulation: A novel method for optimizing mechanical circulatory support device thromboresistance. PLoS One 7 (2012). [DOI] [PMC free article] [PubMed] [Google Scholar]
- Bluestein D., Chandran K. B. & Manning K. B. Towards non-thrombogenic performance of blood recirculating devices. in Annals of Biomedical Engineering 38, 1236–1256 (2010). [DOI] [PMC free article] [PubMed] [Google Scholar]
- Tovar-Lopez F. J. et al. A microfluidics device to monitor platelet aggregation dynamics in response to strain rate micro-gradients in flowing blood. Lab Chip 10, 291–302 (2010). [DOI] [PubMed] [Google Scholar]
- Jamiolkowski M. A., Pedersen D. D., Wu W.-T., Antaki J. F. & Wagner W. R. Visualization and analysis of biomaterial-centered thrombus formation within a defined crevice under flow. Biomaterials 96, 72–83 (2016). [DOI] [PMC free article] [PubMed] [Google Scholar]
- George J. N., Thoi L. L. & Morgan R. K. Quantitative analysis of platelet membrane glycoproteins: Effect of platelet washing procedures and isolation of platelet density subpopulations. Thromb. Res. 23, 69–77 (1981). [DOI] [PubMed] [Google Scholar]
- Brami B. In Advances in Cardiovascular Engineering 229–236 (Springer: US, 1992). [Google Scholar]
- Pagani F. D. et al. HeartWare HVAD for the Treatment of Patients With Advanced Heart Failure Ineligible for Cardiac Transplantation: Results of the ENDURANCE Destination Therapy Trial. J. Hear. Lung Transplant. 34, S9 (2015). [Google Scholar]
- Najjar S. S. et al. An analysis of pump thrombus events in patients in the HeartWare ADVANCE bridge to transplant and continued access protocol trial. J. Hear. Lung Transplant. 33, 23–34 (2014). [DOI] [PubMed] [Google Scholar]
- Research Z. E. HeartWare Updates on MVAD Trial Enrollment, Stock Down. Available at: https://www.zacks.com/stock/news/193610/heartware-updates-on-mvad-trial-enrollment-stock-down. (Accessed: 14th October 2015) (2015).


