Abstract
Worldwide, hemodialysis (HD) constitutes the most common form of renal replacement therapy. Many studies have shown strong correlation between HD dose and clinical outcome. The cross-sectional study was conducted on 100 patients in Hemodialysis Unit at Tanta University Hospital, Egypt. Data were collected using a reliable questionnaire (including clinical, demographic, dialysis, laboratory, and radiological data). SpKt/V was used to assess the adequacy of HD. The results revealed inadequate HD dose among 60% of the study population. The results also showed that increasing time and frequency of dialysis, blood flow rates, low recirculation percentages, reduction of intradialytic complaints, and well-functioning vascular access are associated with better HD adequacy. Our findings showed a positive correlation between dialysis dose and hemoglobin, serum albumin, normalized protein catabolic rate, and physical health. A great percentage of patients had inadequate HD. HD adequacy was influenced by several factors such as duration and frequency of dialysis session, patients’ complaints, and well-functioning vascular access.
Keywords: Adequacy, dialysis session, hemodialysis
Introduction
End-stage renal disease (ESRD) is an irreversible, condition for which patients require treatment with dialysis or kidney transplantation to survive.[1] It is a major outcome of chronic kidney disease with an important effect on the quality of life (QOL) and health resource utilization. In addition to costs, a large number of patients die of cardiovascular diseases prior to the initiation of renal replacement therapy (RRT).[2] Hemodialysis (HD) is one of the main modalities of RRT.[3]
Even though HD treatment is successful to ameliorate many of the clinical manifestations of ESRD and to postpone otherwise imminent death, HD patients still have higher mortality and hospitalization as well as lower QOL compared with the general population.[4]
The concept of quality, adequacy, or appropriateness of HD, which were introduced in the 1970s, implies dialysis which enables patients to have a normal QOL as well as solid clinical tolerance with minimal problems during the dialysis and interdialysis periods.[5] Quantification of the dialysis dose is an essential element in the management of chronic HD treatment because the adequacy of the dose has a profound effect on the patient morbidity and mortality.[6]
The aim of this work was to evaluate HD adequacy in patients with ESRD in the Hemodialysis Unit at Tanta University Hospital to identify the prevalence and causes of inadequate HD among those patients and the impact of adequacy on other parameters that affects patients’ outcomes as anemia, nutritional state, health-related QOL, and blood pressure.
Patients and Methods
This study was carried out on 100 stable patients with ESRD undergoing regular HD for more than 6 months. Patients who were on regular HD for 6 months (at least) using arteriovenous fistula (AVF) in Hemodialysis Unit at Tanta University Hospital. Patients who were not maintained on regular HD and patients use central venous catheters or arteriovenous grafts were excluded.
The patients were divided into two groups according to Kt/V values. Group I Included patients with Kt/V ≥1.2 who were considered to have adequate dialysis dose and group II hadpatients with Kt/V <1.2 (inadequate dialysis dose).
All patients were subjected to full history taking, complete physical examination, and laboratory investigations include blood urea nitrogen (BUN) (predialysis and postdialysis), serum albumin, hemoglobin (Hb) level, and urea reduction ratio (URR) using this formula:[7]
URR =(predialysis BUN – postdialysis BUN)/predialysis BUN
Kt/V calculation using the second generation Daugirdas formula:[8]
Single – pool Kt/V= −In (R −0.008 ×t) +(4 – 3.5 × R) × UF / W
Where In represents the natural logarithm, R is the ratio of postdialysis to predialysis BUN, t is the length of a dialysis session in hours, UF is the ultrafiltration volume in liters, and W is the patient's postdialysis weight in kilograms.
Calculation of vascular access recirculation using this formula:[9]
Recirculation % = ([S − A]/[S − V])× 100
S, A, and V refer to the systemic urea concentrations in the peripheral blood, blood entering the arterial line, and postdialyzer venous circuit, respectively.
Calculation of normalized protein catabolic rate (nPCR) using this formula:[10]
nPCR = (0.0136 × F) + 0.251
where
F = Kt/V ×([predialysis BUN+postdialysis BUN]/2)
HD prescription was revised to detect blood flow rate (BFR), ultrafiltration volume (UF volume), effective surface area of the dialyzer, and venous pressure.
Assessment of health-related quality of life
A QOL questionnaire assessment, brief version of the World Health Organization QOL (WHOQOL-BREF) (The WHOQOL Group, 1996), which is a well-documented scoring system that has been used as a QOL tool for the general population as well as the patients on maintenance HD, was submitted to every patient, and a self-assessment of QOL was then measured by WHOQOL-BREF. For patients who could not read or write Arabic, the questionnaire was administered with the assistance of an interpreter. The four domains defined for the WHOQOL-BREF, viz physical health, psychological health, social relationships, and environment were assessed. The raw score of each domain was then transferred to a standardized score of 0–100 to maintain uniformity in the scores. Higher scores mean the better QOL of the patients. The QOL index of each domain and their correlations with dialysis dose (Kt/V) were assessed.
The type of dialyzer membrane used was low-flux, polysulphone hollow fiber hemodialyzer (Haidylena, Advanced Medical Industries, Giza, Egypt) with surface area of 1.3 and 1.6 m2.
Results
In Group I, the number of patients was 40 while the number of patients of Group II was 60. All patients in Group I (Kt/V ≥1.2) had URR ≥65% and those in Group II (Kt/V <1.2) had URR <65%. The correlation between dialysis dose (Kt/V) and URR is significant (P < 0.01) [Figure 1].
Figure 1.
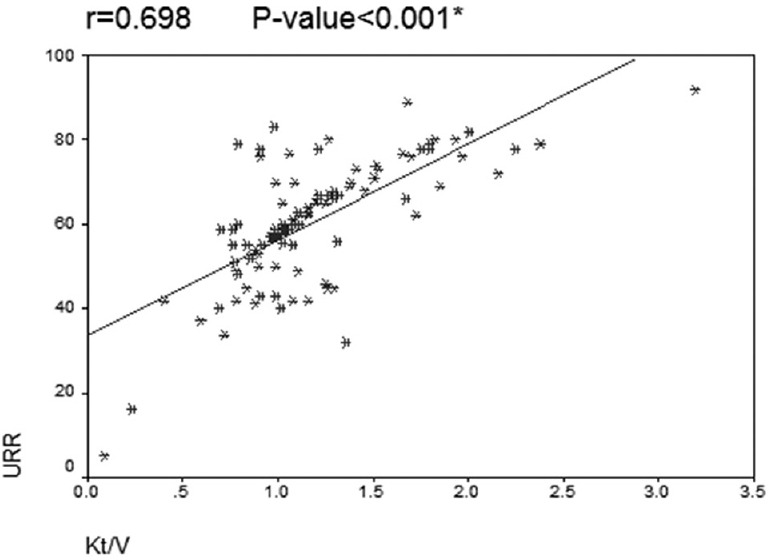
Correlation between Kt/V and urea reduction ratio
The age of the study population was 53.04 ± 14.7 years. The difference in clearance rates among the various age groups was statistically insignificant (P = 0.103). The highest clearance rates were observed among age group 31–45 years, which represent around 15% of the study population.
A strong association between higher clearance rates and increased dialysis duration of each session (4 h; 78.9%), frequency of dialysis per week (3 times/week; 46.8 %), and BFR (>300 ml/min; 63.3%) was noted and differences for both variables were statistically significant (P = 0.001, 0.012, and 0.003, respectively).
Kt/V values and effective surface area of the dialyzer
Our study population was placed on the two different membrane size filters (1.3 and 1.6 m2). When these two groups compared with regard to their clearance rates, 70% of those who were on 1.6 m2 were with a Kt/V value of ≥1.2 compared to only 32.5% among those who were on 1.3 m2. Differences in the clearance rates were statistically significant (P = 0.005).
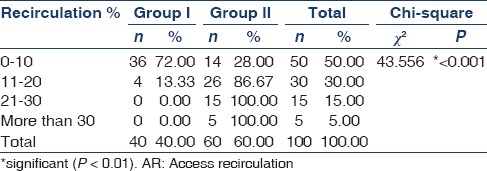
Low recirculation resulted in better dialysis adequacy (0–10%; 72% with Kt/V ≥1.2).
There was a clear trend of improvements in Kt/V values with increased UF rate. This was evident from the findings of Kt/V values of ≥1.2 with frequencies of 16.7, 33.3, 35.9, and 64% among those with UF volumes of 1–0, 1.1–2, 2.1–3, and 3.1–4 L/dialysis session, respectively. However, decrease in clearance rate was noted in patients with UF volume >4 L as only 22.2% of them showed Kt/V value ≥1.2. Differences in the clearance rates were statistically insignificant (P = 0.056).
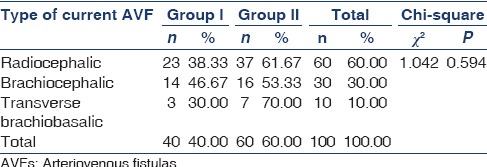
Diabetic nephropathy was the most common cause of ESRD and represented 30% of our study population with a clearance rate of 30% (Kt/V ≥1.2). Hypertension was represented by 28% of the study population. Also, the results showed that 60% of the study population was dialyzed from radiocephalic fistulas and 38.3% of them were with Kt/V value ≥1.2. Better clearance rates were found in association with absence of patient complaints and vascular access complications. The results showed also strong positive relationship between dialysis dose and the following parameters as Hb (mean Hb = 10.66 ± 2.15) g/dl, serum albumin (mean albumin = 4.32 ± 0.79) g/dl, nPCR (mean nPCR = 0.91 ± 0.27) g/Kg/day, and scoring of physical domain of WHOQOL-BREF (physical health).
Hypotension was found to be the more frequent complaint during dialysis treatments, the results showed that 23% of the study population complained of hypotension and 39% had a Kt/V value ≥1.2. Cramps were reported by 8% while 19% of the patients reported complaint of dizziness. Dizziness found to be the second frequent complaint during dialysis treatments, and patients in this group were with the lowest clearance rate (36.84%; Kt/V ≥1.2).
Differences in Kt/V values among these different complications during dialysis session among the study population were statistically insignificant (P = 0.997).
Discussion
Over the past ten years, published data indicated that survival of dialysis patients is strongly associated with delivered dialysis dose.[11] Improvements in the survival rates at higher dialysis doses were reported with all major causes of mortality including coronary heart disease, other cardiac diseases such as stroke and infection. This observation is compatible with the hypothesis that low doses of dialysis may promote atherosclerosis, infection, malnutrition, and failure to thrive.[12]
At present, HD dose is quantified by the Kt/V, which measures urea removal during treatment and a single pool Kt/V of 1.2 is considered as adequate dose.[13] The primary data from the National Cooperative Dialysis Study showed that Kt/V <0.8 was associated with a high morbidity, whereas Kt/V values between 1.0 and 1.2 were associated with better outcome.[6]
As regard dialysis adequacy, results of this study revealed that about 60% of the study population had Kt/V <1.2, indicating that patients were receiving inadequate dose.
These results were in agreement with similar findings to those carried out in other developing countries such as Brazil, Nigeria, Nepal, Pakistan, and Iran (about 55–65% of patients had a Kt/V <1.2).[14] On the other hand, the results of the present study were in disagreement with those reported from developed countries as the United States according to the 2007 annual report, over 90% of the patients had a Kt/V >1.2.[15]
As regard, the relationship between Kt/V and URR revealed that all patients with spKt/V ≥1.2 had URR ≥65%. These results were in agreement with Afshar et al.,[16] who found statistically strong correlation between URR and eKt/V (P < 0.001). On the other hand, our results were in disagreement with the study of De Oreo and Hamburger[17] who reported a poor correlation between URR and Kt/V in 942 patients when both values were measured simultaneously.
Increased BFR was found to associated with increased rate of clearance [Table 1]. This was clear from the findings of Kt/V values ≥1.2 (200–250 ml/min, 20%; 251–300 ml/min, 35.6%; more than 300 ml/min, 63.3%). The difference in clearance rates among the various groups of BFRs was statistically significant. These results were in agreement with the study of Kim et al.,[18] Borzou et al.,[19] Ward,[20] Port et al.[21] On the other hand, our results were in disagreement with the study of Ghali and Malik,[22] there was no significant effect of increasing BFR on HD adequacy. They assigned their results to the effect of other different factors affecting dialysis adequacy as malnutrition, anemia, short dialysis sessions, premature cessation of sessions of HD, infection, inadequate blood flow from vascular access, hypotension episodes, technical reasons, and the design of the study and the sample size.
Table 1.
Comparison between Kt/V values in respect of BFRs

As regard the duration of HD session [Table 2], clearance was strongly association with an increased duration time of dialysis process. The difference in the clearance rates among the various duration periods were significant. These results were in agreement with the study of Lambie et al.,[23] who showed that time had a profound effect on dialysis adequacy, indicating the importance of ensuring that patients remain on dialysis for the full time prescribed.[15]
Table 2.
Comparison between Kt/V values in respect of duration of dialysis session
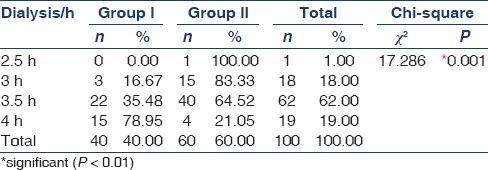
As regard frequency [Table 3], we found improvements in the clearance rates with increased dialysis frequency. The were consistent with previous reports that link improvements in clearance rates and frequency of dialysis.[24]
Table 3.
Comparison between Kt/V values in respect of frequency of sessions/week

As regard UF volume [Table 4], a clear trend of improvements in Kt/V values was seen with increased UF rate (within limits as decrease in clearance rate was noted in patients with UF volume >4 L). Few studies have examined the direct association of UF rate on long-term outcomes in HD patients. The National Co-operative Study on the adequacy of dialysis reported the association between excessive UF and mortality, independent of delivered Kt/V urea recently.[25]
Table 4.
Comparison between Kt/V values in respect of UF volume/session
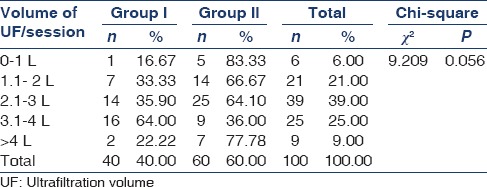
Improvements in Kt/V values increased the dialyzers [Table 5]’ surface area. These results were in agreement with the previous reports on the membrane size and clearance rates which were done by Stivelman et al.[26] and Pascual et al.[27] The use of larger surface area dialyzers permits high rates of urea clearance to be achieved offering the advantage of improving blood purification by removing higher and middle molecular – weight solutes.[27]
Table 5.
Comparison between Kt/V values in respect of dialyzer's surface area

Low recirculation percentage would result in better dialysis adequacy [Table 6]. Differences in Kt/V values among these recirculation groups were statistically significant. These results were in agreement with Santoro[28] who concluded that the form of needle insertion and the distance between the needles should be considered to be the part of the process of recirculation reduction with the classical form presenting the lowest percentages of AR and with unidirectional needles providing satisfactory results as long as the distance between them is 5 cm or more.
Table 6.
Comparison between Kt/V values in respect of percentage of AR
Diabetic and hypertensive nephropathy are the leading underlying etiologies of the ESRD.[29] Diabetes is the leading cause of the ESRD in developed countries, and it accounts for 45% of causes of kidney failure which increases from 18% in 1980.[30] According to Afifi et al.,[31] the prevalence of diabetic nephropathy among ESRD patients in Egypt increased from 8.9% in 1996 to 24.5% in 2003. The data of present study in this respect are consistent with worldwide percentage for the etiology of the ESRD.
Hypotension is one of the most common medical complications seen during the HD. Multiple factors are associated with intradialytic hypotension as excessive UF, anemia, antihypertensive medications, cardiac disease, and errors in the estimation of patient's dry weight.[32] In the current study, hypotension was found to be the most frequent complaint during dialysis treatments, the results showed that 23% of the study population complained of hypotension. These results were in agreement with Sherman.[33]
In the present study [Table 7], AVFs were the vascular access used in all study population as patients with arteriovenous grafts and central vein catheters were previously excluded. These results were in agreement with the 2006 update of Kidney Disease Outcomes Quality Initiative (K/DOQI) guidelines that consider the most distal site possible to permit the maximum number of future possibilities for access so; the radiocephalic fistula is the first choice of access type. Our results showed also that patients who were dialyzed from brachiocephalic fistula had the highest clearance rate (46.67% of them showed a Kt/V ≥1.2) in comparison with the other two groups. These results might be as the brachiocephalic fistula had the higher BFR and easier to cannulate in comparison with radiocephalic and brachiobasilic fistulas, respectively. However, differences in the clearance rates among the different types of AVFs were statistically insignificant (P = 0.594).
Table 7.
Comparison between Kt/V values in respect of vascular access (types of AVFs)
The mean Hb was 10.66 ± 2.15 g/dl in patients of the present study [Table 8]. This value is lower than the recommended DOQI guideline that recommends an Hb of 11–12 g/l. The mean Hb in our study population was lower, compared to other countries: Mean Hb levels were 12 g/dl in Sweden; 11.6–11.7 g/dl in the United States, Spain, Belgium, and Canada; 11.1–11.5 g/dl in Australia, New Zealand, Germany, Italy, the United Kingdom, and France.[34] The factors responsible for the low Hb levels in our patients, compared to the DOQI guidelines and other countries’ Hb levels, are the following: Blood loss, lack of consistent supplies of erythropoietin, and insufficient dialysis dose. There is good evidence that dialysis adequacy has resulted in better control of anemia and other parameters correlating with dialysis adequacy such as hypertension and patients’ nutritional status.[35]
Table 8.
Correlations between dialysis dose (Kt/V) and other variables
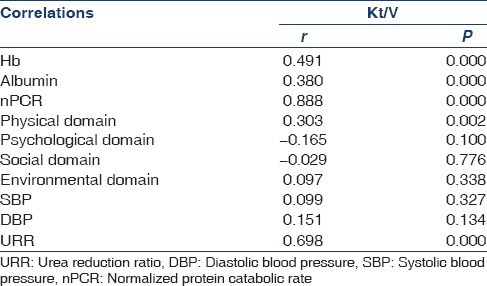
The positive correlation between albumin and adequacy is in agreement with the study of Azar et al.,[36] who showed a strong correlation between serum albumin and Kt/V. This finding suggests also that patients undergoing chronic HD adjust their protein intake automatically according to the dose of HD delivered, probably via an improvement in appetite as a result of the disappearance of uremic symptoms from the digestive system (e.g., nausea, anorexia, and vomiting).
Lindsay and Spanner[37] showed that any attempt to increase the protein intake in patients undergoing HD was unsuccessful if any previous increases in the amount of prescribed HD were not established first. They found also a linear positive correlation between Kt/V and nPCR.
We found a positive correlation between dialysis dose (Kt/V) and scoring of physical domain of WHOQOL-BREF while there was no correlation between dialysis dose (Kt/V) and psychological, social or environmental domain scores. These results were in agreement with the study of Manns et al.,[38] who found out that increase dialysis dose had been associated with a better QOL and the study of Benz et al.,[39] who found out that increase dialysis dose was associated with a decrease number of awakenings at night.
There was no correlation between dialysis dose (Kt/V)and blood pressure. These results were in agreement with the study of McGregor et al.,[40] who did not ascertain any correlation between Kt/V and blood pressure and the study of Rahman et al.,[41] who found out strong correlation between blood pressure and interdialytic weight gain. On the other hand, the results of the present study were in disagreement with Panagoutsos et al.,[35] who found out that a reduction in blood pressure with increased dialysis dose suggesting a central role of increased dialysis dose. Others have also reported similar findings with corresponding increase of dialysis dose.[42]
In summary, the findings of the present study showed clearly that with increasing time and frequency of dialysis, BFRs, low recirculation percentages, reduction of intradialytic complaints, and well-functioning vascular access were associated with better dialysis adequacy.
We recommend that, first, individualizing the HD prescription based on monthly assessment of single-pool Kt/V would be a useful and practical tool to provide a safe and cost-effective HD treatment, second, to ensure that ESRD patients treated with chronic HD receive adequate treatments; the delivered dose of HD needs to be measured monthly. HD centers should have a continuous quality improvement and patient review system in place that recognizes patients who are receiving suboptimal dialysis adequacy, identify the cause, and rectify it, if possible and to assess whether targets are achieved in accordance with DOQI guidelines in an effort to achieve improved long-term outcomes in patients on chronic HD.
Financial support and sponsorship
Nil.
Conflicts of interest
There are no conflicts of interest.
References
- 1.Kramer A, Stel V, Zoccali C, Heaf J, Ansell D, Grönhagen-Riska C, et al. An update on renal replacement therapy in Europe: ERA-EDTA Registry data from 1997 to 2006. Nephrol Dial Transplant. 2009;24:3557–66. doi: 10.1093/ndt/gfp519. [DOI] [PubMed] [Google Scholar]
- 2.Vanholder R, Davenport A, Hannedouche T, Kooman J, Kribben A, Lameire N, et al. Reimbursement of dialysis: A comparison of seven countries. J Am Soc Nephrol. 2012;23:1291–8. doi: 10.1681/ASN.2011111094. [DOI] [PubMed] [Google Scholar]
- 3.Aghighi M, Heidary Rouchi A, Zamyadi M, Mahdavi-Mazdeh M, Rajolani H, Ahrabi S, et al. Dialysis in Iran. Iran J Kidney Dis. 2008;2:11–5. [PubMed] [Google Scholar]
- 4.Hall YN, Jolly SE, Xu P, Abrass CK, Buchwald D, Himmelfarb J. Regional differences in dialysis care and mortality among American Indians and Alaska Natives. J Am Soc Nephrol. 2011;22:2287–95. doi: 10.1681/ASN.2011010054. [DOI] [PMC free article] [PubMed] [Google Scholar]
- 5.Kooman J, Basci A, Pizzarelli F, Canaud B, Haage P, Fouque D, et al. EBPG guideline on haemodynamic instability. Nephrol Dial Transplant. 2007;22(Suppl 2):ii22–44. doi: 10.1093/ndt/gfm019. [DOI] [PubMed] [Google Scholar]
- 6.Gotch FA, Sargent JA. A mechanistic analysis of the National Cooperative Dialysis Study (NCDS) Kidney Int. 1985;28:526–34. doi: 10.1038/ki.1985.160. [DOI] [PubMed] [Google Scholar]
- 7.Andrew S, Jay B. In: Hemodialysis adequacy. Principles and Practice of Dialysis. 4th ed. Ch. 8. Henrich WL, editor. Wolters Kluwer Health: Lippincott Williams and Wilkins Publications; 2009. pp. 106–22. [Google Scholar]
- 8.Daugirdas JT. Simplified equations for monitoring Kt/V, PCRn, eKt/V, and ePCRn. Adv Ren Replace Ther. 1995;2:295–304. doi: 10.1016/s1073-4449(12)80028-8. [DOI] [PubMed] [Google Scholar]
- 9.III NKF-K/DOQI Clinical practice guidelines for vascular access: Update 2000. Am J Kidney Dis. 2001;37(1 Suppl 1):S137–81. doi: 10.1016/s0272-6386(01)70007-8. [DOI] [PubMed] [Google Scholar]
- 10.Lightfoot BO, Caruana RJ, Mulloy LL, Fincher ME. Simple formula for calculating normalized protein catabolic rate (NPCR) in hemodialysis (HD) patients (abstract) J Am Soc Nephrol. 1993;4:363. [Google Scholar]
- 11.Locatelli F. Dose of dialysis, convection and haemodialysis patients outcome - What the HEMO study doesn’t tell us: The European viewpoint. Nephrol Dial Transplant. 2003;18:1061–5. doi: 10.1093/ndt/gfg252. [DOI] [PubMed] [Google Scholar]
- 12.Nilsson LG, Bosch JP, Alquist M. Quality control in haemodialysis delivery. Eur Nephrol. 2011;5:132–7. [Google Scholar]
- 13.Eknoyan G, Beck GJ, Cheung AK, Daugirdas JT, Greene T, Kusek JW, et al. Effect of dialysis dose and membrane flux in maintenance hemodialysis. N Engl J Med. 2002;347:2010–9. doi: 10.1056/NEJMoa021583. [DOI] [PubMed] [Google Scholar]
- 14.Amini M, Aghighi M, Masoudkabir F, Zamyadi M, Norouzi S, Rajolani H, et al. Hemodialysis adequacy and treatment in Iranian patients: A national multicenter study. Iran J Kidney Dis. 2011;5:103–9. [PubMed] [Google Scholar]
- 15.ESRD Annual Report. Clinical performance measures project. Am J Kidney Dis Suppl. 2008;51(Suppl 1):S1. [Google Scholar]
- 16.Afshar R, Nadoushan MJ, Sanavi S, Komeili A. Assessment of hemodialysis adequacy in patients undergoing maintenance maneuver by laboratory tests. Iran J Pathol. 2006;1:55–60. [Google Scholar]
- 17.De Oreo PB, Hamburger RJ. Urea reduction ratio (URR) is not a consistent predictor of Kt/V (abstract) J Am Soc Nephrol. 1995;6:597. [Google Scholar]
- 18.Kim YO, Song WI, Yoon SA, Shin MJ, Song HC, Kim YS, et al. The effect of increasing blood flow rate on dialysis adequacy in hemodialysis patients with low Kt/V. Hemodial Int. 2004;8:85. [Google Scholar]
- 19.Borzou SR, Gholyaf M, Zandiha M, Amini R, Goodarzi MT, Torkaman B. The effect of increasing blood flow rate on dialysis adequacy in hemodialysis patients. Saudi J Kidney Dis Transpl. 2009;20:639–42. [PubMed] [Google Scholar]
- 20.Ward RA. Blood flow rate: An important determinant of urea clearance and delivered Kt/V. Adv Ren Replace Ther. 1999;6:75–9. doi: 10.1016/s1073-4449(99)70011-7. [DOI] [PubMed] [Google Scholar]
- 21.Port FK, Rasmussen CS, Leavey SF, Wolfe RA, Kurokawa K, Akizawa T. Association of blood flow rate (BFR) and treatment time (TT) with mortality risk (RR) in HD patients across three continents. J Am Soc Nephrol. 2001;12:343A–4A. [Google Scholar]
- 22.Ghali EJ, Malik AS. Effect of blood flow rate on dialysis adequacy in Al-Kadhimiya teaching hospital. IRAQI J Med Sci. 2012;10:260–264. [Google Scholar]
- 23.Lambie SH, Taal MW, Fluck RJ, McIntyre CW. Analysis of factors associated with variability in haemodialysis adequacy. Nephrol Dial Transplant. 2004;19:406–12. doi: 10.1093/ndt/gfg570. [DOI] [PubMed] [Google Scholar]
- 24.Lowrie EG, Li Z, Ofsthun N, Lazarus JM. Measurement of dialyzer clearance, dialysis time, and body size: Death risk relationships among patients. Kidney Int. 2004;66:2077–84. doi: 10.1111/j.1523-1755.2004.00987.x. [DOI] [PubMed] [Google Scholar]
- 25.Termorshuizen F, Dekker FW, van Manen JG, Korevaar JC, Boeschoten EW, Krediet RT NECOSAD Study Group. Relative contribution of residual renal function and different measures of adequacy to survival in hemodialysis patients: An analysis of the Netherlands Cooperative Study on the Adequacy of Dialysis (NECOSAD)-2. J Am Soc Nephrol. 2004;15:1061–70. doi: 10.1097/01.asn.0000117976.29592.93. [DOI] [PubMed] [Google Scholar]
- 26.Stivelman JC, Soucie JM, Hall ES, Macon EJ. Dialysis survival in a large inner-city facility: A comparison to national rates. J Am Soc Nephrol. 1995;6:1256–61. doi: 10.1681/ASN.V641256. [DOI] [PubMed] [Google Scholar]
- 27.Pascual M, Tolkoff-Rubin N, Schifferli JA. Is adsorption an important characteristic of dialysis membranes? Kidney Int. 1996;49:309–13. doi: 10.1038/ki.1996.47. [DOI] [PubMed] [Google Scholar]
- 28.Santoro A. Confouding factors in assessment of delivered hemodialysis dose. Kidney Int. 2000;58:19–27. doi: 10.1046/j.1523-1755.2000.07603.x. [DOI] [PubMed] [Google Scholar]
- 29.Skorecki K, Green J, Brenner BM. Mechanisms of chronic renal failure. Harrison's Principles of Internal Medicin. In: Kasper DL, Braunwald E, Hauser S, Longo DL, Jameson JL, Fauci AS, editors. 16th ed. Ch. 261. USA: The McGraw-Hill Companies; 2005. pp. 1654–63. [Google Scholar]
- 30.National Kidney Foundation/Kidney Disease Outcomes Quality Initiative (NKF/KDOQI) Clinical practice guidelines and clinical practice recommendations for diabetes and chronic kidney disease. Am J Kidney Dis. 2007;49(Suppl 2):A1. doi: 10.1053/j.ajkd.2006.12.005. [DOI] [PubMed] [Google Scholar]
- 31.Afifi A, El Setouhy M, El Sharkawy M, Ali M, Ahmed H, El-Menshawy O, et al. Diabetic nephropathy as a cause of end-stage renal disease in Egypt: A six-year study. East Mediterr Health J. 2004;10:620–6. [PubMed] [Google Scholar]
- 32.Leypoldt JK, Cheung AK. Evaluating volume status in hemodialysis patients. Adv Ren Replace Ther. 1998;5:64–74. doi: 10.1016/s1073-4449(98)70016-0. [DOI] [PubMed] [Google Scholar]
- 33.Sherman RA. Intradialytic hypotension: An overview of recent, unresolved and overlooked issues. Semin Dial. 2002;15:141–3. doi: 10.1046/j.1525-139x.2002.00002.x. [DOI] [PubMed] [Google Scholar]
- 34.Locatelli F, Pisoni RL, Akizawa T, Cruz JM, DeOreo PB, Lameire NH, et al. Anemia management for hemodialysis patients: Kidney disease outcomes quality initiative (K/DOQI) guidelines and dialysis outcomes and practice patterns study (DOPPS) findings. Am J Kidney Dis. 2004;44(Suppl 2):S27–33. doi: 10.1053/j.ajkd.2004.08.008. [DOI] [PubMed] [Google Scholar]
- 35.Panagoutsos SA, Yannatos EV, Passadakis PS, Thodis ED, Galtsidopoulos OG, Vargemezis VA. Effects of hemodialysis dose on anemia, hypertension, and nutrition. Ren Fail. 2002;24:615–21. doi: 10.1081/jdi-120013965. [DOI] [PubMed] [Google Scholar]
- 36.Azar AT, Wahba K, Mohamed AS, Massoud WA. Association between dialysis dose improvement and nutritional status among hemodialysis patients. Am J Nephrol. 2007;27:113–9. doi: 10.1159/000099836. [DOI] [PubMed] [Google Scholar]
- 37.Lindsay RM, Spanner E. A hypothesis: The protein catabolic rate is dependent upon the type and amount of treatment in dialyzed uremic patients. Am J Kidney Dis. 1989;13:382–9. doi: 10.1016/s0272-6386(89)80021-6. [DOI] [PubMed] [Google Scholar]
- 38.Manns BJ, Johnson JA, Taub K, Mortis G, Ghali WA, Donaldson C. Dialysis adequacy and health related quality of life in hemodialysis patients. ASAIO J. 2002;48:565–9. doi: 10.1097/00002480-200209000-00021. [DOI] [PubMed] [Google Scholar]
- 39.Benz RL, Pressman MR, Hovick ET, Peterson DD. Potential novel predictors of mortality in end-stage renal disease patients with sleep disorders. Am J Kidney Dis. 2000;35:1052–60. doi: 10.1016/s0272-6386(00)70039-4. [DOI] [PubMed] [Google Scholar]
- 40.McGregor DO, Buttimore AL, Nicholls MG, Lynn KL. Ambulatory blood pressure monitoring in patients receiving long, slow home haemodialysis. Nephrol Dial Transplant. 1999;14:2676–9. doi: 10.1093/ndt/14.11.2676. [DOI] [PubMed] [Google Scholar]
- 41.Rahman M, Fu P, Sehgal AR, Smith MC. Interdialytic weight gain, compliance with dialysis regimen, and age are independent predictors of blood pressure in hemodialysis patients. Am J Kidney Dis. 2000;35:257–65. doi: 10.1016/s0272-6386(00)70335-0. [DOI] [PubMed] [Google Scholar]
- 42.Charra B, Calemard E, Laurent G. Importance of treatment time and blood pressure control in achieving long-term survival on dialysis. Am J Nephrol. 1996;16:35–44. doi: 10.1159/000168968. [DOI] [PubMed] [Google Scholar]


