Abstract
Fibrotic remodeling, characterized by fibroblast phenotype switching, is often associated with atrial fibrillation and heart failure. This study aimed to investigate the effects on electrotonic myofibroblast-myocyte (Mfb-M) coupling on cardiac myocytes excitability and repolarization of the voltage-gated sodium channels (VGSCs) and single mechanogated channels (MGCs) in human atrial Mfbs. Mathematical modeling was developed from a combination of (1) models of the human atrial myocyte (including the stretch activated ion channel current, I SAC) and Mfb and (2) our formulation of currents through VGSCs (I Na_Mfb) and MGCs (I MGC_Mfb) based upon experimental findings. The effects of changes in the intercellular coupling conductance, the number of coupled Mfbs, and the basic cycle length on the myocyte action potential were simulated. The results demonstrated that the integration of I SAC, I Na_Mfb, and I MGC_Mfb reduced the amplitude of the myocyte membrane potential (V max) and the action potential duration (APD), increased the depolarization of the resting myocyte membrane potential (V rest), and made it easy to trigger spontaneous excitement in myocytes. For Mfbs, significant electrotonic depolarizations were exhibited with the addition of I Na_Mfb and I MGC_Mfb. Our results indicated that I SAC, I Na_Mfb, and I MGC_Mfb significantly influenced myocytes and Mfbs properties and should be considered in future cardiac pathological mathematical modeling.
1. Introduction
Recent studies have demonstrated a correlation between atrial fibrillation (AF) and fibrotic remodeling, specifically fibrosis [1–3]. However, their relationship has not been fully understood. Changes have taken place during the process of fibrotic remodeling in terms of gap junction remodeling [4], the deposition of excess collagen [5], and fibroblast phenotype switching [2, 6], which determines the degree of AF initiation and maintenance in atrial fibrosis in AF subjects [7].
Different currents have been identified in cardiac fibroblasts by recent electrophysiological studies, including the currents through potassium channels [8, 9], the nonselective transient receptor potential cationic channel subfamily M member 7 (TRPM7) [10], voltage-gated sodium channels (VGSCs) [11], chloride channels [12], single mechanogated channels (MGCs) [13], and voltage-dependent proton currents [14]. Therefore, fibroblasts are no longer considered as nonexcitable cells. As one of the main characteristics of fibrotic remodeling, fibroblasts proliferation and differentiation into myofibroblasts (Mfbs) at the cellular level have been shown to play an important role in cardiac pathological status [15, 16]. During fibroblasts differentiation, significantly increased potassium channels and TRPM7 have been reported [10, 17]. Specifically, with the measurement of the neoexpression of rapid Na+ currents through VGSCs during the process, 75% of the Mfbs derived from the culture of human atrial fibroblasts expressed Na+ current between 8 and 12 days. After 12 days, 100% of the Mfbs expressed Na+ current [11]. In addition, there is strong evidence that this Na+ current is generated by Nav 1.5 α-subunit, a typical VGSC to produce Na+ current in cardiomyocytes [11].
Recent studies have also suggested that MGCs were modulated by mechanical deformations of fibroblasts, which may contribute to the cardiac mechanoelectrical feedback under both physiological and pathophysiological conditions [18, 19]. As myocytes start contracting, the interposed fibroblasts are mechanically compressed. The membrane potential of fibroblasts is depolarized by ionic currents through MGCs [13, 18].
Computational models of atrial fibrosis have been used to investigate the relationship between fibrotic remodeling and AF. For gap junction remodeling, simulation results showed that increased anisotropy led to sustained reentrant activity [20]. For collagen deposition, it has been demonstrated that patchy distributions of collagen were responsible for atrial conduction disturbances in failing hearts [21, 22]. For fibroblast proliferation and phenotype switching, studies indicated that coupling of fibroblasts to atrial myocytes resulted in shorter duration of the action potential (APD), slower conduction, and the development of AF [23, 24]. Taking Mfbs into account, other studies combined all the above-mentioned elements in the left atrial model to examine the underlying mechanisms of AF initiation and indicated that Mfbs exerted electrotonic influences on myocytes in the lesions [1, 25]. However, all these published simulation studies have not considered the following: first, the stretch activated ion channel current (I SAC) in myocytes, which significantly influences the electrophysiological characteristics of cardiac myocytes under stretching [26, 27]; second, the currents through VGSCs (I Na_Mfb) and MGCs (I MGC_Mfb) in Mfbs, which could influence Mfb properties and contribute to mechanoelectrical coupling in cardiac pathologies [11, 13].
The present study aimed to investigate the combinational role of I SAC, I Na_Mfb, and I MGC_Mfb in the excitability and repolarization of cardiac myocytes by Mfb-myocyte (Mfb-M) coupling. Specifically, a new formulation of I Na_Mfb and I MGC_Mfb based on experimental data will be combined with models of human atrial myocyte (including I SAC) and Mfb. Simulation results of human atrial myocyte action potential (AP) dynamics from different gap-junctional conductances (G gap), number of coupled Mfbs, and basic cycle lengths (BCLs) will be compared.
2. Materials and Methods
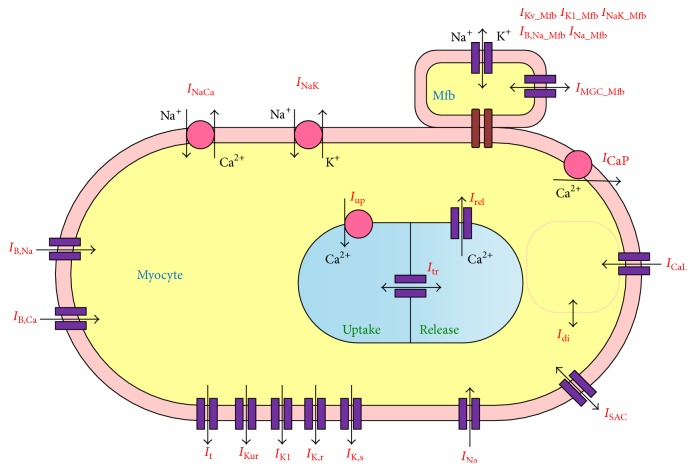
The framework of the coupled Mfb-M model was developed from Maleckar et al.'s model of the human atrial myocyte [28] (including I SAC equations described by Kuijpers et al. [26]), MacCannell et al.'s model of the human cardiac Mfb [24], and our new formulation of I Na_Mfb and I MGC_Mfb based on experimental findings from Chatelier et al. [11] and Kamkin et al. [13]. Figure 1 is a schematic of the Mfb-M coupling model. An overview of the simulations is described as follows.
Figure 1.
Schematic representation of the mathematical model of Mfb-M coupling.
2.1. Mfb-M Coupling
According to [24], the differential equations for the membrane potential of cardiac Mfb and myocyte are given by
| (1) |
where V Mfb,i and V M represent the transmembrane potential of the ith coupled Mfb and the human atrial myocyte, respectively; Cm,Mfb and Cm,M represent the membrane capacitance of the Mfb and the myocyte, respectively; I Mfb,i and I M represent the transmembrane current of the ith coupled Mfb and the human atrial myocyte, respectively; and G gap represents the gap-junctional conductance, which varies between 0.5 and 8 nS in individual simulations based on previous measurements [19, 29]. A negative I gap (i.e., G gap (V Mfb,i − V M)) indicates that the current is flowing from the myocyte into the ith Mfb, and n is the total number of coupled Mfbs.
2.2. Mathematical Model of the Human Atrial Myocyte
The mathematical model from Maleckar et al. was implemented in this study [28], which was based on experimental data and has correctly replicated APD restitution of the adult human atrial myocyte. To describe the influence of stretch on myocyte AP, the original model from Maleckar et al. was modified with the total ionic current of myocyte (I M) given by
| (2) |
where I Na is fast inward Na+ current; I CaL is L-type Ca2+ current; I t is transient outward K+ current; I Kur is sustained outward K+ current; I K1 is inward rectifying K+ current; I K,r is rapid delayed rectifier K+ current; I K,s is slow delayed rectifier K+ current; I B,Na is background Na+ current; I B,Ca is background Ca2+ current; I NaK is Na+-K+ pump current; I CaP is sarcolemmal Ca2+ pump current; I NaCa is Na+-Ca2+ exchange current; I SAC is stretch activated current; and I Stim is stimulated current.
On the basis of experimental observations [30], it has been reported by Kuijpers et al. that I SAC in atrial myocytes is permeable to Na+, K+, and Ca2+ [26], which is defined as
| (3) |
where I SAC,Na, I SAC,K, and I SAC,Ca represent the contributions of Na+, K+, and Ca2+ to I SAC, respectively. These currents were defined by the constant-field Goldman-Hodgkin-Katz current equation [26].
To introduce the effect of I SAC on intracellular Na+, K+, and Ca2+ concentrations ([Na+]i, [K+]i, and [Ca2+]i), we replaced equations of [Na+]i, [K+]i, and [Ca2+]i in Maleckar et al.'s model [28] by
| (4) |
where F is Faraday's constant; Voli is cytosolic volume; I di is Ca2+ diffusion current from the diffusion-restricted subsarcolemmal space to the cytosol; I up is sarcoplasmic reticulum Ca2+ uptake current; I rel is sarcoplasmic reticulum Ca2+ release current; and O is buffer occupancy.
2.3. Electrophysiological Model of the Human Atrial Mfb
The electrophysiological model of the human atrial Mfb from MacCannell et al. [24] was used in the present study. It included time- and voltage-dependent K+ current (I Kv_Mfb), inward rectifying K+ current (I K1_Mfb), Na+-K+ pump current (I NaK_Mfb), and Na+ background current (I B,Na_Mfb).
In addition, I Na_Mfb and I MGC_Mfb were added in the Mfb model. According to the published experimental data [9], the Mfb transmembrane potential V Mfb and C m,Mfb of −47.75 mV and 6.3 pF were used.
For I Na_Mfb, the steady-state value of activation gating variable for Na+ current () was obtained by fitting the experimental data from Chatelier et al. [11] with a Boltzmann function using Origin software:
| (5) |
where V Mfb is the Mfb potential ranging from −120 mV to 40 mV in 10 mV increments and y is the corresponding value of at each V Mfb. A 1 and A 2 are fitting coefficients and V 0.5 and k represent the half-maximum voltage of activation and the Boltzmann steepness coefficient, respectively.
After the data were fitted with a Boltzmann function, A 1 and A 2 were −0.0102 and 1.0063, respectively. V 0.5 and k were −42.1 mV and 10.53, respectively. The equation of was then expressed as
| (6) |
The steady-state value of inactivation gating variable for I Na_Mfb () was also fitted with the Boltzmann function, with A 1 and A 2 of 1.04 and 0.004 and V 0.5 and k of −84.82 mV and 9.4, respectively. The equation of was given as
| (7) |
As suggested by Chatelier et al. that I Na_Mfb was generated by the same Nav 1.5 which produced Na+ currents in the atria and ventricle of the adult human heart [11], the equations of activation time constants in the model of Courtemanche et al. [31] were used to describe the activation time constant for I Na_Mfb (τ mMfb). The equations are given by
| (8) |
| (9) |
| (10) |
where V Mfb are original values, ranging from −40 mV to 30 mV in 10 mV increments and τ mMfb is the corresponding value at each V Mfb. α mMfband β mMfbare extrapolated rate coefficients. After the data were fitted with these equations, A 1 to A 4 were 0.0077, −0.18, 0.004, and 11.98, and V x was 68.19 mV.
Equation (8) requires evaluation of a limit to determine the value at membrane potential for which its denominator is zero. Equations (8) and (9) are therefore expressed as follows:
| (11) |
Similarly, the equations of inactivation time constant (τ jMfb) were as follows:
| (12) |
The model of I Na_Mfb was modified from the equation described by Luo and Rudy [32], as follows:
| (13) |
where , the maximum conductance of I Na_Mfb, was 0.756 nS; E Na,Mfb is the Nernst potential for Na+ ions; [Na+]c,Mfb, the Mfb extracellular Na+ concentration, was 130.011 mmol/L; [Na+]i,Mfb, the Mfb intracellular Na+ concentration, initial value was 8.5547 mmol/L; m Mfb and j Mfb were the activation and inactivation parameters, respectively. In order to conform to the experiment data [11], j was modified to be j 0.12. Equations of time dependence were given by
| (14) |
For I MGC_Mfb, the equation based on experimental results from Kamkin et al. [13] was given by
| (15) |
where , the maximum conductance of I MGC_Mfb, was 0.043 nS and E MGC,Mfb, the reversal potential of MGCs, was close to 0 mV [13].
2.4. Simulation Protocol
Simulations were carried out with (1) two Mfbs coupled to a single atrial myocyte in which G gap varied between 0.5 and 8 nS and (2) one and four identical Mfbs coupled to a single atrial myocyte at constant G gap of 3 nS. Next, in order to investigate the role of BCL in myocyte AP, the coupled system was paced with BCLs from 100 to 2000 ms for each G gap (0.5 or 8 nS) and for each number of coupled Mfbs (1 or 4). The resting myocyte membrane potential (V rest), the amplitude of the myocyte membrane potential (V max), and APD at 90% repolarization (APD90) at different BCLs were obtained.
To ensure that the coupled system reached steady state, stimulation was repeated for 20 cycles. The results from the last cycle in each simulation were used. All state variables of the coupled model were updated by means of the forward Euler method. The time step was set to be 10 μs to ensure numerical accuracy and stability.
3. Results
3.1. I Na_Mfb and I MGC_Mfb in Mfbs
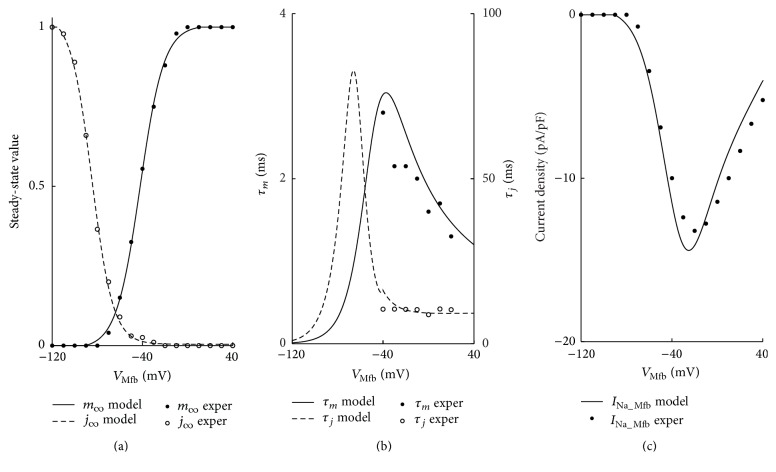
Figure 2 shows the steady-state activation and inactivation curves, time constants, and the current-voltage (I-V) relationship of I Na_Mfb. All the curves were consistent with the experimental data [11].
Figure 2.
Model representation of parameters describing I Na_Mfb. (a) Steady-state activation (solid line) and inactivation (dashed line) curves, (b) gating variable fast (solid line) and slow (dashed line) time constants, and (c) I-V relationship (solid line). Experimental data (filled and hollow circles) from Chatelier et al. is included for comparison.
Figure 3 shows the linear I-V relationship of I MGC_Mfb. The curve was consistent with the experimental data [13].
Figure 3.
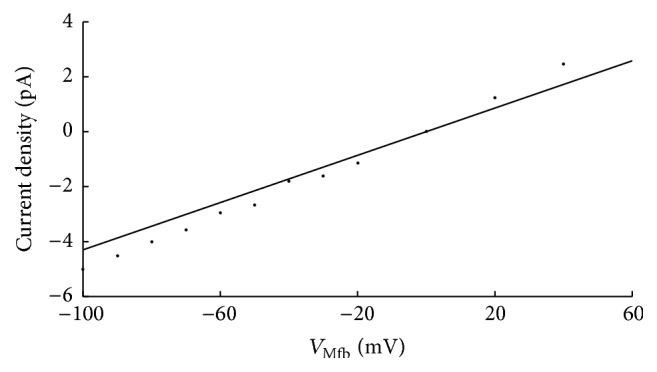
The I-V relationship (solid line) of MGCs. Experimental data (filled circles) from Kamkin et al. is included for comparison.
3.2. Effects of I SAC, I Na_Mfb, and I MGC_Mfb on Atrial Myocyte and Mfbs
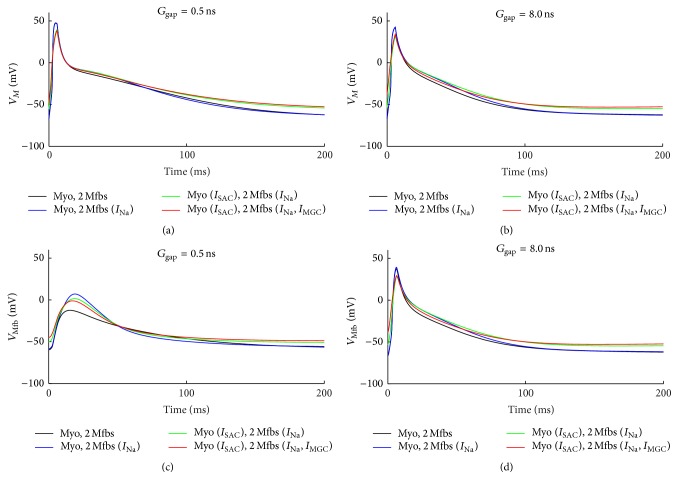
Figure 4 shows the combinational effects of I SAC, I Na_Mfb, and I MGC_Mfb on the membrane potential of myocytes and Mfbs by coupling two Mfbs to a human atrial myocyte with G gap of 0.5 and 8 nS. For myocytes, including I Na_Mfb, I SAC and I MGC_Mfb to the model of Mfb-M coupling resulted in gradually decreased V max and APD90 and increased V rest depolarization (Figures 4(a) and 4(b)). With G gap of 0.5 nS, V max was decreased by 0.8% (with I Na_Mfb), 16.7% (with I Na_Mfb and I SAC), and 18.6% (with I Na_Mfb, I SAC, and I MGC_Mfb) in comparison with the control (without I Na_Mfb, I SAC, and I MGC_Mfb). Correspondingly, for the three conditions, APD90 was decreased by 20.0%, 19.1%, and 20.2%, respectively, and V rest increased by 8.3%, 20.3%, and 22.4%, respectively. With G gap of 8 nS, V max was decreased by 0.2%, 23.5%, and 18.6%, respectively. APD90 was decreased by 1.6%, 4.1%, and 11.1%, respectively. V rest was increased by 0.8%, 12.5%, and 15.9%, respectively. In addition, I Na_Mfb, I SAC, and I MGC_Mfb decelerated the repolarization of the atrial myocyte AP, especially with a large G gap. For Mfbs, with G gap of 0.5 nS, significant electrotonic depolarizations were observed with the integration of the three currents (Figure 4(c)). V max of the Mfb was −12.4 mV (control), 7.1 mV (with I Na_Mfb), 1.5 mV (with I Na_Mfb and I SAC), and −1.0 mV (with I Na_Mfb, I SAC, and I MGC_Mfb), respectively. With G gap of 8 ns, the effects of these currents on Mfbs were similar with that on myocytes (Figure 4(d)).
Figure 4.
Effects of I SAC, I Na_Mfb, and I MGC_Mfb on transmembrane potential of myocyte and Mfb. (a, b) V M and (c, d) V Mfb, in Mfb-M coupling with I Na_Mfb (blue line), with I SAC and I Na_Mfb (green line), and with I SAC, I Na_Mfb, and I MGC (red line) as compared to control (black line), by coupling two Mfbs to an atrial myocyte with G gap of 0.5 and 8 nS.
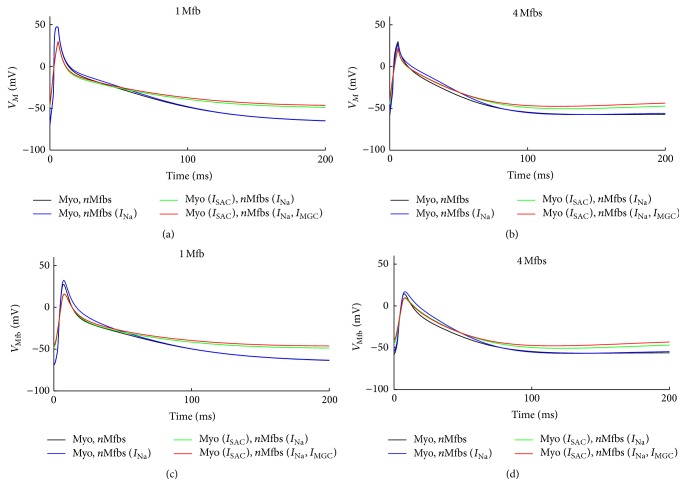
Figure 5 illustrates similar effects of I SAC, I Na_Mfb, and I MGC_Mfb on the membrane potential of myocytes and Mfbs when G gap was fixed at 3 nS and the number of coupled Mfbs was one or four. For myocytes, integrating these currents into the coupled model resulted in decreased V max and APD90 and greater depolarization in V rest (Figures 5(a) and 5(b)). Coupling one Mfb to a human atrial myocyte resulted in 0.1% (with I Na_Mfb), 38.1% (with I Na_Mfb and I SAC), and 37.4% (with I Na_Mfb, I SAC, and I MGC_Mfb) decreases in V max when compared with the control. Correspondingly, APD90 was decreased by 1.1%, 7.7%, and 7.8%, and V rest increased by 0.4%, 25.0%, and 28.6%, respectively. Similarly, coupling four Mfbs to a human atrial myocyte resulted in 7.9%, 30.3%, and 25.9% decreases in V max when compared with the control. APD90 was decreased by 1.6%, 8.9%, and 18.9%, and V rest was increased by 2.3%, 17.4%, and 23.6%, respectively. For Mfbs, the effects of these currents were similar with that on myocytes (Figures 5(c) and 5(d)).
Figure 5.
Effects of I SAC, I Na_Mfb, and I MGC_Mfb on transmembrane potential of myocyte and Mfb. (a, b) V M and (c, d) V Mfb, in Mfb-M coupling with I Na_Mfb (blue line), with I SAC and I Na_Mfb (green line), and with I SAC, I Na_Mfb and I MGC (red line) as compared to control (black line), by coupling one and four Mfbs to an atrial myocyte with G gap of 3 nS.
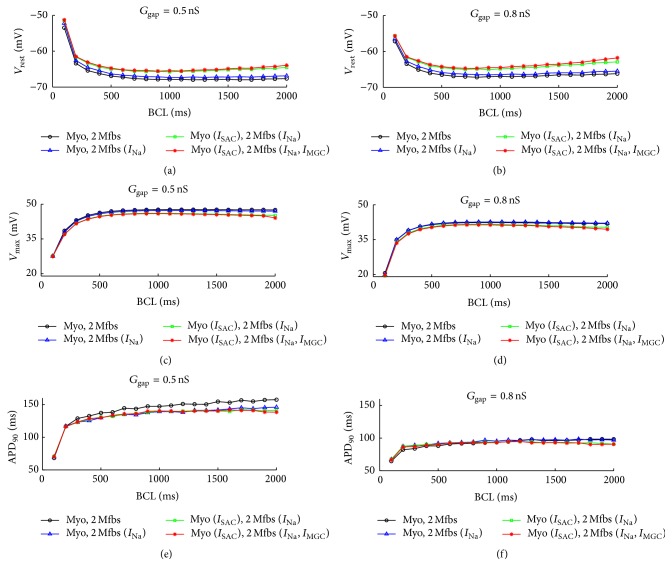
Figure 6 illustrates the changes of V rest, V max, and APD90 in myocyte with the integration of I SAC, I Na_Mfb, and I MGC_Mfb as a function of BCL when coupling two Mfbs to a human atrial myocyte. For both low (0.5 nS, Figures 6(a), 6(c), and 6(e)) and high (8 nS, Figures 6(b), 6(d), and 6(f)) G gap, V rest declined and V max rose in the control and with I Na_Mfb as BCL increased (Figures 6(a) to 6(d)). V rest decreased initially and then increased slightly with I SAC and I Na_Mfb and with I SAC, I Na_Mfb, and I MGC_Mfb. Contrarily, V max increased with BCL initially and then decreased slightly. Gaps of V rest and V max between the four cases widened as the BCL increased with more pronounced variations for the high G gap. APD90 was prolonged as BCL increased in all the four situations for both G gap values (Figures 6(e) and 6(f)). With G gap of 0.5 nS, similar to V max, APD90 gradually dropped with I Na_Mfb, I SAC, and I MGC_Mfb in order at each BCL. However, there was no obvious difference between the four situations with G gap of 8 nS.
Figure 6.
Effects of I SAC, I Na_Mfb, and I MGC_Mfb on AP characteristics as a function of BCL in Mfb-M coupling with I Na_Mfb (blue line with hollow triangle), with I SAC and I Na_Mfb (green line with hollow rectangle), and with I SAC, I Na_Mfb, and I MGC (red line with asterisk) as compared to control (black line with hollow circle), by coupling two Mfbs to an atrial myocyte with G gap of 0.5 and 8 nS. (a, b) V rest, (c, d) V max, and (e, f) APD90.
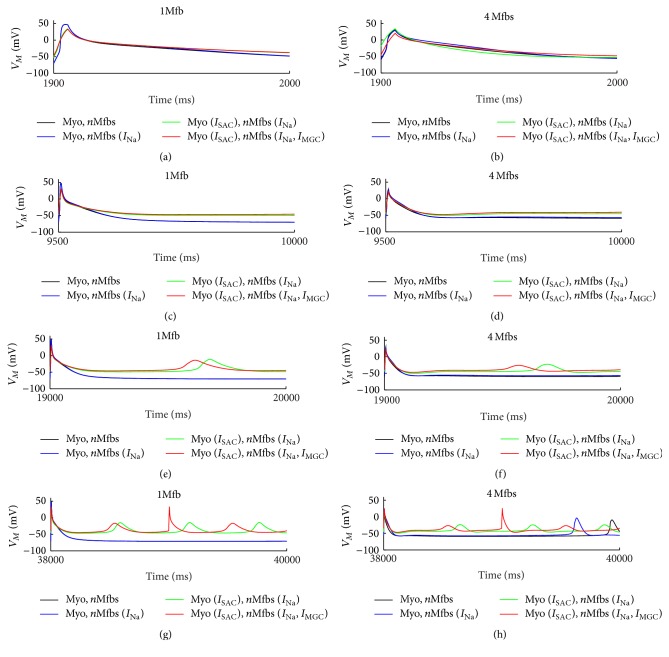
Figure 7 shows the APs of the human atrial myocyte at the 20st cycle with BCL of 100 (Figures 7(a) and 7(b)), 500 (Figures 7(c) and 7(d)), 1000 (Figures 7(e) and 7(f)), and 2000 ms (Figures 7(g) and 7(h)) when G gap was fixed at 3 nS and the number of coupled Mfbs was one or four. Integrating I SAC, I Na_Mfb, and I MGC_Mfb into the model of Mfb-M coupling resulted in reductions in V max and APD90 and greater depolarization in V rest. However, it is noted that spontaneous excitements in the myocyte appeared when the value of BCL was higher than a certain value (1000 ms in this study). The increased V rest and the longer stimulus interval were the two major factors for the spontaneous excitement. Meanwhile, integrating I SAC, I Na_Mfb, and I MGC_Mfb simultaneously into the coupled model triggered the most and earliest spontaneous excitement at BCL of 1000 and 2000 ms, suggesting that the three currents could result in discordant alternans, especially with large BCL (2000 ms in this study).
Figure 7.
Effects of I SAC, I Na_Mfb, and I MGC_Mfb on V M for several BCLs. (a, b) BCL = 100 ms, (c, d) BCL = 500 ms, (e, f) BCL = 1000 ms, and (g, h) BCL = 2000 ms, in Mfb-M coupling with I Na_Mfb (blue line), with I SAC and I Na_Mfb (green line), and with I SAC, I Na_Mfb, and I MGC (red line) as compared to control (black line), by coupling one and four Mfbs to an atrial myocyte with G gap of 3 nS. Results corresponded to the last cycle in each simulation.
4. Discussion
This study investigated the roles of I SAC, I Na_Mfb, and I MGC_Mfb in the excitability and AP. To address these issues, numerical simulations of the coupled Mfb-M system were performed by employing a combination of models of the human atrial myocyte (including I SAC) and Mfb, as well as modified formulation of I Na_Mfb and I MGC_Mfb based on experimental data. Specifically, the effects of these currents with changes in (1) G gap, (2) the number of Mfbs, and (3) BCL on the human atrial myocyte AP dynamics were investigated. The main results with the integration of I SAC, I Na_Mfb, and I MGC_Mfb were as follows: (1) for myocytes, the addition of I SAC, I Na_Mfb, and I MGC_Mfb resulted in decreased V max and APD90 and increased V rest depolarization; deceleration of AP repolarization; and trigger of spontaneous excitements even discordant alternans at large BCLs and (2) for Mfbs, significant electrotonic depolarizations were obtained with small G gap. As the value of G gap and the number of coupled Mfbs increased, the effects for Mfbs were similar to those in myocytes.
4.1. Resting Potential of Human Atrial Mfbs
V rest of fibroblasts/Mfbs in human atria was close to −15 mV [33, 34]. At this potential, the persistent entry of Na+ in Mfb would be negligible [11]. Indeed, it has been reported that V rest of these cells was sensitive to mechanical stress under both contraction and relaxation [13, 35, 36]. A stretch of 3 μm led to a negative shift of V rest, about −35 ± 5 mV [13]. Reoxygenation after hypoxia also produced a hyperpolarization to V rest [37]. Based on these findings, we set up the mathematical formulation of I MGC_Mfb and included it in the Mfb-M coupling model. In addition, it has also been shown that K+ current in cardiac fibroblasts and V rest was between −40.0 and −60.0 mV [8, 9, 38]. These potentials corresponded to the peak of the Na+ window current described by Chatelier et al. [11]. A persistent Na+ entry may be induced based on such a cell polarity. Therefore, we also introduced the mathematical formulation of I Na_Mfb and included it in Mfb modeling. V rest was set to be −47.8 mV, within the range of experimental findings [8, 9].
4.2. Role of I SAC, I Na_Mfb, and I MGC_Mfb on V rest and Excitability of Human Atrial Myocytes
Both experimental data and computational work have shown that the value of G gap and the number of coupled fibroblasts/Mfbs were important in determining the depolarization of the coupled human myocyte at rest [24, 28, 29, 39]. Based on the preceding conclusions, our simulations also considered the effects of I SAC, I Na_Mfb, and I MGC_Mfb on V rest and excitability of human atrial myocytes.
For I SAC, previous studies explored the electrophysiological effect of sustained stretch and indicated that I SAC influenced cardiac myocytes repolarization and activation [26, 40]. With pathophysiological conditions, such as hypertension and AF, it has been observed that atrial stretch and dilatation influenced atrial flutter cycle length and facilitated the induction and maintenance of AF [41, 42]. However, the SAC blocker Gd3+ reduced the stretch-induced vulnerability to AF [43]. These observational studies confirmed that I SAC plays a significant role in heart pathology. In our simulations, integrating I SAC into the mathematical model of the human atrial myocyte resulted in a significant depolarization of V rest and prolongation of repolarization (Figures 4 to 7). These phenomena led to alternating spontaneous excitement propagation at a BCL of 2000 ms (Figure 7). Our simulation agreed with Kuijpers et al., where slow conduction, a longer effective refractory period, and unidirectional conduction block with increasing stretch were observed [26], which were related to the inducibility of AF.
For I Na_Mfb, many studies have been conducted to investigate how this current could influence Mfb proliferation, since fibrotic remodeling was closely related to AF. It has been reported that Nav 1.5 α-subunit was responsible of I Na_Mfb in human atrial Mfbs, which represented electrophysiological characteristics similar to Na+ channels found in cardiac excitable cells [11, 44]. Based on this, a multiple parameter exponential function was used in this study, which was modeled after the equation of time courses by Courtemanche et al. to fit the time courses of current decay elicited at depolarized voltages [31]. Unlike the assumption from Koivumäki et al. that V rest of Mfbs resulted in significant inactivation of I Na_Mfb [45], the current was activated during an atrial Mfb AP in our simulations. Our results showed that I Na_Mfb decreased V max and APD90 and increased V rest depolarization in myocytes (Figures 4 to 7). Like I SAC, this depolarization would be expected to change diastolic Ca2+ levels and conduction velocity.
For I MGC_Mfb, experimental data has indicated that cardiac fibroblasts expressed functional MCGs, contributing to the cardiac mechanoelectrical feedback under both physiological and pathophysiological conditions [18, 19]. Since I MGC_Mfb has been found in Mfbs, we assumed that it could affect Mfb electrophysiological characteristics like I SAC on myocyte. In our simulations, the I-V relation for single MGCs was linear, which agreed with the experimental results [13]. The results showed that integrating I MGC_Mfb in the Mfb model changed the membrane potential of Mfb and further influenced the membrane potential of myocyte by Mfb-myocyte coupling (Figures 4 to 7). Interestingly, MGCs were activated by Mfb compression and inactivated by Mfb stretch [13], implying that I MGC_Mfb should be integrated in cell modeling only during cell compression, such as fibroblasts/Mfbs compression caused by stretching and dilatation of surrounding cardiac myocytes.
Table 1 shows changes in myocyte V rest, V max, and APD90 in three situations as compared to control. The situations were Mfb-M coupling with (1) I Na_Mfb, (2) I Na_Mfb and I SAC, and (3) I Na_Mfb, I SAC, and I MGC_Mfb, respectively. Values were recorded with two Mfbs coupled to a single atrial myocyte in which G gap was varied between 0.5 and 8 nS, or with one and four identical Mfbs coupled to a single atrial myocyte at a constant G gap of 3 nS. In general, it can be seen that I Na_Mfb, I SAC, and I MGC_Mfb played a greater role in reducing V max and APD90 and increasing the depolarization of V rest when G gap was relatively small. Increasing the number of coupled Mfbs contributed to a further decline in APD90 in all cases, while having different influences on V max and V rest. The reduction of V max and the rise of depolarization of V rest were increased in case (1) and both declined in case (2) and (3).
Table 1.
Percentage changes in myocyte V rest, V max and APD90 as compared to control.
| G gap (nS) | Coupled Mfbs | ||||
|---|---|---|---|---|---|
| 0.5 | 8 | 1 | 4 | ||
| V max↓ (%) | I Na_Mfb | 0.8 | 0.2 | 0.1 | 7.9 |
| I Na_Mfb, I SAC | 16.7 | 23.5 | 38.1 | 30.3 | |
| I Na_Mfb, I SAC, I MGC_Mfb | 18.6 | 18.6 | 37.4 | 25.9 | |
| APD↓ (%) | I Na_Mfb | 20.0 | 1.6 | 1.1 | 1.6 |
| I Na_Mfb, I SAC | 19.1 | 4.1 | 7.7 | 8.9 | |
| I Na_Mfb, I SAC, I MGC_Mfb | 20.2 | 11.1 | 7.8 | 18.9 | |
| V rest↑ (%) | I Na_Mfb | 8.3 | 0.8 | 0.4 | 2.3 |
| I Na_Mfb, I SAC | 20.3 | 12.5 | 25.0 | 17.4 | |
| I Na_Mfb, I SAC, I MGC_Mfb | 22.4 | 15.9 | 28.6 | 23.6 | |
Previous modeling work suggested that Mfb-M coupling contributed to arrhythmia formation [23, 46]. The key factors included G gap, the number of coupled Mfbs, and Mfb density. Here, we investigated the functional effect of fibrotic remodeling on AF by integrating I Na_Mfb, I SAC, and I MGC_Mfb into Mfb-M coupling. To the best of our knowledge, this has not been examined before. As summarized in Figure 7, these currents made the Mfb act as a current source for the cardiac myocyte, leading to depolarization of V rest and shortening of APD, thereby preserving myocyte excitability to trigger spontaneous excitement and facilitating reentry (such as those of AF).
4.3. Limitations
Two limitations of this mathematical modeling should be mentioned. First, the influence of homologous coupling between adjacent Mfbs was not considered. Since Mfbs can form conduction bridges between myocyte bundles and introduce nonlinearity into Mfb-M coupling to alter electrophysiological properties of the coupled myocyte, coupling between Mfbs may be important in tissue modeling [28, 29]. Second, our modeling of I MGC_Mfb was done using a simplified model based on a linear equation. We did not include the mechanosensitivity of MGCs in our simulation; for example, the conductance depends of the mechanical forces to which the cells are submitted.
5. Conclusions
This study demonstrated the combinational effects of I Na_Mfb and I MGC_Mfb in Mfbs on myocyte excitability and repolarization. Our results showed that the addition of I Na_Mfb and I MGC_Mfb reduced V max, shortened APD, depolarized V rest, and was easy to trigger spontaneous excitement in myocytes. The effects proved that Na+ current and mechanogated channels in Mfbs should be considered in future pathological cardiac mathematical modeling, such as atrial fibrillation and cardiac fibrosis.
Supplementary Material
The Supplementary Material contained model equations, parameters values and initial conditions necessary to carry out the simulations presented in this article. The model equations included equations of the atrial myocyte model (Table 1 through 12), the atrial myofibroblast model (Table 13 through 19) and myofibroblast-myocyte coupling (Table 20). Parameters values and initial conditions were given in Table 21 through 23. Glossary was listed at the end.
Acknowledgments
This project is supported by the National Natural Science Foundation of China (81501557).
Competing Interests
The authors declare that they have no competing interests.
References
- 1.McDowell K. S., Vadakkumpadan F., Blake R., et al. Mechanistic inquiry into the role of tissue remodeling in fibrotic lesions in human atrial fibrillation. Biophysical Journal. 2013;104(12):2764–2773. doi: 10.1016/j.bpj.2013.05.025. [DOI] [PMC free article] [PubMed] [Google Scholar]
- 2.Yue L., Xie J., Nattel S. Molecular determinants of cardiac fibroblast electrical function and therapeutic implications for atrial fibrillation. Cardiovascular Research. 2011;89(4):744–753. doi: 10.1093/cvr/cvq329. [DOI] [PMC free article] [PubMed] [Google Scholar]
- 3.Mahnkopf C., Badger T. J., Burgon N. S., et al. Evaluation of the left atrial substrate in patients with lone atrial fibrillation using delayed-enhanced MRI: implications for disease progression and response to catheter ablation. Heart Rhythm. 2010;7(10):1475–1481. doi: 10.1016/j.hrthm.2010.06.030. [DOI] [PMC free article] [PubMed] [Google Scholar]
- 4.Burstein B., Comtois P., Michael G., et al. Changes in connexin expression and the atrial fibrillation substrate in congestive heart failure. Circulation Research. 2009;105(12):1213–1222. doi: 10.1161/circresaha.108.183400. [DOI] [PubMed] [Google Scholar]
- 5.Burstein B., Nattel S. Atrial Fibrosis: mechanisms and clinical relevance in atrial fibrillation. Journal of the American College of Cardiology. 2008;51(8):802–809. doi: 10.1016/j.jacc.2007.09.064. [DOI] [PubMed] [Google Scholar]
- 6.Vasquez C., Benamer N., Morley G. E. The cardiac fibroblast: functional and electrophysiological considerations in healthy and diseased hearts. Journal of Cardiovascular Pharmacology. 2011;57(4):380–388. doi: 10.1097/fjc.0b013e31820cda19. [DOI] [PMC free article] [PubMed] [Google Scholar]
- 7.Trayanova N. A. Mathematical approaches to understanding and imaging atrial fibrillation: significance for mechanisms and management. Circulation Research. 2014;114(9):1516–1531. doi: 10.1161/circresaha.114.302240. [DOI] [PMC free article] [PubMed] [Google Scholar]
- 8.Shibukawa Y., Chilton E. L., MacCannell K. A., Clark R. B., Giles W. R. K+ currents activated by depolarization in cardiac fibroblasts. Biophysical Journal. 2005;88(6):3924–3935. doi: 10.1529/biophysj.104.054429. [DOI] [PMC free article] [PubMed] [Google Scholar]
- 9.Chilton L., Ohya S., Freed D., et al. K+ currents regulate the resting membrane potential, proliferation, and contractile responses in ventricular fibroblasts and myofibroblasts. American Journal of Physiology—Heart and Circulatory Physiology. 2005;288(6):H2931–H2939. doi: 10.1152/ajpheart.01220.2004. [DOI] [PubMed] [Google Scholar]
- 10.Du J., Xie J., Zhang Z., et al. TRPM7-mediated Ca2+ signals confer fibrogenesis in human atrial fibrillation. Circulation Research. 2010;106(5):992–1003. doi: 10.1161/circresaha.109.206771. [DOI] [PMC free article] [PubMed] [Google Scholar]
- 11.Chatelier A., Mercier A., Tremblier B., et al. A distinct de novo expression of Nav1.5 sodium channels in human atrial fibroblasts differentiated into myofibroblasts. Journal of Physiology. 2012;590(17):4307–4319. doi: 10.1113/jphysiol.2012.233593. [DOI] [PMC free article] [PubMed] [Google Scholar]
- 12.Li G.-R., Sun H.-Y., Chen J.-B., Zhou Y., Tse H.-F., Lau C.-P. Characterization of multiple ion channels in cultured human cardiac fibroblasts. PLoS ONE. 2009;4(10) doi: 10.1371/journal.pone.0007307.e7307 [DOI] [PMC free article] [PubMed] [Google Scholar]
- 13.Kamkin A., Kirischuk S., Kiseleva I. Single mechano-gated channels activated by mechanical deformation of acutely isolated cardiac fibroblasts from rats. Acta Physiologica. 2010;199(3):277–292. doi: 10.1111/j.1748-1716.2010.02086.x. [DOI] [PubMed] [Google Scholar]
- 14.El Chemaly A., Guinamard R., Demion M., et al. A voltage-activated proton current in human cardiac fibroblasts. Biochemical and Biophysical Research Communications. 2006;340(2):512–516. doi: 10.1016/j.bbrc.2005.12.038. [DOI] [PubMed] [Google Scholar]
- 15.Biernacka A., Frangogiannis N. G. Aging and cardiac fibrosis. Aging and Disease. 2011;2(2):158–173. [PMC free article] [PubMed] [Google Scholar]
- 16.Baum J., Duffy H. S. Fibroblasts and myofibroblasts: what are we talking about? Journal of Cardiovascular Pharmacology. 2011;57(4):376–379. doi: 10.1097/fjc.0b013e3182116e39. [DOI] [PMC free article] [PubMed] [Google Scholar]
- 17.Benamer N., Moha Ou Maati H., Demolombe S., et al. Molecular and functional characterization of a new potassium conductance in mouse ventricular fibroblasts. Journal of Molecular and Cellular Cardiology. 2009;46(4):508–517. doi: 10.1016/j.yjmcc.2008.12.016. [DOI] [PubMed] [Google Scholar]
- 18.Kamkin A., Kiseleva I., Isenberg G., et al. Cardiac fibroblasts and the mechano-electric feedback mechanism in healthy and diseased hearts. Progress in Biophysics and Molecular Biology. 2003;82(1–3):111–120. doi: 10.1016/s0079-6107(03)00009-9. [DOI] [PubMed] [Google Scholar]
- 19.Kamkin A., Kiseleva I., Lozinsky I., Scholz H. Electrical interaction of mechanosensitive fibroblasts and myocytes in the heart. Basic Research in Cardiology. 2005;100(4):337–345. doi: 10.1007/s00395-005-0529-4. [DOI] [PubMed] [Google Scholar]
- 20.Krueger M. W., Rhode K. S., O'Neill M. D., et al. Patient-specific modeling of atrial fibrosis increases the accuracy of sinus rhythm simulations and may explain maintenance of atrial fibrillation. Journal of Electrocardiology. 2014;47(3):324–328. doi: 10.1016/j.jelectrocard.2013.11.003. [DOI] [PubMed] [Google Scholar]
- 21.Comtois P., Nattel S. Interactions between cardiac fibrosis spatial pattern and ionic remodeling on electrical wave propagation. Proceedings of the 33rd Annual International Conference of the IEEE Engineering in Medicine and Biology Society (EMBS '11); September 2011; Boston, Mass, USA. IEEE; pp. 4669–4672. [DOI] [PubMed] [Google Scholar]
- 22.Tanaka K., Zlochiver S., Vikstrom K. L., et al. Spatial distribution of fibrosis governs fibrillation wave dynamics in the posterior left atrium during heart failure. Circulation Research. 2007;101(8):839–847. doi: 10.1161/CIRCRESAHA.107.153858. [DOI] [PubMed] [Google Scholar]
- 23.Ashihara T., Haraguchi R., Nakazawa K., et al. The role of fibroblasts in complex fractionated electrograms during persistent/permanent atrial fibrillation: implications for electrogram-based catheter ablation. Circulation Research. 2012;110(2):275–284. doi: 10.1161/circresaha.111.255026. [DOI] [PMC free article] [PubMed] [Google Scholar]
- 24.MacCannell K. A., Bazzazi H., Chilton L., Shibukawa Y., Clark R. B., Giles W. R. A mathematical model of electrotonic interactions between ventricular myocytes and fibroblasts. Biophysical Journal. 2007;92(11):4121–4132. doi: 10.1529/biophysj.106.101410. [DOI] [PMC free article] [PubMed] [Google Scholar]
- 25.McDowell K. S., Vadakkumpadan F., Blake R., et al. Methodology for patient-specific modeling of atrial fibrosis as a substrate for atrial fibrillation. Journal of Electrocardiology. 2012;45(6):640–645. doi: 10.1016/j.jelectrocard.2012.08.005. [DOI] [PMC free article] [PubMed] [Google Scholar]
- 26.Kuijpers N. H. L., Ten Eikelder H. M. M., Bovendeerd P. H. M., Verheule S., Arts T., Hilbers P. A. J. Mechanoelectric feedback leads to conduction slowing and block in acutely dilated atria: A Modeling Study of Cardiac Electromechanics. American Journal of Physiology—Heart and Circulatory Physiology. 2007;292(6):H2832–H2853. doi: 10.1152/ajpheart.00923.2006. [DOI] [PubMed] [Google Scholar]
- 27.Zhan H. Q., Xia L. Excitation-contraction coupling between human atrial myocytes with fibroblasts and stretch activated channel current: a simulation study. Computational and Mathematical Methods in Medicine. 2013;2013:9. doi: 10.1155/2013/238676.238676 [DOI] [PMC free article] [PubMed] [Google Scholar]
- 28.Maleckar M. M., Greenstein J. L., Giles W. R., Trayanova N. A. K+ current changes account for the rate dependence of the action potential in the human atrial myocyte. American Journal of Physiology-Heart and Circulatory Physiology. 2009;297(4):H1398–H1410. doi: 10.1152/ajpheart.00411.2009. [DOI] [PMC free article] [PubMed] [Google Scholar]
- 29.Miragoli M., Gaudesius G., Rohr S. Electrotonic modulation of cardiac impulse conduction by myofibroblasts. Circulation Research. 2006;98(6):801–810. doi: 10.1161/01.RES.0000214537.44195.a3. [DOI] [PubMed] [Google Scholar]
- 30.Kim D. Novel cation-selective mechanosensitive ion channel in the atrial cell membrane. Circulation Research. 1993;72(1):225–231. doi: 10.1161/01.res.72.1.225. [DOI] [PubMed] [Google Scholar]
- 31.Courtemanche M., Ramirez R. J., Nattel S. Ionic mechanisms underlying human atrial action potential properties: insights from a mathematical model. American Journal of Physiology—Heart and Circulatory Physiology. 1998;275(1):H301–H321. doi: 10.1152/ajpheart.1998.275.1.H301. [DOI] [PubMed] [Google Scholar]
- 32.Luo C.-H., Rudy Y. A dynamic model of the cardiac ventricular action potential. I. Simulations of ionic currents and concentration changes. Circulation Research. 1994;74(6):1071–1096. doi: 10.1161/01.res.74.6.1071. [DOI] [PubMed] [Google Scholar]
- 33.Kiseleva I., Kamkin A., Pylaev A., et al. Electrophysiological properties of mechanosensitive atrial fibroblasts from chronic infarcted rat heart. Journal of Molecular and Cellular Cardiology. 1998;30(6):1083–1093. doi: 10.1006/jmcc.1998.0673. [DOI] [PubMed] [Google Scholar]
- 34.Kamkin A., Kiseleva I., Wagner K. D., et al. Mechanically induced potentials in fibroblasts from human right atrium. Experimental Physiology. 1999;84(2):347–356. doi: 10.1111/j.1469-445X.1999.01794.x. [DOI] [PubMed] [Google Scholar]
- 35.Kamkin A., Kiseleva I., Isenberg G. Activation and inactivation of a non-selective cation conductance by local mechanical deformation of acutely isolated cardiac fibroblasts. Cardiovascular Research. 2003;57(3):793–803. doi: 10.1016/S0008-6363(02)00775-7. [DOI] [PubMed] [Google Scholar]
- 36.Kamkin A., Kiseleva I., Wagner K.-D., et al. A possible role for atrial fibroblasts in postinfarction bradycardia. American Journal of Physiology—Heart and Circulatory Physiology. 2002;282(3):H842–H849. doi: 10.1152/ajpheart.00240.2001. [DOI] [PubMed] [Google Scholar]
- 37.Kamkin A., Kiseleva I., Wagner K.-D., Lozinsky I., Günther J., Scholz H. Mechanically induced potentials in atrial fibroblasts from rat hearts are sensitive to hypoxia/reoxygenation. Pflugers Archiv European Journal of Physiology. 2003;446(2):169–174. doi: 10.1007/s00424-003-1032-0. [DOI] [PubMed] [Google Scholar]
- 38.Chilton L., Giles W. R., Smith G. L. Evidence of intercellular coupling between co-cultured adult rabbit ventricular myocytes and myofibroblasts. The Journal of Physiology. 2007;583(1):225–236. doi: 10.1113/jphysiol.2007.135038. [DOI] [PMC free article] [PubMed] [Google Scholar]
- 39.Rook M. B., Van Ginneken A. C. G., De Jonge B., El Aoumari A., Gros D., Jongsma H. J. Differences in gap junction channels between cardiac myocytes, fibroblasts, and heterologous pairs. American Journal of Physiology-Cell Physiology. 1992;263(5):C959–C977. doi: 10.1152/ajpcell.1992.263.5.C959. [DOI] [PubMed] [Google Scholar]
- 40.Zabel M., Koller B. S., Sachs F., Franz M. R. Stretch-induced voltage changes in the isolated beating heart: importance of the timing of stretch and implications for stretch-activated ion channels. Cardiovascular Research. 1996;32(1):120–130. doi: 10.1016/0008-6363(96)00089-2. [DOI] [PubMed] [Google Scholar]
- 41.Ravelli F., Disertori M., Cozzi F., Antolini R., Allessie M. A. Ventricular beats induce variations in cycle length of rapid (type II) atrial flutter in humans. Evidence of leading circle reentry. Circulation. 1994;89(5):2107–2116. doi: 10.1161/01.cir.89.5.2107. [DOI] [PubMed] [Google Scholar]
- 42.Huang J.-L., Tai C.-T., Chen J.-T., et al. Effect of atrial dilatation on electrophysiologic properties and inducibility of atrial fibrillation. Basic Research in Cardiology. 2003;98(1):16–24. doi: 10.1007/s00395-003-0385-z. [DOI] [PubMed] [Google Scholar]
- 43.Bode F., Katchman A., Woosley R. L., Franz M. R. Gadolinium decreases stretch-induced vulnerability to atrial fibrillation. Circulation. 2000;101(18):2200–2205. doi: 10.1161/01.CIR.101.18.2200. [DOI] [PubMed] [Google Scholar]
- 44.Catterall W. A., Goldin A. L., Waxman S. G. International union of pharmacology. XLVII. Nomenclature and structure-function relationships of voltage-gated sodium channels. Pharmacological Reviews. 2005;57(4):397–409. doi: 10.1124/pr.57.4.4. [DOI] [PubMed] [Google Scholar]
- 45.Koivumäki J. T., Clark R. B., Belke D., et al. Na+ current expression in human atrial myofibroblasts: identity and functional roles. Frontiers in Physiology. 2014;5, article 275 doi: 10.3389/fphys.2014.00275. [DOI] [PMC free article] [PubMed] [Google Scholar]
- 46.Zlochiver S., Muñoz V., Vikstrom K. L., Taffet S. M., Berenfeld O., Jalife J. Electrotonic myofibroblast-to-myocyte coupling increases propensity to reentrant arrhythmias in two-dimensional cardiac monolayers. Biophysical Journal. 2008;95(9):4469–4480. doi: 10.1529/biophysj.108.136473. [DOI] [PMC free article] [PubMed] [Google Scholar]
Associated Data
This section collects any data citations, data availability statements, or supplementary materials included in this article.
Supplementary Materials
The Supplementary Material contained model equations, parameters values and initial conditions necessary to carry out the simulations presented in this article. The model equations included equations of the atrial myocyte model (Table 1 through 12), the atrial myofibroblast model (Table 13 through 19) and myofibroblast-myocyte coupling (Table 20). Parameters values and initial conditions were given in Table 21 through 23. Glossary was listed at the end.


