

Abstract
Principal component regression, a multivariate calibration technique, is an invaluable tool for the analysis of voltammetric data collected in vivo with acutely implanted microelectrodes. This method utilizes training sets to separate cyclic voltammograms into contributions from multiple electroactive species. The introduction of chronically implanted microelectrodes permits longitudinal measurements at the same electrode and brain location over multiple recordings. The reliability of these measurements depends on a consistent calibration methodology. One published approach has been the use of training sets built with data from separate electrodes and animals to evaluate neurochemical signals in multiple subjects. Alternatively, responses to unpredicted rewards have been used to generate calibration data. This study addresses these approaches using voltammetric data from three different experiments in freely moving rats obtained with acutely implanted microelectrodes. The findings demonstrate critical issues arising from the misuse of principal component regression that result in significant underestimates of concentrations and improper statistical model validation that, in turn, can lead to inaccurate data interpretation. Therefore, the calibration methodology for chronically implanted microelectrodes needs to be revisited and improved before measurements can be considered reliable.
Graphical abstract

In vivo measurement techniques such as microdialysis and electrochemical methods have enhanced understanding of the roles of neurotransmitters during behavior.1 One electrochemical technique, fast-scan cyclic voltammetry (FSCV), is particularly useful to detect subsecond dopamine release in behaving animals. The cyclic voltammograms (CVs) provided by this technique give chemically specific information for identification of contributing species. Most FSCV applications have utilized acutely implanted carbon-fiber microelectrodes, but chronically implanted electrodes have also been used.2 Chronically implanted electrodes are advantageous because they allow longitudinal recordings at the same location in the brain.
Calibration is a major concern with all in vivo techniques. Originally, the peak oxidation current in CVs for dopamine was scaled to concentration with a calibration factor obtained in vitro. However, this technique fails when multiple species overlap, as when pH and dopamine changes occur simultaneously,3–6 and are inappropriate for long-term dopamine measurements, such as slow basal level increases in response to cocaine7,8 and other prolonged responses9,10 where current contributions from interferences are more likely to play a role. Comparison of CVs with templates for dopamine, utilizing the correlation coefficient to confirm identity, has also been used.2,11 More recently, principal component analysis in tandem with inverse least-squares regression (PCA-ILS)12,13 has been introduced for resolving and quantifying overlapping compounds in FSCV data.7,14,15 PCA-ILS models use training sets containing CVs from multiple electroactive analytes for calibration.13 As a multivariate analysis technique, PCA-ILS uses the entire CV for concentration prediction. When used with acutely implanted electrodes, training sets can be constructed at the same brain location where behaviorally evoked chemical measurements were made using electrical stimulation to evoke defined chemical changes. Detailed description of the use of PCA-ILS with FSCV can be found elsewhere.7,12–17
Chronically implanted microelectrodes2 pose unique calibration problems. Longitudinal experiments need to demonstrate both electrode stability and reliable concentration calibration over successive recording sessions. The short durations of acute implantation studies minimize the neuroimmunological response and adhesion of biomolecules to the electrode, thus making postexperiment calibration factors obtained in vitro relevant to in vivo data.18 However, this may not be true for the extensive implantation times used in chronic recordings. The temporal distortion seen with chronically implanted microelectrodes2 suggests tissue encapsulation and/or biofouling, each of which represents a much different environment from those seen in post vivo calibration. Recent measurements with chronically implanted electrodes have found peak dopamine concentrations of 5 nM or less,10 which represents an order-of-magnitude deviation from dopamine concentrations measured with acutely implanted microelectrodes during natural reward.4,5 The chemoanalytical power of FSCV to determine concentrations is important because the affinity of receptors varies significantly between subtype, as highlighted for dopamine.19 Thus, these differences are concerning and may reflect problems with current calibration methodology for these sensors.
Because stimulating electrodes are rarely implanted with chronically implanted microelectrodes, robust dopamine and pH training sets are rarely obtained in the same location as behavioral measurements. To circumvent this problem, one approach has utilized unexpected sucrose delivery, a procedure that evokes dopamine transients,6 for within-subject analyte verification.20,21 Another calibration attempt has been the use of a “standard training set” built from electrically stimulated dopamine transients in separate subjects.8–10,22–30 Here, we compare these techniques at acutely implanted electrodes to previously established protocols for PCA-ILS using data from behaving animals. The results reveal that large concentration errors are introduced with these approaches to PCA-ILS. Furthermore, the standard training set approach nullifies the use of residual analysis for model validation.
EXPERIMENTAL SECTION
Animals
Male Sprague–Dawley rats (250–400 g) from Charles River (Wilmington, MA, USA, n = 6) and Harlan Sprague–Dawley (Indianapolis, IN, USA, n = 19) were housed individually on a 12/12 h light/dark cycle. Rats were given access to water ad libitum. For behavioral paradigms utilizing sucrose rewards, animals were food-restricted as described previously.31 Animal procedures were approved by the UNC-Chapel Hill Institutional Animal Care and Use Committee (IACUC).
Surgery
Rats were prepared for voltammetry experiments with acute electrodes. Following anesthesia, a guide cannula was implanted above the region for voltammetric measurements (above the nucleus accumbens (NAc) core for multiple schedule reinforcement and Pavlovian conditioning, above the NAc shell for intracranial self-stimulation (ICSS)). A bipolar stimulating electrode was implanted into the substantia nigra/ventral tegmental area (SN/VTA). A Ag/AgCl reference electrode was implanted in the contralateral hemisphere during surgery, except in ICSS animals where it was implanted on the day of experiments through a guide cannula.
Behavior
The behavioral training used in this work is described in more detail in the SI Materials and Methods and was adapted from prior publications. Training for multiple schedule reinforcement31 or Pavlovian conditioning32 were as described previously. During ICSS animals were allowed to press continuously for electrical stimulations to the SN/VTA area.33
FSCV
FSCV recordings were made after recovery from the implantation surgery and employed acutely implanted carbon-fiber electrodes. The voltammetry waveform was a triangular wave (−0.4 and 1.3 V vs Ag/AgCl) at 400 V/s with an application frequency of 10 Hz. Measurements were recorded with HDCV using interface cards (National Instruments, Austin, TX).34 In all animals, electrical stimulation was applied postexperiment to evoke dopamine and pH changes to form training sets as described previously.16 Unless stated otherwise, training sets were built at the same electrode and recording location as the experimental data using previously published software.34 Important terms for PCA-ILS are described in the Supporting Information. Further aspects of data analysis are described in the SI Materials and Methods.
Statistical Analysis
All statistical analyses were made in GraphPad Prism (GraphPad Software Incorporated, La Jolla, CA) and LabView (National Instruments, Austin, TX) with an α-value of 0.05.
RESULTS AND DISCUSSION
FSCV Measurements during Behavior Consist of Multiple Physiologically Relevant Components
FSCV data recorded in vivo contains contributions from numerous substances. Signals in dopamine rich regions often include pH changes that occur not only during electrical stimulation of dopaminergic pathways35 but also during unconditioned4,7,36 and Pavlovian36 behaviors. We illustrate these changes here with CVs obtained during a behavioral task for which we previously showed evoked fluctuations in dopamine.31 Rats were initially trained to press a lever for sucrose reward; each press resulted in one pellet (FR1) delivered into a nearby food receptacle. Rats were then trained to press a spatially separate lever (FR1) for intravenous infusions of cocaine. On test day, FSCV recordings were made during a multiple schedule, wherein rats responded for one reinforcer (FR1; sucrose, 15 min; or cocaine, 2 h), followed by a 20 s timeout period (no lever extended, dark chamber), and finally extension of the other reinforcer-paired lever. Reinforcer order was varied across animals.
Color plots of voltammetric data reveal qualitative aspects of the resulting chemical changes. Dopamine increases following lever presses (peak, 0.6 V) and is accompanied by a basic pH shift (peak, 0.2 V)37 (Figure 1a). These signals were resolved by PCA-ILS using a training set obtained at the same location via electrical stimulation of the SN/VTA. The average time course and amplitude of pH changes to sucrose and cocaine were found to be significantly different (Figure 1b), and both time courses differed from those seen with dopamine.31 The onset of pH changes preceded lever responding for cocaine but not for sucrose. Cocaine-reinforced pH responses were larger than sucrose-reinforced responses, regardless of reinforcer order (two-way mixed design ANOVA [sucrose vs cocaine, within subjects factors; reinforcer order, between subject factor]; F1,6 = 22.12, p < 0.005) (Figure 1c). This example critically illustrates the necessity for multivariate analysis when monitoring with FSCV, as each analyte carries distinct information.
Figure 1.
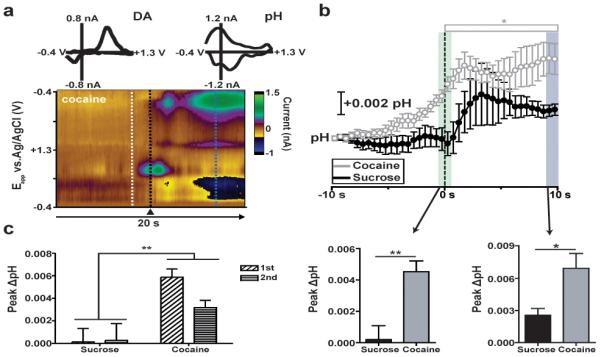
pH changes depend on reinforcer identity and order. a) Example of dopamine and basic pH shifts for one animal during performance of the sucrose/cocaine multiple schedule. A three-dimensional color plot is obtained by plotting time as the abscissa, the applied potential as the ordinate, and the current in false color. Insets: cyclic voltammograms (CVs) immediately surrounding lever press reflect dopamine (black dotted line), while CVs averaged at 7 s following lever press indicate basic shifts in pH (blue dotted line). Background subtraction at white dotted line. b) (Top) Changes in pH in the NAc core during sucrose and cocaine self-administration. pH is averaged into 500 ms bins (mean ± sem) and aligned to lever press (dotted line, time 0 s) for cocaine (gray) and sucrose (black). Open bar indicates bins significantly higher than baseline for cocaine (Newman-Keuls post hoc test, *p < 0.05). (Bottom) Comparison of peak pH within a 1 s window surrounding lever press (left, green column, p < 0.005) and 9–10 s later right, blue column, p < 0.5) for sucrose (black) versus cocaine (gray), p < 0.005. c) Comparison of peak pH within a 1 s window surrounding lever press for sucrose and cocaine when self-administered first (white bars) versus second (gray bars) in the multiple schedule, p < 0.005.
Training Sets from Natural Rewards
In experiments where it is inconvenient to implant stimulating electrodes, naturally occurring transients, such as those evoked with unexpected sucrose delivery,6 have been used for analyte verification. An example is shown in Figure 2a, where cue-, sucrose-, and electrically evoked dopamine CVs collected at the same electrode and recording location maintain a high correlation (0.91 < r2 < 0.99). However, this procedure provides only qualitative information. Instead, the naturally evoked transients could be used to build a PCA-ILS model that permits multivariate concentration prediction. To evaluate this approach, data was collected in four subjects that performed a behavioral discrimination task described previously.32 The signals here were dopamine transients in response to cues. Two training sets were built in each subject at the same electrode: one using transients evoked from sucrose delivery and the other from electrically evoked transients (Table S-1). The food pellets tended to give a narrower range of amplitudes than the electrical stimulations (Figure 2b). For each animal, the dopamine concentrations obtained with the training set employing electrical stimulation in the same animal were first determined. Next, the dopamine concentrations computed with the sucrose-evoked training set were determined, and the percent difference to the values obtained with electrically evoked training sets was found (Figure 2c). Generally, the dopamine concentrations predicted by sucrose-evoked training sets were considerably lower despite using the same electrode and sensitivity factor (ratio paired t test, p < 0.0001). The large majority of transients (96.1%) were underestimated with few overestimations (2.3%).
Figure 2.
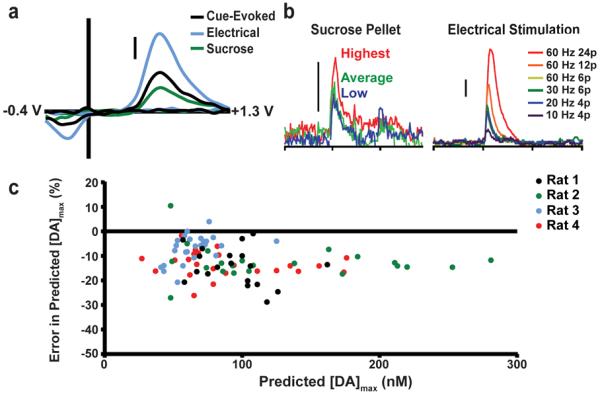
Training set construction with naturally evoked transients. a) Dopamine CVs evoked by cues, electrical stimulation, and unexpected sucrose delivery share high correlation. b) Dopamine transients evoked by unexpected delivery of sucrose pellets (left) post-experiment have a relatively small (maximum ~150 nM) and narrow (~60–70 nM) range. Varying stimulation parameters (right) enables generation of dopamine transients over a wide range. Scale bars: 100 nM [DA]. c) Peak dopamine concentration values obtained using training sets built with only naturally occurring transients post-experiment compared to values obtained with training sets built with electrical stimulation in the same subject. Sucrose-constructed training sets consistently predicted lower dopamine concentrations than electrical stimulation training sets.
These differences are likely due to the narrow range of concentrations obtained with the sucrose-evoked transients compared to those obtained with electrical stimulations. Postexperiment transients evoked with unexpected sucrose delivery can fail to span the concentration range of transients seen during behavior, which has been stated previously to be an important facet of training set construction.14 Moreover, it is more difficult to separate sucrose-evoked dopamine transients from other chemical events, such as overlapping pH and ionic fluctuations, than it is for time-locked electrical stimulations, resulting in the use of impure training set standards for model construction. With a narrow calibration range, impure standards will have an undue influence on the extrapolation of the calibration curve to higher concentrations.
PCA-ILS and Training Sets from Different Electrodes
An alternate approach has been the use of training sets built with electrodes from other experiments to predict concentrations. To further investigate this approach, we used data from rats executing ICSS.33 The data sets from each of the five animals were designated by the letters A–E. Animals pressed a lever repetitively for approximately 2 min, and each lever press evoked electrical stimulation of the SN/VTA. Voltammetric responses were measured in the NAc with acutely implanted carbon-fiber microelectrodes. A representative color plot (Figure 3) indicates both dopamine and pH changes, observed in all animals. Interestingly, the individual voltammogram shown (top left) was highly correlated with an isolated, electrically evoked dopamine CV (r2 = 0.851) despite clearly containing pH contributions, illustrating that the template approach2,11 is insufficient for species resolution.
Figure 3.
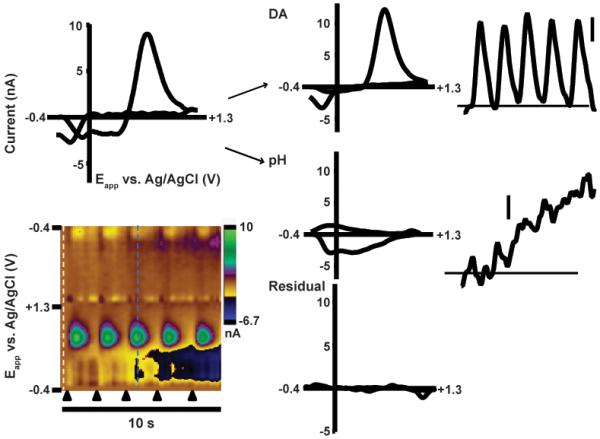
Use of principal component analysis to predict analyte concentrations. The white dotted line represents the cyclic voltammogram used for digital background subtraction. Each black triangle indicates a lever press-induced electrical stimulation, resulting in dopamine release. The inset cyclic voltammogram (top left) was collected at the blue dotted line. Principal component analysis allows separation of the total current into contributions from dopamine and pH, with any remaining current contained in a residual voltammogram (bottom right). Using this method, concentration versus time traces are acquired for both analytes (top right, DA and middle right, pH). Scale bars: 250 nM [DA], 0.025 pH.
Training sets for dopamine and pH changes were constructed from data obtained during experimenter-delivered electrical stimulation in each animal. Five CVs were used for each analyte. The K-matrices from these data (Figure 4a–b) serve as graphical representations of the general shape of the CVs for each particular analyte. The overall shapes of dopamine and pH K-matrices were similar across subjects, as evidenced by high correlation coefficients between K-matrices (Pearson's r, 0.953 < r < 0.992 for dopamine, 0.950< r < 0.985 for pH).
Figure 4.
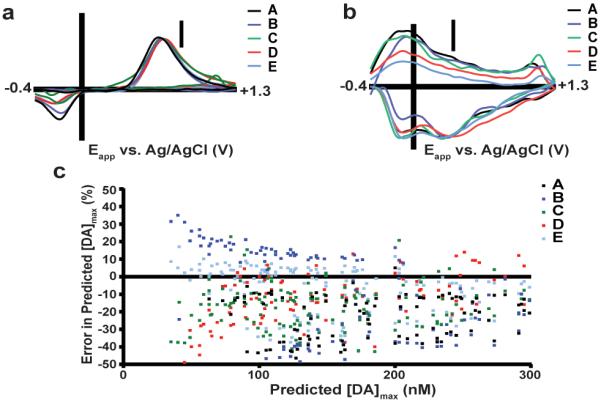
Training sets built in different subjects predict different dopamine transient concentrations. a) Dopamine K-matrices for five different training sets (A–E). Each K-matrix is normalized to the external calibration factor (10 nA/μM) measured at the peak anodic potential (Ep,a). Differences are seen in the ratio of peak currents, peak location, and separation between the anodic and cathodic peaks. b) pH K-matrices from training sets A–E. Each K-matrix is normalized to the external calibration factor (−40 nA/pH unit) at EQ,H. c) Dopamine transients seen during ICSS were first analyzed with the training set built in the same subject as the unknown data set. These transients were subsequently analyzed with training sets built in other subjects, and these values were compared to the original predicted concentration.
First, we calculated the concentrations of dopamine transients ([DA]max) during ICSS for each animal using the training set obtained within-subject. Next, we evaluated dopamine concentrations using training sets obtained with different microelectrodes and subjects, and these concentration predictions were compared to those predicted by the within-subject training set (Figure 4c). Significant differences were found (repeated measures one-way ANOVA with Dunnet's multiple comparisons (Table S-2)). Application of training sets from other animals tended to underestimate [DA]max (78.4% peaks), though overestimations also occurred (20.3%). Percent deviations widely varied over a physiological range of transients (~50–300 nM), with deviations approaching 50% for some transients.
Inspection of the CVs comprising the training sets reveals the origin of these errors (Table 1). Despite the high correlation between K-matrices, differences in peak locations, peak separations, and ratios of peak currents exist between training sets at separate electrodes. Because PCA-ILS utilizes the entire CV for concentration prediction, variation in these key CV characteristics between electrodes causes PCA-ILS models using different training sets to predict different responses when applied to the same data set. Because training sets generated from recordings with the same electrode and recording session contain features similar to experimental CVs, they provide the best estimate of actual analyte responses. Thus, the variability in Figure 4c reveals the failure of calibration with alternate (between-subject) training sets that will ultimately lead to erroneous data interpretation.
Table 1.
Key Parameters from the K-Matrices for Dopamine and pH Changes Collected in Five Separate Animalsa
| dopamine |
pH |
||||||||||
|---|---|---|---|---|---|---|---|---|---|---|---|
| T.S. | Ep,a (V) | Ep,c (V) | ΔEp (V) | Ip,a/Ip,c | Ip,a range (nA) | EC (V) | EQH (V) | EQ (V) | IQH/IQ | IQH range (nA) | Qα (nA2) |
| A | 0.65 | −0.19 | 0.84 | 1.74 | 0.37–2.74 | −0.11 | 0.22 | −0.06 | 0.90 | −0.57 to –1.72 | 217.6 |
| B | 0.68 | −0.18 | 0.86 | 2.14 | 1.00–11.14 | −0.10 | 0.30 | −0.07 | 1.02 | −1.20 to –2.52 | 492.5 |
| C | 0.67 | −0.19 | 0.86 | 3.80 | 0.71–4.17 | −0.13 | 0.26 | −0.09 | 1.02 | −0.81 to –1.72 | 312.0 |
| D | 0.70 | −0.24 | 0.94 | 3.57 | 0.57–7.87 | −0.10 | 0.37 | −0.10 | 1.39 | −1.34 to –3.96 | 571.7 |
| E | 0.69 | −0.22 | 0.91 | 3.54 | 1.44–15.3 | −0.09 | 0.25 | −0.10 | 2.04 | −2.02 to –6.58 | 858.8 |
The importance of these parameters in cyclic voltammetry is highlighted in “Electrochemical Methods: Fundamentals and Applications” by Bard and Faulkner (see Chapter 6, Figure 6.2.1–6.2.2) for dopamine and citation 35 for pH.
Residual Analysis
While the preceding results show that the use of inappropriate training sets leads to significant errors in concentration prediction, an even larger problem is that model validation is precluded. For training sets established within the same animal and same electrode, we have used residual analysis for validation,14,15 in which a residual is calculated from the voltammetric currents unaccounted for by the training sets. If the squared sum of residual current at each applied potential for a particular CV (Qt) exceeds a training set-specific threshold value (Qα), then, according to Jackson,38 a source of variance not accounted for in the PCA-ILS model is significantly contributing to the signal, indicating the model is invalid to analyze the data.
As an example, the ten-second trace in Figure 3 was analyzed with both the training set built in the same subject (E), the appropriate training set, as well as a training set built from data obtained in another animal (C). Training set C yielded a relatively small (~17%) error in concentration prediction (compared to E) due to a notably high signal-to-noise ratio (S/N) of this data trace. The Qt values obtained with the appropriate training set (E) did not exceed its Qα, indicating a valid analysis (Figure 5a). In contrast, Qt values for training set C frequently exceeded its Qα value (Figure 5b), indicating that large parts of this analysis are invalid. Color plots of the residuals allow these unassigned currents to be evaluated as a function of potential. The invalid analysis (training set C, Figure 5b) reveals considerable unassigned current near the peak locations for dopamine and pH, features not present for the valid training set E (Figure 5a).
Figure 5.
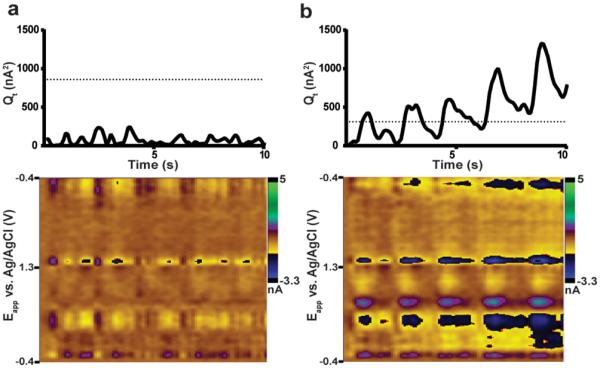
Residual analysis with different training sets. a) The residual trace and color plot from a training set built in the same subject (E). The residual trace remains below the residual threshold (dotted line, Qα = 858.8). The residual plot contains a small amout of unaccounted current at potentials where dopamine and pH contribute. b) The residual trace and color plot from a training set built in a different animal (C) applied to these data. The residual trace rises throughout the trace and crosses the residual threshold (Qα = 312.0). The residual color plot reveals large sources of discarded current near potentials for dopamine and pH.
The number of residual threshold crosses at [DA]max varied between applied training sets for each data set (Table 2). Data sets with low noise result in few to no residual crosses across training sets (ex. data set A). However, alternative training sets can produce more residual threshold crosses than analysis with within-subject training sets, rejecting experimental data that would be retained using proper PCA-ILS protocol (ex. data set C, E). Conversely, alternative training sets can result in fewer residual crosses than the within-subject training set, as is the case with training sets with larger Qα (ex. training set E). This leads to the retention of questionable data that should have been discarded. The inappropriate inclusion of false data or exclusion of accurate data illustrates the failure of model validation when using generalized training sets.
Table 2.
Number of Transients for Which Qt (at [DA]max) Exceeded the Qα Threshold during Various Training Set Misapplicationsa
| data set |
|||||
|---|---|---|---|---|---|
| A (n = 52) | B (n = 64) | C (n = 22) | D (n = 65) | E (n = 60) | |
| training set A (Qα = 217.6) | 0 | 18 | 17 | 10 | 53 |
| training set B (Qα = 389.1) | 0 | 7 | 14 | 8 | 43 |
| training set C (Qα = 279.9) | 0 | 18 | 5 | 0 | 10 |
| training set D (Qα = 584.7) | 0 | 4 | 0 | 0 | 1 |
| training set E (Qα = 906.6) | 0 | 3 | 10 | 0 | 0 |
Analysis with the appropriate training set is highlighted in bold, with the number of residual crosses shown for alternate training sets shown for each data set. n = the number of electrically evoked transients in each data set.
Standard Training Sets Constructed from Multiple Electrodes
Recently, some have adopted a PCA-ILS approach that analyzes data using a “standard training set” built from CVs collected in multiple subjects.8–10,22–29 Ideally, the generality of this training set would allow it to be more applicable across data sets than alternate training sets built from single electrodes.
To evaluate this approach, composite training sets containing 10 CVs were made using one dopamine and one pH CV selected at random from each training set (A–E) shown above. Due to the large number of possible training sets (510), the number of training sets constructed was limited to 10,000, and the resulting K-matrices for each training set were averaged. While the average K-matrices for DA and pH exhibit standard shapes for these analytes, variability was seen between training sets, particularly between pH K-matrices (Figure 6a). Furthermore, a wide range of Qα values is seen between composite training sets (Figure 7a), indicating an inconsistent treatment of noise.
Figure 6.

K-Matrices from composite training sets built with standards collected at different carbon-fiber microelectrodes. a) Composite training sets containing 10 CVs were made using one dopamine and one pH CV selected at random from each training set (A–E). b) As in a) but made with 20 CVs using two dopamine and two pH CVs selected randomly from each training set. c) As in a) but made with 30 CVs using three dopamine and three pH CVs randomly selected from each training set. d) As in a) but made with 40 CVs using four dopamine and four pH CVs randomly selected from each training set. Average (solid line) and 95% confidence limits (dotted line) for both DA and pH K-matrices (n = 10,000) are shown for each training set size.
Figure 7.
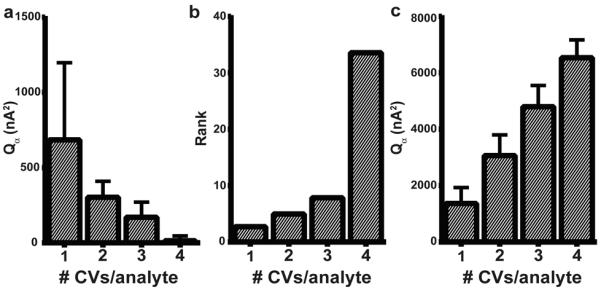
Parameters of interest for composite generalized training sets. a) As the rank increases, the Qα value decreases (684.1 ± 513.5, 303.6 ± 106.2, 170.1 ± 101.0, and 13.5 ± 32.3 nA2 for one through four CVs/analyte from each training set, respectively.) b) As the number of CVs/analyte incorporated from electrode is increased, the rank (or number of primary components) increases (2.7 ± 0.7, 5.0 ± 0.7, 7.8 ± 1.3, and 33.5 ± 10.2 for one through four CVs/analyte, respectively.) c) If the number of principal components retained is restricted to two, the Qα values increase dramatically as more CVs/analyte from each electrode (i.e., larger number of total standards) are used (1366.6 ± 563.8, 3065.5 ± 732.0, 4798.8 ± 750.0, 6535.1 ± 634.3 for one through four CVs/analyte respectively). Numbers are expressed as mean ± standard deviation (n = 10,000 for each training set size).
If this variability reflects bias based on the random selection of CV standards, increasing the number of standards could provide more consistent K-matrices. However, increasing the number of CV standards selected from each training set resulted in K-matrices that no longer resemble the represented analytes (Figure 6b–d). This reduced ability of PCA-ILS to reliably identify dopamine and pH stems from the increased rank of these training sets (Figure 7b). PCA-ILS calculates a number of principal components (PCs) equal to the number of standards in the training set. These PCs are separated into PCs that describe significant sources of variance (primary PCs) and those that do not (secondary PCs). Rank, the number of retained primary PCs, is an important parameter in PCA-ILS that we determine using Malinowski's F-test.16 With this approach, each individual training set (A–E) had two primary PCs, reflecting features for both dopamine and pH changes. However, in composite training sets built from multiple electrodes, standard CVs have a wider range of key characteristics (Table 1) and different sources of deterministic current. This requires more primary PCs (i.e., higher rank) to describe the sources of variance. As a result, the signal for the analytes is spread among several PCs, leading to K-matrices without clear depictions of each analyte. In this case, the calibration model will overfit the data, causing a diminished tolerance for uncaptured variance and a reduction in the Qα values. (Figure 7a). These problems are common to PCA-ILS and are well characterized in the literature.12
In principle, one could restrain the number of primary PCs to two, reflecting only variance within dopamine and pH signals. This leads to much cleaner K-matrices for dopamine and pH for all training set sizes (Figure 8). However, because Qα values are largely determined by information in secondary PCs,14,15 the forced removal of PCs that Malinowski's F-test would retain results in very large Qα values (Figure 7c), precluding model validation.
Figure 8.

K-Matrices for composite training sets constrained to two principal components. Composite training sets containing one (a), two (b), three (c), and four (d) cyclic voltammogram standards per analyte (dopamine and pH) from each individual training set (A–E) were constructed. Instead of determining the rank of each training set with Malinowski's F-test, the number of principal components for each composite training set was constrained to two. The average (solid line) and 95% confidence limits (dotted line) for both DA and pH K-matrices (N = 10,000) are displayed for each training set size. The shape of the average K-matrices for dopamine and pH were independent of training set size (Pearson's correlation, 0.999 ≤ r ≤ 1.000 for DA, 0.999 ≤ r ≤ 1.000 for pH).
CONCLUSIONS
When used correctly, PCA-ILS is a powerful tool to unravel overlapping signals, particularly for CVs in awake, behaving animals. As shown here and elsewhere, pH changes serve as an intriguing indirect marker for local activity4,36 in various behavioral paradigms, carrying its own unique signal. However, despite its advantages, PCA-ILS can only provide meaningful results with training sets obtained by appropriate protocols. Calibration sets need to span the concentration range that occurs during behavior.
Furthermore, they should be generated using the same equipment used to collect the experimental data. Indeed, the transfer of multivariate calibration models between instrumentation is a well-documented problem in the literature.39 The generalized training sets do not provide a suitable PCA-ILS model for two major reasons. First, their application leads to significant underestimations of concentrations, effectively diminishing the signal-to-noise ratio, masking small, yet biologically relevant signals. Second, generalized training sets violate the theory behind residual analysis, which is important for model validation.
For FSCV, these problems arise from differences in CVs between electrodes, which can arise from multiple sources. Reference electrodes have been known to drift during chronic implantation,7,40 leading to voltage offsets in the CVs. Voltage distortion may be particularly problematic when using chronically implanted microelectrodes, because impedance changes following implantation41 could cause CVs to vary across recording sessions. Nonetheless, the use of acutely implanted working and reference electrodes in this study did not prevent differences between electrodes. This reflects a fundamental limitation in comparing CVs across different carbon-fiber microelectrodes: carbon surfaces are complex and heterogeneous,37 leading to differences in electron-transfer and adsorption kinetics. Particularly, the pH signal was shown to vary widely across electrodes in this study, a perhaps unsurprising finding due to the strong dependence of the pH response on the surface state of the electrode.37 Thus, building separate training sets for each carbon-fiber electrode becomes essential to convert experimental data into meaningful chemical information. The unpredictable deviations in dopamine concentrations across training sets (Figure 4c) make it unlikely that a standard training set could be constructed that would be consistent to all experiments. Indeed, PCA-ILS has been used to demonstrate systematic differences between instruments, rather than reconcile data between them.42 Furthermore, a principal advantage of PCA-ILS is its ability to separate sources of variance into distinct contributions from signal and noise.14,15 This advantage is violated 2-fold with generalized training sets, as standards from different electrodes will not reflect noise in the experimental data set and will introduce unrepresentative noise.
A principal advantage of using chronically implanted microelectrodes is to monitor changes in dopamine over time at the same electrode and recording site. For such trends across recording sessions to be considered reliable, it must be established that concentration calibration methods can act consistently across recording days. In light of the variability in training sets from different electrodes, improved calibration methodology for these sensors is crucial. Otherwise, improper PCA-ILS protocols could mask true longitudinal trends in dopamine release. Thus, as the original developers of PCA stated,12,43 the PCA-ILS model must be generated under the same experimental conditions as the data to be analyzed.
Supplementary Material
ACKNOWLEDGMENTS
Dr. Elizabeth Bucher and Meg Fox are acknowledged for helpful advice early in the manuscript process. This research was supported by grants from the NIH (DA010900 to R.M.W. and DA017318 to R.M.C.).
Footnotes
Supporting Information The Supporting Information is available free of charge on the ACS Publications website at DOI: 10.1021/acs.analchem.5b03222.
Table of average concentration values for data sets across different training set calibrations, table comparing the K-matrices for sucrose-constructed and electrical stimulation training sets at the same electrode, supplementary experimental methods, and a glossary of important terms in PCA-ILS (PDF)
Author Contributions All authors have given approval to the final version of the manuscript.
The authors declare no competing financial interest.
REFERENCES
- (1).Bucher ES, Wightman RM. Annu. Rev. Anal. Chem. 2015;8:239. doi: 10.1146/annurev-anchem-071114-040426. [DOI] [PMC free article] [PubMed] [Google Scholar]
- (2).Clark JJ, Sandberg SG, Wanat MJ, Gan JO, Horne EA, Hart AS, Akers CA, Parker JG, Willuhn I, Martinez V, Evans SB, Stella N, Phillips PE. Nat. Methods. 2010;7:126. doi: 10.1038/nmeth.1412. [DOI] [PMC free article] [PubMed] [Google Scholar]
- (3).Phillips PEM, Stuber GD, Heien MLAV, Wightman RM, Carelli RM. Nature. 2003;422:614. doi: 10.1038/nature01476. [DOI] [PubMed] [Google Scholar]
- (4).Roitman MF, Wheeler RA, Wightman RM, Carelli RM. Nat. Neurosci. 2008;11:1376. doi: 10.1038/nn.2219. [DOI] [PMC free article] [PubMed] [Google Scholar]
- (5).Roitman MF, Stuber GD, Phillips PE, Wightman RM, Carelli RMJ. Neurosci. 2004;24:1265. doi: 10.1523/JNEUROSCI.3823-03.2004. [DOI] [PMC free article] [PubMed] [Google Scholar]
- (6).Day JJ, Roitman MF, Wightman RM, Carelli RM. Nat. Neurosci. 2007;10:1020. doi: 10.1038/nn1923. [DOI] [PubMed] [Google Scholar]
- (7).Heien ML, Khan AS, Ariansen JL, Cheer JF, Phillips PE, Wassum KM, Wightman RM. Proc. Natl. Acad. Sci. U. S. A. 2005;102:10023. doi: 10.1073/pnas.0504657102. [DOI] [PMC free article] [PubMed] [Google Scholar]
- (8).Willuhn I, Burgeno LM, Groblewski PA, Phillips PE. Nat. Neurosci. 2014;17:704. doi: 10.1038/nn.3694. [DOI] [PMC free article] [PubMed] [Google Scholar]
- (9).Howe MW, Tierney PL, Sandberg SG, Phillips PE, Graybiel AM. Nature. 2013;500:575. doi: 10.1038/nature12475. [DOI] [PMC free article] [PubMed] [Google Scholar]
- (10).Hollon NG, Arnold MM, Gan JO, Walton ME, Phillips PE. Proc. Natl. Acad. Sci. U. S. A. 2014;111:18357. doi: 10.1073/pnas.1419770111. [DOI] [PMC free article] [PubMed] [Google Scholar]
- (11).Robinson DL, Venton BJ, Heien ML, Wightman RM. Clin. Chem. 2003;49:1763. doi: 10.1373/49.10.1763. [DOI] [PubMed] [Google Scholar]
- (12).Kramer R. Chemometric Techniques for Quantitative Analysis. Marcel Dekker, Inc; New York: 1998. [Google Scholar]
- (13).Heien ML, Johnson MA, Wightman RM. Anal. Chem. 2004;76:5697. doi: 10.1021/ac0491509. [DOI] [PubMed] [Google Scholar]
- (14).Keithley RB, Heien ML, Wightman RM. TrAC, Trends Anal. Chem. 2009;28:1127. doi: 10.1016/j.trac.2009.07.002. [DOI] [PMC free article] [PubMed] [Google Scholar]
- (15).Keithley RB, Heien ML, Wightman RM. TrAC, Trends Anal. Chem. 2010;29:110. [Google Scholar]
- (16).Keithley RB, Carelli RM, Wightman RM. Anal. Chem. 2010;82:5541. doi: 10.1021/ac100413t. [DOI] [PMC free article] [PubMed] [Google Scholar]
- (17).Keithley RB, Wightman RM. ACS Chem. Neurosci. 2011;2:514. doi: 10.1021/cn200035u. [DOI] [PMC free article] [PubMed] [Google Scholar]
- (18).Peters JL, Miner LH, Michael AC, Sesack SR. J. Neurosci. Methods. 2004;137:9. doi: 10.1016/j.jneumeth.2004.02.006. [DOI] [PubMed] [Google Scholar]
- (19).Tritsch NX, Sabatini BL. Neuron. 2012;76:33. doi: 10.1016/j.neuron.2012.09.023. [DOI] [PMC free article] [PubMed] [Google Scholar]
- (20).Gan JO, Walton ME, Phillips PE. Nat. Neurosci. 2010;13:25. doi: 10.1038/nn.2460. [DOI] [PMC free article] [PubMed] [Google Scholar]
- (21).Wanat MJ, Kuhnen CM, Phillips PE. J. Neurosci. 2010;30:12020. doi: 10.1523/JNEUROSCI.2691-10.2010. [DOI] [PMC free article] [PubMed] [Google Scholar]
- (22).Flagel SB, Clark JJ, Robinson TE, Mayo L, Czuj A, Willuhn I, Akers CA, Clinton SM, Phillips PE, Akil H. Nature. 2011;469:53. doi: 10.1038/nature09588. [DOI] [PMC free article] [PubMed] [Google Scholar]
- (23).Goertz RB, Wanat MJ, Gomez JA, Brown ZJ, Phillips PE, Paladini CA. Neuropsychopharmacology. 2015;40:1151. doi: 10.1038/npp.2014.296. [DOI] [PMC free article] [PubMed] [Google Scholar]
- (24).Wanat MJ, Bonci A, Phillips PE. Nat. Neurosci. 2013;16:383. doi: 10.1038/nn.3335. [DOI] [PMC free article] [PubMed] [Google Scholar]
- (25).Willuhn I, Tose A, Wanat MJ, Hart AS, Hollon NG, Phillips PE, Schwarting RK, Wohr MJ. Neurosci. 2014;34:10616. doi: 10.1523/JNEUROSCI.1060-14.2014. [DOI] [PMC free article] [PubMed] [Google Scholar]
- (26).Clark JJ, Collins AL, Sanford CA, Phillips PE. J. Neurosci. 2013;33:3526. doi: 10.1523/JNEUROSCI.5119-12.2013. [DOI] [PMC free article] [PubMed] [Google Scholar]
- (27).Hart AS, Rutledge RB, Glimcher PW, Phillips PE. J. Neurosci. 2014;34:698. doi: 10.1523/JNEUROSCI.2489-13.2014. [DOI] [PMC free article] [PubMed] [Google Scholar]
- (28).Nasrallah NA, Clark JJ, Collins AL, Akers CA, Phillips PE, Bernstein IL. Proc. Natl. Acad. Sci. U. S. A. 2011;108:5466. doi: 10.1073/pnas.1017732108. [DOI] [PMC free article] [PubMed] [Google Scholar]
- (29).Parker JG, Zweifel LS, Clark JJ, Evans SB, Phillips PE, Palmiter RD. Proc. Natl. Acad. Sci. U. S. A. 2010;107:13491. doi: 10.1073/pnas.1007827107. [DOI] [PMC free article] [PubMed] [Google Scholar]
- (30).Willuhn I, Burgeno LM, Everitt BJ, Phillips PE. Proc. Natl. Acad. Sci. U. S. A. 2012;109:20703. doi: 10.1073/pnas.1213460109. [DOI] [PMC free article] [PubMed] [Google Scholar]
- (31).Cameron CM, Wightman RM, Carelli RM. Neuropharmacology. 2014;86:319. doi: 10.1016/j.neuropharm.2014.08.006. [DOI] [PMC free article] [PubMed] [Google Scholar]
- (32).Saddoris MP, Carelli RM. Biol. Psychiatry. 2014;75:156. doi: 10.1016/j.biopsych.2013.07.037. [DOI] [PMC free article] [PubMed] [Google Scholar]
- (33).Garris PA, Kilpatrick M, Bunin MA, Michael D, Walker QD, Wightman RM. Nature. 1999;398:67. doi: 10.1038/18019. [DOI] [PubMed] [Google Scholar]
- (34).Bucher ES, Brooks K, Verber MD, Keithley RB, Owesson-White C, Carroll S, Takmakov P, McKinney CJ, Wightman RM. Anal. Chem. 2013;85:10344. doi: 10.1021/ac402263x. [DOI] [PMC free article] [PubMed] [Google Scholar]
- (35).Venton BJ, Michael DJ, Wightman RM. J. Neurochem. 2003;84:373. doi: 10.1046/j.1471-4159.2003.01527.x. [DOI] [PubMed] [Google Scholar]
- (36).Ariansen JL, Heien ML, Hermans A, Phillips PE, Hernadi I, Bermudez MA, Schultz W, Wightman RM. Front. Behav. Neurosci. 2012;6:36. doi: 10.3389/fnbeh.2012.00036. [DOI] [PMC free article] [PubMed] [Google Scholar]
- (37).Takmakov P, Zachek MK, Keithley RB, Bucher ES, McCarty GS, Wightman RM. Anal. Chem. 2010;82:9892. doi: 10.1021/ac102399n. [DOI] [PMC free article] [PubMed] [Google Scholar]
- (38).Jackson JE, Mudholkar GS. Technometrics. 1979;21:341. [Google Scholar]
- (39).Feudale RN, Woody NA, Tan HW, Myles AJ, Brown SD, Ferre J. Chemom. Intell. Lab. Syst. 2002;64:181. [Google Scholar]
- (40).Zhang XJ, Wang J, Ogorevc B, Spichiger UE. Electroanalysis. 1999;11:945. [Google Scholar]
- (41).Williams JC, Hippensteel JA, Dilgen J, Shain W, Kipke DR. J. Neural Eng. 2007;4:410. doi: 10.1088/1741-2560/4/4/007. [DOI] [PubMed] [Google Scholar]
- (42).Rao CR. Sankhyā A. 1964;26:329. [Google Scholar]
- (43).Jolliffe IT. Principal component analysis. 2nd ed. Springer; New York: 2002. [Google Scholar]
Associated Data
This section collects any data citations, data availability statements, or supplementary materials included in this article.