

Abstract
BCOR is a component of a variant Polycomb group repressive complex 1 (PRC1). Recently, we and others reported recurrent somatic BCOR loss-of-function mutations in myelodysplastic syndrome and acute myelogenous leukaemia (AML). However, the role of BCOR in normal hematopoiesis is largely unknown. Here, we explored the function of BCOR in myeloid cells using myeloid murine models with Bcor conditional loss-of-function or overexpression alleles. Bcor mutant bone marrow cells showed significantly higher proliferation and differentiation rates with upregulated expression of Hox genes. Mutation of Bcor reduced protein levels of RING1B, an H2A ubiquitin ligase subunit of PRC1 family complexes and reduced H2AK119ub upstream of upregulated HoxA genes. Global RNA expression profiling in murine cells and AML patient samples with BCOR loss-of-function mutation suggested that loss of BCOR expression is associated with enhanced cell proliferation and myeloid differentiation. Our results strongly suggest that BCOR plays an indispensable role in hematopoiesis by inhibiting myeloid cell proliferation and differentiation and offer a mechanistic explanation for how BCOR regulates gene expression such as Hox genes.
INTRODUCTION
BCOR was originally identified via its interaction with the site-specific DNA binding transcription factor BCL6 whose aberrant expression drives formation of diffuse large B cell lymphomas (DLBCL).1,2 BCOR is likely to be a crucial mediator of BCL6 function in these cancers.3 By contrast, recurrent somatic BCOR mutations have been identified in human cancers including retinoblastoma, medulloblastoma, osteosarcoma, and hepatocellular carcinoma4–8 suggesting that BCOR can also function as a tumor suppressor protein. Using whole-exome sequencing, we and others have recently detected somatic BCOR mutations in acute myelogenous leukaemia with normal karyotypes (CN-AML, 3.8%), myelodysplastic syndrome (MDS, 4.2%), and chronic myelomonocytic leukemia (CMML, 7.4%) and found that these mutations are associated with a poor prognosis.9,10 Recent reports showed the presence of somatic mutations of BCOR in acquired aplastic anemia.11,12 However, knowledge of the role that BCOR plays in normal hematopoiesis is limited and its potential function as a tumor suppressor in hematopoietic transformation is largely unknown.
The X-linked BCOR gene is essential for human development.13 Female patients harboring heterozygous mutations in BCOR develop oculofaciocardiodental (OFCD) syndrome. Peripheral blood lymphocytes from OFCD patients show strongly biased inactivation of the X chromosome harboring the mutant BCOR allele,13 suggesting that BCOR is required for normal hematopoiesis. Furthermore in mice, BCOR appears to play a role in differentiation of primitive erythroid and lymphoid cells.14
BCOR is found in a multi-subunit complex with mammalian homologs of Polycomb-group (PcG) proteins.15–17 PcG genes were originally identified in Drosophila melanogaster as negative regulators of Hox genes.18 PcG protein homologs are involved in many biological processes in mammals, including maintenance of stem cell identity, differentiation and cancer development19–21 and are involved in various cellular functions including posttranslational histone modification and chromatin compaction.22 Polycomb Repressive Complex-1 (PRC1) and -2 (PRC2) are the two main PcG complexes, which catalyze repressive histone modifications: monoubiquitination of histone H2A at lysine-119 (H2AK119ub) and methylation of histone H3 at lysine-27 (H3K27me), respectively.20,23–25 At least six mammalian PRC1 complexes (PRC1.1-PRC1.6) have been identified that have different subunit compositions but all contain the RING1A/B catalytic subunit(s).17 BCOR is a component of the PRC1.1 complex that contains RING1A/B, PCGF1, RYBP/YAF2, SKP1 and KDM2B.16,17
The biological and functional relevance of the diversity of PRC1 complexes is an active area of investigation. Analysis of loss- or gain-of-function alleles of components of the PRC1 complex can provide insights into specific roles of that complex. Here, we have taken this approach to investigate the role of BCOR and thus PRC1.1 in hematopoiesis. We report that BCOR plays an important role in regulating hematopoietic cell proliferation and differentiation. BCOR is involved in maintaining RING1B protein abundance and regulates gene transcription through regulation of H2A ubiquitination. Our data indicate that BCOR provides an important link between transcriptional and epigenetic regulation that is required for myeloid cell proliferation and differentiation.
MATERIALS AND METHODS
Mice
The details of the generation of the BcorFl/Y allele will be described elsewhere (Hamline, Corcoran, Wamstad et al., in prep.). In brief, exons 9 and 10 of Bcor allele were flanked by LoxP sites to allow their removal via expression of Cre recombinase. Excision of these exons results in a frame shift and a premature stop codon causing nonsense mediated decay and/or carboxy-terminal deletion of the BCOR protein. The details of the generation of the Rosa26LsLmBcorA allele will be described elsewhere (Hamline, Corcoran, Wamstad et al., in prep.). In brief, a conditional (Lox-Stop-Lox) myc-tagged Bcor splice version A (mBcorA) expression cassette was inserted into the murine Rosa26 locus (Rosa26LsLmBcorA). mBcorA overexpression can be induced by Cre excision of the loxP-flanked Stop-cassette (LsL).
Cell culture, transfection and electroporation
BcorFl/Y BM cells were cultured in Iscove’s Modified Dulbecco’s Media (Invitrogen, Grand Island, NY,) with 20% fetal bovine serum (FBS) plus 50 ng/ml stem cell factor (SCF), 25 ng/ml IL6 and 10 ng/ml IL-3. HL60, NB4 and 293T cells (American Type Culture Collection, Manassas, VA) were cultured in RPMI-1640 medium plus 10% FBS. HL60 and NB4 cells were transfected either with non-targeted siRNA or siRNA against BCOR (Dharmacon, Grand Island, NY, 5′-GGACTAACATCACTGAAGA-3)3 using Amaxa™ Nucleofector™ Technology (Lonza, Iowa City, IA, USA), following the manufacturer’s instructions. siGENOME siRNA smartpool targeting HoxA5, HoxA7 and HoxA9 (Dharmacon) were transfected into NIH3T3 cells (RNAimax, Invitrogen) as well as Control and Bcor Mutant cells (Amaxa Kit V, T-016 programe), following the manufacturer’s instructions.
Retroviral constructs and transduction
Retroviral supernatants were produced by transfecting Platinum-E (Plat-E) cells with the retroviral constructs Cre-IRES-puro or Puro empty vector controls using Lipofectamine 2000 (Invitrogen) following the manufacturer’s instructions. At 24 and 48 hours post transfection, the virus supernatants were collected and put through a 0.45 μm filter. Virus were loaded by centrifugation (2,000g, 90 min at 32 °C) twice on 50 μg/ml RetroNectin- (Takara, Iowa City, IA, USA) coated non-tissue culture six-well plates. Two to three million cells were transduced per well by centrifugation at 500g for 30 min and maintained for 48 h at 37 °C with 5% CO2 before transferring into culture flasks. Transduced cells were selected with puromycin (3 μg/ml for 3 days).
Western blot and histone extraction
Cell lysate was separated on SDS-PAGE gel (Bio-Rad, Hercules, CA, USA) and transferred to nitrocellulose membranes. After incubation with appropriate primary and secondary antibodies, the immunoblots were developed using SuperSignal Western blotting kits (Pierce Biotechnology, Hercules, CA, USA) and exposed to X-ray film. The following antibodies were used: BCOR,16 RING1B (Cell Signaling Technology, Danvers, MA, USA, D22F2), ubiquitin H2AK119 (Millipore, Temecula, CA, USA 05-678), H2A (Cell Signaling Technology, #2578) and β-actin (Sigma, St. Louis, MO, USA A5316). Endogenous ubH2A analysis was carried out following methods exactly as previously described.26
Chromation immunoprecipitation
Assays were performed using MAGnify™ Chromatin Immunoprecipitation System (Invitrogen) according to the manufacturer’s protocol. Briefly, cells were fixed by formaldehyde. For each ChIP reaction, 2× 10⁶ cells were used. All resulting precipitated DNA samples were quantified with Real-time PCR. Data were expressed as the percentage of input DNA. The primer sequences for Bcor and the ubiquitinated H2A-binding region of the HoxA5, HoxA7 and HoxA9 are indicated in Supplementary Table 1.
Reverse transcription reaction and quantitative PCR
Total RNA from cultured cells was extracted using RNeasy Mini Kit (Qiagen, St. Louis, MO, USA). Two hundred nanograms of RNA were processed directly to cDNA by reverse transcription with qScript cDNA SuperMix following the manufacturer’s instructions (Quanta, St. Louis, MO, USA). Sequences for primers used in this study are listed in the Supplementary Table 1. We used SYBR Premix Ex Taq (Perfect Real-time; Takara Bio) for qPCR according to the manufacturer’s instructions.
RNA microarray and data analysis
Total RNA from either mouse cells or AML patients’ mononuclear cells was isolated by RNeasy (Qiagen, St. Louis, MO, USA) purification, checked for quality using an Agilent Bioanalyser (Agilent Technologies). RNA from murine cells was hybridized on Illumina Mouse WG-6 beadchips. Raw expression data were obtained from the GenomeStudio software with the subtraction of the background. Prior to identification of differentially expressed genes, raw data were normalized based on the Cross-Correlation method.27 Significant changes in gene expression were identified based on the average fold change cutoff of 1.5, and the cutoff of the False Discovery Rate (FDR) -corrected p-value cross all replicates at 0.05.
Total RNA from human AML patient samples with either WT or mutant BCOR identified by whole-exome sequencing9 were hybridized on Affymetrix GeneChip HGU133 plus 2. The whole transcriptome gene-level expression data were obtained by using the Robust Multichip Average (RMA) method, which is publically available in the “affy” package of Bioconductor (https://www.bioconductor.org). Informed consent was obtained from all subjects and the study was approved by the ethics committee at Munich Leukemia Laboratory. All microarray data are available in the Gene Expression Omnibus (GEO, GSE69624).
For identification of enriched gene sets, Gene Set Enrichment Analysis (GSEA) was performed based on the normalized data and using GSEA v2.07 tool (http://www.broad.mit.edu/gsea/) with msigdb.v4.0.
Methylcellulose colony assay
BM cells were added to methylcellulose containing growth factors (Methocult 3434, containing IL-3, IL-6 and stem cell factor. Stem Cell Technology, Vancouver, Canada). The mixture was plated in triplicate cultures. Colonies were counted on days 6 and 12. For self-renewal experiments, the cells in the methylcellulose plate (mostly colonies) were diluted with PBS, counted and replated on fresh methylcellulose and colony formation was observed and counted. Replatings were performed on day 10 of soft-gel culture. All experiments were done in triplicate.
Statistical analyses
The Student’s t-test (Unpaired t-test) was used to analyze statistical significance and normality tests were used to test the assumption of a normal distribution. GraphPad Prism software (La Jolla, CA, USA) was used for statistical calculations. Error was calculated using SD unless otherwise noted; *P < 0.05, **P < 0.01.
RESULTS
BCOR regulates myeloid cell proliferation
To determine the role of BCOR in myeloid cell proliferation and differentiation, we used both loss-of-function and over expression approaches. First, we took advantage of a mouse conditional Bcor allele, BcorFl (Hamline, Corcoran, Wamstad et al., in prep. and see Methods for a brief description). We isolated bone marrow (BM) cells from BcorFl/Y animals and cultured these cells under myeloid stem/progenitor conditions [stem cell factor (SCF), IL-3 and IL-6]. These BcorFl/Y BM cells were transduced with either a control empty retrovirus (hereafter “control cells”) or a retrovirus expressing CRE recombinase to induce deletion of the floxed Bcor exons and generate the mutant allele (Bcor−/Y, hereafter “Bcor mutant cells”). This mutant allele in which exons 9 and 10 are missing generates a mRNA with a premature stop codon. The resulting truncated protein is missing the region required for interaction with the core PRC1 components16,28 and mimics the pathogenic mutations seen in OFCD patients.13 Transduced cells were selected with 3 μg/ml puromycin for 3 days and subjected to further analysis. PCR confirmed DNA deletion and Western blot showed the expression of the truncated BCOR (Figure 1a). In liquid culture, the Bcor mutant cells demonstrated higher proliferation rates than the control cells (Figure 1b). Further, a serial methycellulose replating colony assay demonstrated enhanced plating and serial replating capacity of the Bcor mutant cells compared with control cells (Figure 1c).
Figure 1.

BCOR regulates myeloid cell proliferation. (a–c) BcorFl/Y BM cells cultured with SCF, IL-3 and IL-6 were transduced with either empty vector control or Cre expressing retrovirus to generate BcorFl/Y control (Con) and Bcor−/Y mutant (Mut) cells. Transduced cells were selected with 3 μg/ml puromycin for 3 days and then were subjected to studies. (a) Cre mediated deletion of Bcor exons 9 and 10 was confirmed by qRT-PCR with primers internal to the deletion (upper panel) and loss of full length BCOR with appearance of a truncated protein by Western blot (arrow, wild type BCOR; arrowhead, mut BCOR; lower panel). (b) Cell proliferation from Days 0 to 10 in liquid culture. Data are means ± SD of triplicate experiments. (c) Methylcellulose colony replating assays (see Methods). (d) Rosa26LsLmBcorA BM stem/progenitor cells were transduced with empty (EV) or Cre expressing lentivirus to generate the Bcor overexpression allele Rosa26mBcorA. Left panel: Bcor overexpression was confirmed by Western blot and qPCR; Right panel: methylcellulose colony assays. Data are means ± SD of triplicate experiments. * P < 0.05, ** P < 0.01 (two-tailed, Unpaired t test).
To determine the effect of BCOR overexpression on myeloid cell growth, we used a different conditional allele (Rosa26LsLmBcorA) in which Bcor overexpression can be induced by Cre excision of the loxP-flanked Stop-cassette (LsL) (Hamline, Corcoran, Wamstad et al., in prep. and see methods for a brief description). BM cells from homozygous Rosa26LsLmBcorA/Rosa26LsLmBcorA mice were cultured under myeloid stem/progenitor conditions and infected with either a control or Cre expression retrovirus to induce Bcor overexpression (Figure 1d, left panel). Transduced cells were selected with 3 μg/ml puromycin for 3 days and subjected to further analysis. The Bcor overexpressing cells exhibited a profound decreased proliferative rate as measured in the methycellulose colony assay (Figure 1d). Together, these results suggest that BCOR negatively regulates cell proliferation.
BCOR helps control myeloid cell differentiation
To identify BCOR-regulated genes in myeloid cells, we used microarrays to compare global gene expression in control and Bcor mutant BM cells cultured for 7 days under myeloid stem/progenitor conditions. Over 1,200 genes were misregulated by greater than 2-fold (p<0.05, Figure 2a). Bcor mutant cells showed a disproportionate upregulation of genes involved in myeloid cell differentiation (12 out of the top 20 upregulated genes, Figure 2a). Gene set enrichment analysis (GSEA) revealed the significantly enriched expression of genes involved in myeloid cell differentiation29 (Figure 2b) and the target genes of CCAAT/enhancer binding proteins (C/EBPs)30 (Figure 2c) in Bcor mutant cells. Confirmation of the microarray results used quantitative real-time PCR (qRT-PCR) on selected genes (Figure 2d). These changes in gene expression suggest that Bcor mutant cells have a propensity to differentiate. In agreement, FACS analysis showed that 16% of the Bcor mutant cells expressed cell surface proteins related to myeloid differentiation (CD11b and/or Gr-1 positive) compared to the control population (5%) (Figure 2e, left). Statistic analysis of FACS analysis in 3 batches of control or Bcor mutant myeloid cells showed Bcor mutation significantly stimulates myeloid cell differentiation (Figure 2e, right). Bcor mutant cells also formed more granulocyte (Figure 2f, left panel) and monocyte (right panel) colonies in methylcellulose in the presence of granulocyte colony stimulating factor (GCSF) and monocyte colony stimulating factor (MCSF), respectively. In vivo, deletion of Bcor within the hematepoietic cells using Vav-iCre,31 led to an increase in peripheral blood neutrophils (Figure 2g), but no significant changes occurred in RBC, platelet and lymphocyte levels in these mice (Supplementary, Figure 1).
Figure 2.

Bcor deletion in BM cells induces myeloid cell differentiation. (a) Heat map of genes with > 2 fold and P < 0.05 mRNA expression differences between BcorFl/Y (Con) and Bcor−/Y (Mut) myeloid cells cultured with IL-3, IL-6 and SCF. 850 genes were upregulated and 400 genes downregulated. The top 20 upregulated and the 10 most downregulated genes are named. * genes associated with mature myeloid development. (b, c) GSEA comparison of control and Bcor mutant myeloid cells for enrichment/depletion of genes up-regulated in myeloid cell differentiation (b) and CEBP’s target genes (c). The normalized enrichment scores (NES) and P values are indicated in each plot. (d) qRT-PCR analysis of the indicated genes. Relative mRNA amounts were normalized to Gapdh. Values are expressed as fold variation relative to control cells (Con); results are mean ± SD of three experiments. Bcor primers are primers internal to the deletion. (e) Representative FACS analysis of Gr-1 and CD11b in control and Bcor mutant cells cultured under myeloid stem/progenitor conditions (IL-3, IL-6 and SCF) is shown (left). Statistical analysis for Gr-1/CD11b FACS analysis of three different batches of cells is shown (right). (f) Methycellulose colony assays for control and Bcor mutant cells with either GCSF (50 ng/ml) or MCSF (10 ng/ml). Colonies were counted on day 10 of culture. Values are expressed as colony numbers with means ± SD of three experiments. (g) BcorFl/Fl mice were crossed with Vav-iCre to delete Bcor in the hematopoietic lineages. Analysis of peripheral blood (HemaVet, Drew Scientific, Miami Lakes, FL, USA) of aged mice (~6–18 months) showed higher neutrophil levels in BcorFl/Fl;Vav-iCre compared to BcorFl/Fl littermate controls. *P < 0.05; ** P < 0.01 (two-tailed, Unpaired t test).
BCOR is a repressor of HoxA genes in myeloid cells
PcG proteins are known repressors of Hox genes; and a recent study showed that polycomb group ring finger 1 (Pcgf1),32 a member of the BCOR/BCORL1 complex, was involved in Hox gene expression regulation. We hypothesized that BCOR may alter expression of Hox, and other PcG targets. Hox genes were highly enriched in Bcor mutant myeloid cells among the differentially expressed genes (Figure 2a) compared to control cells. We performed hierarchical cluster analysis of Hox genes present in differentially expressed gene sets and showed HoxA5, HoxA7, HoxA9 and HoxB4 have the greatest fold changes in Bcor mutant cells (Figure 3a). qRT-PCR confirmed that the expression level of HoxA5, HoxA7, HoxA9 and HoxB4 were up-regulated in Bcor mutant cells (Figure 3b), while Bcor overexpressing cells had lower levels of the same set of Hox genes (Figure 3c). GSEA among the differentially expressed genes (Figure 2a) in control and Bcor mutant myeloid cells revealed that the expression of HoxA9 targets,33,34 proliferation-associated genes35 and MYC target genes36 were significantly enriched in cells with Bcor mutation (Figure 3d). To demonstrate the significance of Hox genes as target of BCOR, we knocked down HoxA5, HoxA7 and HoxA9 in control and Bcor mutant myeloid cells (Figure 3e) and examined cell proliferation by methylcellulose colony assay. As shown in Figure 3f, knocking down of HoxA5, HoxA7 and HoxA9 significantly decreased the clonal growth rate of Bcor mutant cells.
Figure 3.

BCOR regulates HoxA cluster genes and silencing HoxA genes inhibits proliferation of Bcor mutant cells. (a) Hierarchical cluster analysis of Hox gene expression in BcorFl/Y (Con) and Bcor−/Y (Mut) myeloid cells revealed the up-regulation of several Hox genes with mutation of Bcor. (b, c) qRT-PCR analysis of the indicated Hox genes in either control or Bcor mutant cells (b) and in Rosa26LsLmBcorA BM cells transduced with empty vector (EV) or Cre (producing Bcor overexpression) (c). Values are expressed as fold variation relative to control cells which was set to 100; results are mean ± SD of three experiments. *P < 0.05; ** P < 0.01 (two-tailed, Unpaired t test). (d) GSEA comparison of control and Bcor mutant myeloid cells for enrichment/depletion of indicated gene sets. The NES and P values are indicated in each plot. (e) HoxA5, 7 and 9 were knocked down by siRNA in NIH3T3 (gray bars), BcorFl/Y (Con) and Bcor−/Y (Mut) myeloid cells. Expression of HoxA5, 7 and 9 was checked by qPCR after siRNA transfection. Data are means ± SD of triplicate experiments. (f) Methylcellulose colony assays for control and Bcor mutant myeloid cells either with or without Hox gene silencing. Colonies were counted on day 7 of culture. Values are expressed as colony numbers with means ± SD of three experiments. * P < 0.05, ** P < 0.01 (two-tailed, Unpaired t test).
BCOR affects RING1B protein levels and H2A ubiquitylation at HoxA loci
BCOR is reported to associate with RING1B to form the PRC1.1 complex.16,17 Western blot showed that RING1B protein levels are much lower in Bcor mutant myeloid cells and in myeloid differentiated cells, compared to control cells, respectively (Figures 4a and b). In contrast, the level of Ring1b mRNA was unchanged (Figure 4c). Therefore, BCOR protein abundance is correlated with RINGB1 protein abundance. This suggests that loss of BCOR protein, via either differentiation of wild type cells or by genetic ablation in the progenitor population, can lead to a decrease in the RING1B protein abundance. Global levels of H2AK119ub were unchanged in the Bcor mutant cells (Figure 4e). However, ChIP-qPCR revealed that H2AK119ub levels at the promoters of HoxA5, HoxA7 and HoxA9 were significantly decreased in Bcor mutant cells (Figure 4f).
Figure 4.

Bcor mutation decreases RING1B levels and H2Ak119ub at HoxA promoters. (a, e and f) BcorFl/Y BM cells cultured with SCF, IL-3 and IL-6 were transduced with control or Cre expressing retrovirus to generate Con and Mut cells. Transduced cells were selected with 3 μg/ml puromycin for 3 days prior to studies. (a) Bcor deletion leads to decrease in RING1B protein levels. Western blot analysis of BCOR and RING1B in three pairs of control and Bcor mutant cells is shown (upper). Western blot was quantified by ImageJ software and relative full length BCOR and RING1B protein expression in each sample is shown (bottom). (b) BCOR and RING1B proteins are downregulated in BM cells with myeloid cell differentiation. BM cells from two WT mice (#1 and #2) were treated with 50 ng/ml GCSF for 3 days to induce myeloid cell differentiation. BCOR and RING1B were examined by Western blot (upper). Quantification of Western blot is shown (bottom). (c) qPCR demonstrates no changes in the Ring1b mRNA level with BM cell differentiation induced by GCSF treatment. (d) BM cell differentiation induced by GCSF was confirmed by FACS using Gr-1 antibody. (e) Western blot analysis showing no change in global H2AK119 ubiquitination levels in Bcor mutant cells. β-actin or H2A was used as loading control for Western blot analysis. (f) Single-locus ChIP analysis using BCOR and H2AK119ub antibodies showing reduced H2A ubiquitination levels at the promoters of HoxA5, HoxA7 and HoxA9 in Bcor mutant cells. Results represent the mean ± three experiments. Data are means ± SD of triplicate experiments. * P < 0.05, ** P < 0.01 (two-tailed, Unpaired t test).
Silencing BCOR induces myeloid cell differentiation of HL60 and NB4 cells
To address further the role of BCOR in myeloid cell differentiation, we investigated if silencing BCOR (by siRNA) will affect cell differentiation in the human acute promyeloid leukemia cell lines, HL60 and NB4.37,38 BCOR knockdown was confirmed by qRT-PCR (Figure 5a, left) and Western blot (Figure 5a, right). Silencing of BCOR resulted in a dramatic increase in myeloid differentiation of HL60 and NB4 cells as measured by expression of CD11b (Figure 5b). All-trans retinoic acid (ATRA) was used as a positive control for inducing differentiation (Figure 5b). Since our results suggested that BCOR is implicated in suppressing myeloid cell differentiation, we compared its expression level in HL60 and NB4 cells induced to differentiate by ATRA and BM cells treated with or without GCSF, and found that BCOR RNA and protein levels were dramatically decreased upon cell differentiation (Figure 5c). In agreement with our finding that BCOR decreases during myeloid differentiation, in silico analysis of normal human hematopoietic cells (Gene Enrichment Profiler, HemaExplorer)39,40 showed that BCOR levels are very high in long-term hematopoietic stem cells (LT-HSC) and its levels decrease with myeloid differentiation towards monocytes and granulocytes (nearly no expression).
Figure 5.
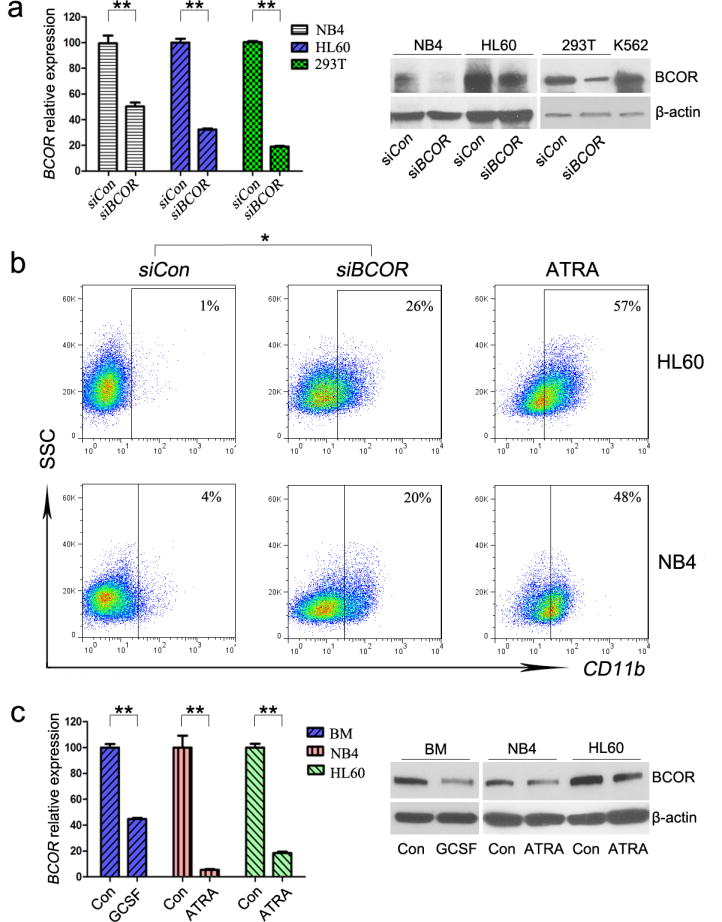
Silencing BCOR induces differentiation of HL60 and NB4 human myeloid leukemia cells. (a) Knockdown of BCOR by siBCOR confirmed by qRT-PCR (left) and Western blot (right) in NB4, HL60, and 293T cells. In qPCR, BCOR expression in cells transfected with siRNA against BCOR (siBCOR) was normalized to control (siCon) which was set to 100; results are mean ± SD of three experiments. (b) FACS of CD11b antibody 5 days after either siCon or siBCOR was transfected into HL60 and NB4 cells. ATRA (10−7 M, 5 days) treated HL60 and NB4 cells were used as positive controls for cell differentiation. (c) BCOR expression was compared by qRT-PCR (left) and Western blot (right) in BM, NB4 and HL60 cells that were either untreated (con) or induced to differentiate by incubation with 50 μg/ml GCSF for 3 days (BM) or 10−7 M ATRA for 5 days (NB4 and HL60). * P < 0.05, ** P < 0.01 (two-tailed, Unpaired t test).
Gene expression changes in Bcor mutant CD34+ cells are consistent with increased proliferation
To investigate further the role of BCOR in early hematopoietic cells, we performed global gene expression profiling of CD34+ cells from control and Bcor mutant cells. A total of 130 genes were misregulated by greater than 2-fold (p < 0.05) (Figure 6a). Congruent with our proliferation and colony assay results (Figure 1), GSEA revealed that the expression of proliferation-associated genes41 and MYC up-regulated genes36 were significantly enriched in Bcor mutant CD34+ cells (Figure 6b).
Figure 6.

Gene expression changes in Bcor mutant CD34+ cells are consistent with increased proliferation. CD34+ control and CD34+ Bcor mutant murine cells were purified by sorting using flow cytometry. Gene expression analysis (Illumina MouseWG-6 beadchips) was performed in triplicate. (a) Heat map of genes with > 2 fold mRNA (P < 0.05) expression differences between CD34+ control and CD34+ Bcor mutant cells. 160 genes were upregulated and 70 genes were downregulated. Top 15 upregulated and 9 downregulated genes are named. (b) GSEA comparison of Bcor mutant and control cells for either enrichment or depletion of indicated enrichment gene sets. The NES and P value are indicated on each plot.
Comparison of RNA expression in AML and MDS patients samples either with or without BCOR mutations
Next, we investigated whether the results from our murine model are relevant to human MDS/AML with BCOR mutations. BCOR mutations occur in about 4% of chromosome normal (CN)-AML.9 We compared global gene expression in de novo CN-AML male samples which were negative for NPM1, CEBPA, FLT3-ITD and MLL-PTD mutations and contained either WT BCOR or nonsense mutant BCOR (6 samples, Figures 7a–c and Supplementary Table 2). GSEA revealed that the expression of genes associated with myeloid cell differentiation29 were significantly enriched in BCOR mutant samples, compared with control BCOR WT samples (Figure 7a). On the other hand, genes associated with hematopoietic stem cells (HSC)42 were depressed in the BCOR mutant samples (Figure 7b). Genes upregulated in the BCOR mutant samples also showed significant enrichment with genes upregulated upon loss of BMI143, a component of the PRC1.4 complex suggesting some functional overlap between PRC1.1 and PRC1.4 in AML (Figure 7c). We collected 73 MDS patients BM samples having a normal karyotype either with or without a BCOR mutation (Supplementary Table 3). qRT-PCR analysis in those samples revealed that expression of HOXA9 was upregulated significantly in MDS patients with BCOR loss of function mutations (Figure 7d). In addition, we analyzed global gene expression in GEO datasets of 12 BCOR wild-type CN-AML cases and 12 BCOR mutated CN-AML cases (GSE30442).9 Similar to our analysis of control and Bcor mutant murine myeloid cells (Figure 6) and our patient samples (Figure 7), GSEA of this dataset demonstrated that BCOR mutant samples were enriched for proliferation-associated genes and MYC target genes (Supplementary Figure 2). These findings strongly suggest that BCOR functions as a tumor suppressor in myeloid cells at least in part by affecting proliferation and self-renewal.
Figure 7.

BCOR loss of function mutations are associated with enhanced myeloid cell differentiation and dysfunction of PRC1 in MDS and AML cells of patients. (a–c) BM cells were collected from 6 male AML patients with WT BCOR (WT) and 6 male AML patients with BCOR nonsense mutation (Mut). Gene expression analysis (Affymatrix microarray) was performed, and GSEA comparison were made of Mut and WT cells for enrichment (left panels) or depletion (right panels) of up-regulated and down-regulated genes associated with myeloid cell differentiation (a), HSC (b), and PRC1 targets (c). The NES and P values are indicated in each plot. (d) qRT-PCR results for HOXA9 expression from a total 73 MDS patients with normal karyotyping. BM cells were collected from 12 males with mutant BCOR (11 of which had destructive mutations), 26 males with wild type BCOR, 11 females with mutant BCOR (7 of which had destructive mutations) and 24 females with wild type BCOR. Extracted RNA samples were subjected to qRT-PCR analysis. Each dot represents one sample and data represent mean ± SD with P values (two-tailed, Unpaired t test) indicated.
DISCUSSION
Mammalian hematopoiesis is a hierarchical process giving rise to all types of mature blood cells. Proliferation and differentiation are controlled by an interactive network of transcription factors and epigenetic regulators. The very earliest HSCs are fairly quiescent. More mature stem cells and committed progenitor cells have higher proliferation rates. Although numerous factors involved in blood cell development have been identified, our knowledge of the process remains incomplete. In the present report, we discovered a previously unknown role of BCOR in hematopoiesis. Our results strongly suggest that BCOR plays an important role in normal hematopoiesis by contributing to the regulation of myeloid cell proliferation and differentiation. Global microarray and qRT-PCR uncovered expression of numerous genes that were altered in the Bcor mutant cells, several of which are implicated in myeloid differentiation (e.g. Cebpa and Cebpe). Importantly, our results showed that BCOR is a repressor of HoxA cluster of genes (HoxA5, HoxA7 and HoxA9) in myeloid cells (Figures 3b and c, Figure 4f). Knock-down of HoxA5, HoxA7 and HoxA9 significantly decreased the clonogenic growth of Bcor mutant and wild type cells (Figures 3e and f), demonstrating the Hox genes, as targets of BCOR, played an important role in mediating BCOR’s function in regulating myeloid cell proliferation. Similarly, a recent study demonstrated that knock-down of Pcgf1, another PRC1.1 complex component, in Lin- HSC also upregulated the expression of Hox genes and enhanced hematopoietic cell proliferation.32 Furthermore, overexpression of HoxA4, HoxA9, and HoxA10 in Lin- HSC cells increased their plating capacity in methylcellulose.44 In vivo, overexpression of HoxA9 and HoxA10 increased the pool of HSCs and myeloid progenitor cells and leads to late onset leukemia.45,46 These finding demonstrate the important role of Hox genes in self-renewal of hematopoietic cells. Thus, up-regulation of HoxA genes upon Bcor loss, is likely responsible at least in part, for the extended clonogenic growth of Bcor mutant hematopoietic stem/progenitor cell (HSPC) in replating assays.
BCOR is a component of the PRC1.1 transcriptional repressive complex which also includes RING1A/B, YAF2/RYBP, PCGF1, and KDM2B.16,17 RING1B is the E3 ubiquitin ligase that functions as the catalytic core of PRC1 complexes and is responsible for monoubiquitylation of H2A at position 119 (H2AK119ub).23,24 H2A ubiquitination activity of the PRC1 complex is a crucial step to mediate PRC1-dependent repression of differentiation-related genes to maintain ES cell identity.47 Since PcG proteins are known repressors of Hox genes, we hypothesized that loss of BCOR may disrupt the activity of the PRC1.1 complex and lead to upregulation of a subset of genes known to be repressed by PRC1 complex containing RING1B. Results showed that mutation of Bcor in murine myeloid cells was associated with a decrease in RING1B protein levels, while Ring1b mRNA levels remained unchanged. Western blot analysis showed that the global monoubiquitin level of H2AK119 was unchanged in the Bcor mutant cells. However, ChIP-qPCR revealed that H2AK119ub levels at the promoters of HoxA5, HoxA7 and HoxA9 were significantly decreased in Bcor mutant cells. These results offer a mechanistic explanation for how BCOR regulates gene expression in myeloid cells, wherein loss of BCOR is associated with the loss of ubH2A at specific promoters without altering global ubH2A levels. Up-regulation of HOXA9 gene was also detected in MDS patient samples with BCOR loss of function mutations (Figure 7d).
MDS is a heterogeneous group of clonal BM disorders that predominate in the elderly. Often at the time of diagnosis, clonal expansion has replaced the normal hematopoietic cells. Unlike AML, MDS cells retain their ability to differentiate to mature myeloid blood cells, albeit often with various abnormalties.48,49 Thus, while the clonal population of MDS cells continues to expand in the BM, patients paradoxically experience variable cytopenias due to excessive cell death.50 Loss of BCOR facilitates this phenotype by allowing an expanded marrow of hematopoietic cells at all stages of differentiation. Truncating mutations of BCOR are independently associated with a worse overall survival (OS) in MDS and a higher cumulative incidence of AML transformation.10 MDS can progress to AML which has a nearly complete block of differentiation. MDS cells with BCOR loss of function likely acquire additional mutations resulting in a block in differentiation. Interestingly in MDS and AML, BCOR mutations associate preferentially with a group of molecular aberrations including RUNX1 and DNMT3A mutations.9,10 However, the exact role of BCOR in leukemia transformation awaits further studies.
In summary, our data suggest that BCOR plays an important role in normal hematopoiesis by contributing to the regulation of myeloid cell proliferation and differentiation. With loss of Bcor enhanced proliferation of more mature progenitor cells occurs allowing increased production of mature myeloid cells. Functionally, BCOR appears to play a critical role in determining H2A ubiquitination levels and PcG proteins recruitment to promoters of lineage-specific genes to repress their expression. We hypothesize that loss of BCOR provides both a clonal growth advantage of the MDS clone, which when combined with additional mutations, can result in neoplastic transformation.
Supplementary Material
Acknowledgments
We thank Dimitris Kioussis for sharing the Vav-iCre allele. This work was funded by the National Institutes of Health, USA (NIH; Grant No. R01CA026038-35 (HPK) and 5R01CA071540 (VJB)), the Singapore Ministry of Health’s National Medical Research Council (NMRC) under its Singapore Translational Research (STaR) Investigator Award to H. Phillip Koeffler and the NMRC Centre Grant awarded to National University Cancer Institute of Singapore, the National Research Foundation Singapore and the Singapore Ministry of Education under its Research Centres of Excellence initiatives. Further thanks is given to Reuben Yeroushalmi, Blanche and Steven Koegler. Additional funding came from the Minnesota Masonic Charities, the University of Minnesota OVPR and the Leukemia Research Fund (VJB).
Footnotes
CONFLICT OF INTEREST
The authors declare no competing financial interests.
Contributor Information
Qi Cao, Email: Qi.Cao@cshs.org.
Vivian J. Bardwell, Email: bardw001@umn.edu.
References
- 1.Huynh KD, Fischle W, Verdin E, Bardwell VJ. BCoR, a novel corepressor involved in BCL-6 repression. Genes Dev. 2000;14:1810–1823. [PMC free article] [PubMed] [Google Scholar]
- 2.Cattoretti G, Pasqualucci L, Ballon G, Tam W, Nandula SV, Shen Q, et al. Deregulated BCL6 expression recapitulates the pathogenesis of human diffuse large B cell lymphomas in mice. Cancer Cell. 2005;7:445–455. doi: 10.1016/j.ccr.2005.03.037. [DOI] [PubMed] [Google Scholar]
- 3.Hatzi K, Jiang Y, Huang C, Garrett-Bakelman F, Gearhart MD, Giannopoulou EG, et al. A hybrid mechanism of action for BCL6 in B cells defined by formation of functionally distinct complexes at enhancers and promoters. Cell Rep. 2013;4:578–588. doi: 10.1016/j.celrep.2013.06.016. [DOI] [PMC free article] [PubMed] [Google Scholar]
- 4.Zhang J, Benavente CA, McEvoy J, Flores-Otero J, Ding L, Chen X, et al. A novel retinoblastoma therapy from genomic and epigenetic analyses. Nature. 2012;481:329–334. doi: 10.1038/nature10733. [DOI] [PMC free article] [PubMed] [Google Scholar]
- 5.Pugh TJ, Weeraratne SD, Archer TC, Pomeranz Krummel DA, Auclair D, Bochicchio J, et al. Medulloblastoma exome sequencing uncovers subtype-specific somatic mutations. Nature. 2012;488:106–110. doi: 10.1038/nature11329. [DOI] [PMC free article] [PubMed] [Google Scholar]
- 6.Pierron G, Tirode F, Lucchesi C, Reynaud S, Ballet S, Cohen-Gogo S, et al. A new subtype of bone sarcoma defined by BCOR-CCNB3 gene fusion. Nat Genet. 2012;44:461–466. doi: 10.1038/ng.1107. [DOI] [PubMed] [Google Scholar]
- 7.Totoki Y, Tatsuno K, Yamamoto S, Arai Y, Hosoda F, Ishikawa S, et al. High-resolution characterization of a hepatocellular carcinoma genome. Nat Genet. 2011;43:464–469. doi: 10.1038/ng.804. [DOI] [PubMed] [Google Scholar]
- 8.Yamamoto Y, Abe A, Emi N. Clarifying the impact of polycomb complex component disruption in human cancers. Mol Cancer Res. 2014;12:479–484. doi: 10.1158/1541-7786.MCR-13-0596. [DOI] [PubMed] [Google Scholar]
- 9.Grossmann V, Tiacci E, Holmes AB, Kohlmann A, Martelli MP, Kern W, et al. Whole-exome sequencing identifies somatic mutations of BCOR in acute myeloid leukemia with normal karyotype. Blood. 2011;118:6153–6163. doi: 10.1182/blood-2011-07-365320. [DOI] [PubMed] [Google Scholar]
- 10.Damm F, Chesnais V, Nagata Y, Yoshida K, Scourzic L, Okuno Y, et al. BCOR and BCORL1 mutations in myelodysplastic syndromes and related disorders. Blood. 2013;122:3169–3177. doi: 10.1182/blood-2012-11-469619. [DOI] [PubMed] [Google Scholar]
- 11.Kulasekararaj AG, Jiang J, Smith AE, Mohamedali AM, Mian S, Gandhi S, et al. Somatic mutations identify a subgroup of aplastic anemia patients who progress to myelodysplastic syndrome. Blood. 2014;124:2698–2704. doi: 10.1182/blood-2014-05-574889. [DOI] [PMC free article] [PubMed] [Google Scholar]
- 12.Yoshizato T, Dumitriu B, Hosokawa K, Makishima H, Yoshida K, Townsley D, et al. Somatic Mutations and Clonal Hematopoiesis in Aplastic Anemia. N Engl J Med. 2015;373:35–47. doi: 10.1056/NEJMoa1414799. [DOI] [PMC free article] [PubMed] [Google Scholar]
- 13.Ng D, Thakker N, Corcoran CM, Donnai D, Perveen R, Schneider A, et al. Oculofaciocardiodental and Lenz microphthalmia syndromes result from distinct classes of mutations in BCOR. Nat Genet. 2004;36:411–416. doi: 10.1038/ng1321. [DOI] [PubMed] [Google Scholar]
- 14.Wamstad JA, Corcoran CM, Keating AM, Bardwell VJ. Role of the transcriptional corepressor Bcor in embryonic stem cell differentiation and early embryonic development. PLoS One. 2008;3:e2814. doi: 10.1371/journal.pone.0002814. [DOI] [PMC free article] [PubMed] [Google Scholar]
- 15.Sanchez C, Sanchez I, Demmers JA, Rodriguez P, Strouboulis J, Vidal M. Proteomics analysis of Ring1B/Rnf2 interactors identifies a novel complex with the Fbxl10/Jhdm1B histone demethylase and the Bcl6 interacting corepressor. Mol Cell Proteomics. 2007;6:820–834. doi: 10.1074/mcp.M600275-MCP200. [DOI] [PubMed] [Google Scholar]
- 16.Gearhart MD, Corcoran CM, Wamstad JA, Bardwell VJ. Polycomb group and SCF ubiquitin ligases are found in a novel BCOR complex that is recruited to BCL6 targets. Mol Cell Biol. 2006;26:6880–6889. doi: 10.1128/MCB.00630-06. [DOI] [PMC free article] [PubMed] [Google Scholar]
- 17.Gao Z, Zhang J, Bonasio R, Strino F, Sawai A, Parisi F, et al. PCGF homologs, CBX proteins, and RYBP define functionally distinct PRC1 family complexes. Mol Cell. 2012;45:344–356. doi: 10.1016/j.molcel.2012.01.002. [DOI] [PMC free article] [PubMed] [Google Scholar]
- 18.Lewis EB. A gene complex controlling segmentation in Drosophila. Nature. 1978;276:565–570. doi: 10.1038/276565a0. [DOI] [PubMed] [Google Scholar]
- 19.Jaenisch R, Young R. Stem cells, the molecular circuitry of pluripotency and nuclear reprogramming. Cell. 2008;132:567–582. doi: 10.1016/j.cell.2008.01.015. [DOI] [PMC free article] [PubMed] [Google Scholar]
- 20.Margueron R, Reinberg D. The Polycomb complex PRC2 and its mark in life. Nature. 2011;469:343–349. doi: 10.1038/nature09784. [DOI] [PMC free article] [PubMed] [Google Scholar]
- 21.Sparmann A, van Lohuizen M. Polycomb silencers control cell fate, development and cancer. Nat Rev Cancer. 2006;6:846–856. doi: 10.1038/nrc1991. [DOI] [PubMed] [Google Scholar]
- 22.Simon JA, Kingston RE. Occupying chromatin: Polycomb mechanisms for getting to genomic targets, stopping transcriptional traffic, and staying put. Mol Cell. 2013;49:808–824. doi: 10.1016/j.molcel.2013.02.013. [DOI] [PMC free article] [PubMed] [Google Scholar]
- 23.de Napoles M, Mermoud JE, Wakao R, Tang YA, Endoh M, Appanah R, et al. Polycomb group proteins Ring1A/B link ubiquitylation of histone H2A to heritable gene silencing and X inactivation. Dev Cell. 2004;7:663–676. doi: 10.1016/j.devcel.2004.10.005. [DOI] [PubMed] [Google Scholar]
- 24.Wang H, Wang L, Erdjument-Bromage H, Vidal M, Tempst P, Jones RS, et al. Role of histone H2A ubiquitination in Polycomb silencing. Nature. 2004;431:873–878. doi: 10.1038/nature02985. [DOI] [PubMed] [Google Scholar]
- 25.Simon JA, Kingston RE. Mechanisms of polycomb gene silencing: knowns and unknowns. Nat Rev Mol Cell Biol. 2009;10:697–708. doi: 10.1038/nrm2763. [DOI] [PubMed] [Google Scholar]
- 26.Cao R, Tsukada Y, Zhang Y. Role of Bmi-1 and Ring1A in H2A ubiquitylation and Hox gene silencing. Mol Cell. 2005;20:845–854. doi: 10.1016/j.molcel.2005.12.002. [DOI] [PubMed] [Google Scholar]
- 27.Chua SW, Vijayakumar P, Nissom PM, Yam CY, Wong VV, Yang H. A novel normalization method for effective removal of systematic variation in microarray data. Nucleic Acids Res. 2006;34:e38. doi: 10.1093/nar/gkl024. [DOI] [PMC free article] [PubMed] [Google Scholar]
- 28.Junco SE, Wang R, Gaipa JC, Taylor AB, Schirf V, Gearhart MD, et al. Structure of the polycomb group protein PCGF1 in complex with BCOR reveals basis for binding selectivity of PCGF homologs. Structure. 2013;21:665–671. doi: 10.1016/j.str.2013.02.013. [DOI] [PMC free article] [PubMed] [Google Scholar]
- 29.Brown AL, Wilkinson CR, Waterman SR, Kok CH, Salerno DG, Diakiw SM, et al. Genetic regulators of myelopoiesis and leukemic signaling identified by gene profiling and linear modeling. J Leukoc Biol. 2006;80:433–447. doi: 10.1189/jlb.0206112. [DOI] [PubMed] [Google Scholar]
- 30.Gery S, Gombart AF, Yi WS, Koeffler C, Hofmann WK, Koeffler HP. Transcription profiling of C/EBP targets identifies Per2 as a gene implicated in myeloid leukemia. Blood. 2005;106:2827–2836. doi: 10.1182/blood-2005-01-0358. [DOI] [PMC free article] [PubMed] [Google Scholar]
- 31.de Boer J, Williams A, Skavdis G, Harker N, Coles M, Tolaini M, et al. Transgenic mice with hematopoietic and lymphoid specific expression of Cre. Eur J Immunol. 2003;33:314–325. doi: 10.1002/immu.200310005. [DOI] [PubMed] [Google Scholar]
- 32.Ross K, Sedello AK, Todd GP, Paszkowski-Rogacz M, Bird AW, Ding L, et al. Polycomb group ring finger 1 cooperates with Runx1 in regulating differentiation and self-renewal of hematopoietic cells. Blood. 2012;119:4152–4161. doi: 10.1182/blood-2011-09-382390. [DOI] [PubMed] [Google Scholar]
- 33.Faber J, Krivtsov AV, Stubbs MC, Wright R, Davis TN, van den Heuvel-Eibrink M, et al. HOXA9 is required for survival in human MLL-rearranged acute leukemias. Blood. 2009;113:2375–2385. doi: 10.1182/blood-2007-09-113597. [DOI] [PMC free article] [PubMed] [Google Scholar]
- 34.Hess JL, Bittner CB, Zeisig DT, Bach C, Fuchs U, Borkhardt A, et al. c-Myb is an essential downstream target for homeobox-mediated transformation of hematopoietic cells. Blood. 2006;108:297–304. doi: 10.1182/blood-2005-12-5014. [DOI] [PMC free article] [PubMed] [Google Scholar]
- 35.Venezia TA, Merchant AA, Ramos CA, Whitehouse NL, Young AS, Shaw CA, et al. Molecular signatures of proliferation and quiescence in hematopoietic stem cells. PLoS Biol. 2004;2:e301. doi: 10.1371/journal.pbio.0020301. [DOI] [PMC free article] [PubMed] [Google Scholar]
- 36.Zeller KI, Jegga AG, Aronow BJ, O’Donnell KA, Dang CV. An integrated database of genes responsive to the Myc oncogenic transcription factor: identification of direct genomic targets. Genome Biol. 2003;4:R69. doi: 10.1186/gb-2003-4-10-r69. [DOI] [PMC free article] [PubMed] [Google Scholar]
- 37.Lanotte M, Martin-Thouvenin V, Najman S, Balerini P, Valensi F, Berger R. NB4, a maturation inducible cell line with t(15;17) marker isolated from a human acute promyelocytic leukemia (M3) Blood. 1991;77:1080–1086. [PubMed] [Google Scholar]
- 38.Gallagher R, Collins S, Trujillo J, McCredie K, Ahearn M, Tsai S, et al. Characterization of the continuous, differentiating myeloid cell line (HL-60) from a patient with acute promyelocytic leukemia. Blood. 1979;54:713–733. [PubMed] [Google Scholar]
- 39.Benita Y, Cao Z, Giallourakis C, Li C, Gardet A, Xavier RJ. Gene enrichment profiles reveal T-cell development, differentiation, and lineage-specific transcription factors including ZBTB25 as a novel NF-AT repressor. Blood. 2010;115:5376–5384. doi: 10.1182/blood-2010-01-263855. [DOI] [PMC free article] [PubMed] [Google Scholar]
- 40.Bagger FO, Rapin N, Theilgaard-Monch K, Kaczkowski B, Thoren LA, Jendholm J, et al. HemaExplorer: a database of mRNA expression profiles in normal and malignant haematopoiesis. Nucleic Acids Res. 2013;41:D1034–1039. doi: 10.1093/nar/gks1021. [DOI] [PMC free article] [PubMed] [Google Scholar]
- 41.Ben-Porath I, Thomson MW, Carey VJ, Ge R, Bell GW, Regev A, et al. An embryonic stem cell-like gene expression signature in poorly differentiated aggressive human tumors. Nat Genet. 2008;40:499–507. doi: 10.1038/ng.127. [DOI] [PMC free article] [PubMed] [Google Scholar]
- 42.Jaatinen T, Hemmoranta H, Hautaniemi S, Niemi J, Nicorici D, Laine J, et al. Global gene expression profile of human cord blood-derived CD133+ cells. Stem Cells. 2006;24:631–641. doi: 10.1634/stemcells.2005-0185. [DOI] [PubMed] [Google Scholar]
- 43.Douglas D, Hsu JH, Hung L, Cooper A, Abdueva D, van Doorninck J, et al. BMI-1 promotes ewing sarcoma tumorigenicity independent of CDKN2A repression. Cancer Res. 2008;68:6507–6515. doi: 10.1158/0008-5472.CAN-07-6152. [DOI] [PMC free article] [PubMed] [Google Scholar]
- 44.Bach C, Buhl S, Mueller D, Garcia-Cuellar MP, Maethner E, Slany RK. Leukemogenic transformation by HOXA cluster genes. Blood. 2010;115:2910–2918. doi: 10.1182/blood-2009-04-216606. [DOI] [PubMed] [Google Scholar]
- 45.Thorsteinsdottir U, Mamo A, Kroon E, Jerome L, Bijl J, Lawrence HJ, et al. Overexpression of the myeloid leukemia-associated Hoxa9 gene in bone marrow cells induces stem cell expansion. Blood. 2002;99:121–129. doi: 10.1182/blood.v99.1.121. [DOI] [PubMed] [Google Scholar]
- 46.Thorsteinsdottir U, Sauvageau G, Hough MR, Dragowska W, Lansdorp PM, Lawrence HJ, et al. Overexpression of HOXA10 in murine hematopoietic cells perturbs both myeloid and lymphoid differentiation and leads to acute myeloid leukemia. Mol Cell Biol. 1997;17:495–505. doi: 10.1128/mcb.17.1.495. [DOI] [PMC free article] [PubMed] [Google Scholar]
- 47.Endoh M, Endo TA, Endoh T, Isono K, Sharif J, Ohara O, et al. Histone H2A mono-ubiquitination is a crucial step to mediate PRC1-dependent repression of developmental genes to maintain ES cell identity. PLoS Genet. 2012;8:e1002774. doi: 10.1371/journal.pgen.1002774. [DOI] [PMC free article] [PubMed] [Google Scholar]
- 48.Anastasi J, Feng J, Le Beau MM, Larson RA, Rowley JD, Vardiman JW. Cytogenetic clonality in myelodysplastic syndromes studied with fluorescence in situ hybridization: lineage, response to growth factor therapy, and clone expansion. Blood. 1993;81:1580–1585. [PubMed] [Google Scholar]
- 49.Raza A, Gezer S, Mundle S, Gao XZ, Alvi S, Borok R, et al. Apoptosis in bone marrow biopsy samples involving stromal and hematopoietic cells in 50 patients with myelodysplastic syndromes. Blood. 1995;86:268–276. [PubMed] [Google Scholar]
- 50.Raza A, Galili N. The genetic basis of phenotypic heterogeneity in myelodysplastic syndromes. Nat Rev Cancer. 2012;12:849–859. doi: 10.1038/nrc3321. [DOI] [PubMed] [Google Scholar]
Associated Data
This section collects any data citations, data availability statements, or supplementary materials included in this article.