

Summary
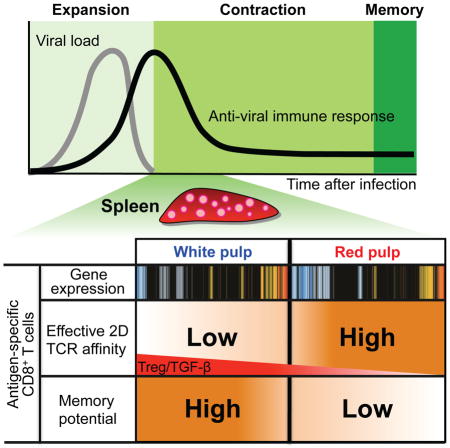
T cells rapidly undergo contraction upon viral clearance, but how T cell function and fate are determined during this phase is unclear. During the contraction phase of an acute infection with lymphocytic choriomeningitis virus, we found that virus-specific CD8+ T cells within the splenic red pulp (RP) had higher two-dimensional (2D) effective affinity than those within the white pulp (WP). This increased antigen recognition of RP-derived CD8+ T cells correlated with more efficient target cell killing and improved control of viremia. FoxP3+ regulatory T cells and cytokine TGF-β limited the 2D-affinity in the WP during the contraction phase. Anatomical location drove gene expression patterns in CD8+ T cells that led to preferential differentiation of memory precursor WP T cells into long-term memory cells. These results highlight that intricate regulation of T cell function and fate is determined by anatomic compartmentalization during the early immune contraction phase.
Graphical abstract
Introduction
Upon infection, naïve CD8+ T cells proliferate and expand; this process is antigen-specific and dependent on help from panoply of co-stimulatory and inflammatory cytokines. If the pathogen is cleared, the majority of these cells will die by apoptosis during the contraction phase. A small portion of these effector cells differentiate to memory T cells where they can be poised to respond to a recall antigen quicker and with more vigor than during the primary response. Effector and memory precursor T cells can be further subdivided based on expression of specific markers such as CD127 and KLRG1. Short-lived effector cells are KLRG1highCD127low while memory precursor cells are KLRG1lowCD127high (Joshi et al., 2007; Kaech et al., 2003). Memory precursors are potentially derived from a total pool of effector cells and it can take several weeks to differentiate into fully functional memory cells with the ability to proliferate upon secondary encounter with antigen. A multitude of transcription and gene regulatory factors such as T-bet, Blimp-1, EOMES, and BCL-6 are invoked during this transition (Kaech and Cui, 2012). Even T cells bearing genetically identical T cell receptors (TCRs) display heterogeneous clonal expansion and differentiation patterns (Gerlach et al., 2013) despite the inability to increase their TCR affinity by somatic hypermutation. This suggests that functionality and fate of T cells may be influenced by extrinsic signals such as communication with other cells and cytokines in their respective anatomic locations over time.
The TCR recognizes antigen in the context of a major histocompatibility (MHC) molecule, which is critical for determining T cell fate during thymic development as well as peripheral activation and differentiation (Anderson and Jenkinson, 2001; Manning and Kranz, 1999; Starr et al., 2003). TCR–peptide (p)MHC binding bridges the junctional gap between a T cell and an antigen-presenting cell, hence requiring direct physical contact between two surfaces. As such, in situ two dimensional (2D) TCR affinity for a surface-linked pMHC is affected by other components of the cell membrane. Further, the TCR molecules are clustered on the T cell membrane and their surface organization is influenced by membrane structure and cytoskeletal components (Beemiller and Krummel, 2010; Campi et al., 2005; Grakoui et al., 1999; Miceli et al., 2001; Monks et al., 1998; Yokosuka et al., 2005), making the TCR–pMHC interaction potentially multimeric (Slifka and Whitton, 2001) and the 2D TCR affinity variable depending on the developmental and functional state of the T cell (Richer et al., 2013). The 2D force-free TCR–pMHC (Adams et al., 2011; Huang et al., 2010) and TCR–pMHC–CD8 (Jiang et al., 2011; Liu et al., 2014) binding kinetics differ substantially from the 3D counterparts measured by surface plasmon resonance (SPR) using engineered TCR constructs made by E. coli. 2D measurements correlate much better with T cell responses (Adams et al., 2011; Huang et al., 2010; Jiang et al., 2011; Liu et al., 2014) and are much more sensitive than pMHC tetramer technology (Liu et al., 2014; Sabatino et al., 2011).
In this study, we found that anatomic compartmentalization regulates TCR–pMHC interaction and fate of CD8+ T cells during the early contraction phase of viral infection. We measured the TCR–pMHC interaction by micropipette technology and found that virus-specific TCR transgenic P14 T cells within the splenic red pulp (RP) displayed significantly higher effective 2D affinity (Chesla et al., 1998; Huang et al., 2007; Huang et al., 2010) than those from the white pulp (WP). Early determination of gene expression during the initial contraction phase led memory precursors from the WP to preferentially develop into long-term memory cells as compared to their counterparts in the RP despite expression of the same memory markers (KLRG1loCD127hi). Our results suggest a regulatory mechanism of TCR–pMHC interaction, gene expression, and generation of effector and memory precursor cells governed by cellular and cytokine microenvironmental compartmentalization of the lymphoid organ during the early contraction phase of an antiviral response.
Results
Anatomic compartmentalization regulates TCR-pMHC interaction of CD8+ T cells during early immune contraction phase
Recognition of antigen by the TCR is the critical step for T cell activation and differentiation, which may be influenced by anatomic location of T cells. In order to assess whether the TCR-pMHC interaction remained consistent or differed throughout the infection and resolution period, we quantified the cross-junctional TCR–pMHC interaction by in situ measurements on the T cell surface using two-dimensional (2D) micropipette methodology to derive the effective 2D affinity (Chesla et al., 1998; Huang et al., 2007; Huang et al., 2010) upon infection with lymphocytic choriomeningitis virus (LCMV) Armstrong (Arm) (Fig. S1A). We utilized TCR transgenic “P14” T cells that are restricted for the H-2Db LCMV glycoprotein gp33-43 (gp33) epitope (KAVYNFATCGI). Typically robust anti-viral T cell responses to acute LCMV-Arm infection peak at 7–8 day post infection (dpi) with subsequent elimination of virus by day 8 (Wherry et al., 2003). The TCR-LCMV gp33 pMHC interaction of adoptively transferred P14 T cells isolated from the WP and RP was measured at various days post infection (dpi) encompassing naïve, effector, and memory phases of T cell differentiation. A mutated H2-Db MHC that abolishes CD8 binding was used to focus the pMHC interaction only to the TCR and eliminate any contribution of the CD8 molecule. We observed that effective 2D TCR affinity of P14 T cells from the RP was increased during the early contraction phase (9 and 11 dpi), while cells from the WP displayed significantly lower effective 2D affinity (Fig. 1A). By comparison, no significant effective 2D affinity differences were observed between T cells from the WP and RP compartments at 0 (naïve), 7 (effector), and 31 (memory) dpi (see Table S1 for the measured effective 2D TCR affinity values). Additionally, when we measured 2D TCR affinity of endogenous CD8+ T cells specific for a different LCMV epitope np396-404 pMHC at 11 dpi, the RP antigen-specific CD8+ T cells again displayed significantly higher effective 2D TCR affinity than the WP derived cells (Fig. 1B). This result suggested that the differential effective 2D TCR affinity is not unique to transgenic P14 T cells targeting the gp33 epitope. The differences in 2D effective affinities were not due to aberrant expression of TCR levels on P14 cells as the expression was similar irrespective of their anatomic location (Table S1). To exclude the possibility of involvement of a second TCRα chain in TCR-pMHC interaction, we also measured 2D effective TCR affinity of RAG-1-deficient P14 T cells. Similar to the previous result (Fig. 1A), RAG-1-deficient P14 from the RP displayed significantly higher effective 2D TCR affinity than cells from the WP (Fig. 1C). Importantly, the differential effective 2D affinity is TCR and pMHC specific, as no differences were observed for binding of the CD8 molecule with the MHC (Fig. 1D) and of TCR with an anti-TCR antibody (Fig. 1E) between T cells from the WP and RP. However, allowing the CD8 molecule to synergize with the TCR to form cooperative TCR–pMHC–CD8 tri-molecular bonds by using the wild-type pMHC molecule (Jiang et al., 2011; Liu et al., 2014), significantly amplified effective 2D affinity differences between T cells from the WP and RP (Fig. S1B). Furthermore, pMHC tetramer staining of cells obtained from the two compartments was indistinguishable (Fig. 1F), consistent with previous reports that our mechanical-based assay is more sensitive than tetramer staining methodology to discriminate TCR–pMHC interaction differences (Liu et al., 2014; Sabatino et al., 2011). These results indicated that the TCR-pMHC interaction of antigen-specific CD8+ T cells is regulated by their anatomic location in the spleen during the early immune contraction phase.
Fig. 1. Anatomic segregation regulates TCR-pMHC interaction of CD8+ T cells over time.

P14 T cells were adoptively transferred to B6 mice one day before infection with LCMV-Arm and isolated on indicated dpi from splenic white (WP) or red pulp (RP) for effective 2D TCR affinity measurement by micropipette. A. TCR–pMHC interaction of P14 T cells from the WP (blue) or RP (red) measured at the indicated dpi. Dashed line indicates measured effective 2D affinity for CD8-MHC interaction (from panel D). B. Interaction between np396 pMHC and TCR of endogenous CD8+ T cells isolated from the WP (blue) or RP (red) was measured at 11 dpi by micropipette. C. TCR-pMHC interaction of RAG-1-deficient P14 T cells from the WP or RP was measured at 11 dpi by micropipette. D. CD8–MHC interaction of P14 T cells from the WP and RP were measured by micropipette. E. Adhesion frequencies for TCR–pMHC and TCR–anti-TCR antibody of P14 T cells from the WP and RP were measured by micropipette. F. Thy1.1+ P14 cells from the WP or RP were stained with gp33 tetramer (gp33 Tet) at 11 dpi. For each condition of micropipette assay, more than 8 cell pairs were tested with 30 contacts (A – E). Each figure shows a representative result of at least three independent experiments. The box and whisker graph displays 25–75% (box) of data and the minimum and maximum values (whisker). The line within the box represents the median value. NS = not significant; *** = P<0.001. See also Figure S1 and Table S1.
The increased effective 2D TCR affinity correlates with enhanced cell killing by CD8+ T cells and the ability to recognize a viral CTL escape epitope
Increases in the effective 2D TCR affinity of circulating T cells during early contraction phase may enable them to recognize target cells that contain less antigen. Consistent with this idea, T cells circulating in the peripheral blood, possibly probing for minute residual antigen(s), displayed higher effective 2D affinity than T cells residing in the WP at 11 dpi, while no significant effective 2D affinity differences were observed at 7 and 15 dpi (Fig. 2A). RP-derived T cells isolated by intravascular cell staining technique (Anderson et al., 2014) contains only a small proportion of intravascular cells (~4%) (Fig. S2). Therefore, the small percentages of intravascular cells in the RP were not the major contributors to effective 2D TCR affinity outcome of T cells in RP. The increased effective 2D affinity may help to prevent viral persistence during the early immune contraction phase, which could result from viral cytotoxic T lymphocyte (CTL) escape mutation(s). To test this idea, we used the gp35A ligand obtained by substituting an alanine for valine at position 35 of gp33 epitope. This mutation was naturally observed previously during persistent infection of mice with LCMV (Puglielli et al., 2001). T cells from the RP displayed higher effective 2D TCR affinity to gp35A bound to H2-Db than cells from the WP (Fig. 2B). Further supporting the idea above, P14 T cells from the RP at 11 dpi killed LCMV gp35A (Fig. 2C and D) and gp33-pulsed (Fig. 2E) target cells more efficiently than T cells from the WP. Thus, P14 T cells from both RP and circulating peripheral blood bound antigen with higher TCR–pMHC effective 2D affinity than T cells residing in the WP and this correlates with an increased effector function for killing target cells. These results suggest that the increased 2D affinities of CD8+ T cells are important to recognize, target and clear viral CTL escape variants during the early immune contraction phase.
Fig. 2. The increased effective 2D TCR affinity correlates with cell killing by P14 T cells.

P14 cells were adoptively transferred into mice, followed by infecting the mice with LCMV-Arm. A. At 7, 11, and 15 dpi, the effective 2D TCR affinities of P14 T cells from the WP, RP, or peripheral blood (PB) was measured by micropipette assay. B. The effective 2D TCR affinities of the WP and RP P14 cells to LCMV gp33 (GP33) and 35A (GP35A)-pMHC were measured by micropipette assay at 11 dpi. C–E. Specific killing of LCMV peptide gp35A (0.4, 0.04, 0.004 μg per mL) (C, D) or gp33 (0.04 μg per mL)-pulsed (E) splenocytes by P14 T cells from WP and RP at 11 dpi was measured by flow cytometry (n=5). More than 10 cell pairs with 30 contacts were tested for each condition (A and B). Each figure shows a representative result of at least three independent experiments. For the box whisker graph, the box represents 25–75% of data and whisker indicates the minimum and maximum values. The line within the box represents the median value. NS=not significant; *=P<0.05, ***=P<0.001. See also Figure S2.
Tregs and TGF-β regulate TCR–pMHC interaction of CD8+ T cells in the WP
We next investigated whether differential microenvironmental factors between the WP and RP regulate TCR-pMHC interactions. While the majority of CD4+ T cells resided in the WP, CD8+ T cells were preferentially located in the RP (Fig. S3A and B). Thus, CD8+ T cells residing in the WP may have more opportunity to communicate with or be regulated by CD4+ T cells than those residing in the RP, as a consequence resulting in differential 2D TCR affinities. Although CD4+ T cells are not required for CD8+ T cells to clear LCMV-Arm (Matloubian et al., 1994), the depletion of this subset significantly increased the effective 2D TCR affinity of P14 cells from the WP at 11 dpi but had no impact to those isolated from the RP (Fig. 3A). One could postulate that CD4 depletion may delay the clearance of viral antigen during this period, which would subsequently increase the 2D TCR affinity of P14 cells from the WP. However, our measurement of TCR-pMHC interaction at 5 dpi indicates that the effective 2D TCR affinity of P14 cells isolated from both the WP and RP compartments were very similar and significantly lower than 9 and 11 dpi (Fig. 1A) despite the presence of ample viral antigens (Wherry et al., 2003). Therefore, the potential delay in clearance of antigen by CD4 depletion, if true, may not be responsible for changes we observe in increased 2D effective affinity of P14 cells isolated from the WP. However, the frequency of FoxP3+ regulatory T cells (Tregs) was significantly increased in the spleen during this early contraction phase (11 dpi) compared to the effector phase (7 dpi) (Fig. S3C), suggesting that these cells may account for the observed effect seen when total CD4+ T cells were depleted. To test whether Tregs controlled the 2D effective affinity of P14 T cells in the WP we utilized the FoxP3-DTR (human diphtheria toxin receptor) mice to selectively deplete FoxP3+ Tregs at 7 dpi and subsequently measured the TCR–pMHC interaction of P14 T cells at 11 dpi. Similar to depletion of CD4+ T cells (Fig. 3A), removal of FoxP3+ Tregs also increased the effective 2D affinity of P14 T cells from the WP (Fig. 3B), indicating an important role for Tregs in the WP in stabilizing or maintaining effective 2D TCR affinity of CD8+ T cells during early immune contraction.
Fig. 3. Microenvironmental factors control TCR-pMHC interaction of CD8+ T cells.

A. Mice were untreated (CTR) or treated with CD4-depleting antibody (CD4Δ) −1 and 0 dpi and effective 2D TCR affinities of P14 T cells from splenic WP or RP were measured at 11 dpi. B. WT or FoxP3-DTR mice were treated with diphtheria-toxin at 7, 8, and 10 dpi to deplete FoxP3-expressing cells. Effective 2D TCR affinities were measured at 11 dpi. C. Mice were either untreated (CTR) or treated with SB431642 at 8, 9, and 10 dpi. Effective 2D TCR affinities were measured at 11 dpi. D. P14 cells from RP were sorted at 10 dpi and incubated with or without rTGF-β for 24 hrs to measure effective 2D TCR affinities. E. P14 cells were sorted from the RP at 10 dpi and incubated with FoxP3− or FoxP3+ cells that were sorted from FoxP3-DTR-GFP mice in the absence or presence of TGF-β-blocking antibodies for 24 hrs. Effective 2D TCR affinities were measured by micropipette. More than 10 cell pairs with 30 contacts were tested for each condition. The box displays 25–75% of data and whisker represents the minimum and maximum values. The median value was shown as line within the box. Each figure shows a representative result of at least three independent experiments. NS=not significant; *=P<0.05, **=P<0.01, ***=P<0.001. See also Figure S3 and S4.
Transforming growth factor-β (TGF-β) plays a pleiotropic role in the control of T cell responses (Li and Flavell, 2008) including modulation of Treg function (Chen et al., 2003). We therefore blocked the TGF-β receptor signaling by injecting mice with a specific inhibitor (SB431542) at 8, 9, 10 dpi and measured TCR–pMHC interactions of P14 T cells at 11 dpi. In concordance with our previous data, blockade of TGF-β also significantly increased the effective 2D TCR affinity of P14 T cells from the WP (Fig. 3C). In addition, in vitro incubation of RP P14 T cells with recombinant TGF-β significantly decreased their effective 2D affinity (Fig. 3D) when isolated from 11 dpi, but not from 7 dpi (Fig. S4). These results led us to examine whether Tregs regulate effective 2D affinity of T cells through production of TGF-β. We incubated RP-derived P14 T cells with CD4+FoxP3+ cells in vitro in the presence or absence of TGF-β-blocking antibodies for 24 hrs and measured the effective 2D TCR affinities of P14 T cells. In agreement with our previous data (Fig. 3B), incubation of P14 with FoxP3+ cells significantly decreased their 2D TCR affinity. However, this decrease was not observed when TGF-β blocking antibodies were added nor when P14 cells were co-cultured with the CD4+Foxp3− population (Fig. 3E). Thus, Tregs are the major source of TGF-β to maintain an effective 2D TCR affinity of CD8+ T cells during the early immune contraction phase.
Anatomic compartmentalization regulates gene expression profile patterns of CD8+ T cells
Our data indicate that TCR-pMHC interaction of T cells is controlled by cellular and cytokine microenvironmental factors such CD4+ T cells, Tregs, and TGF-β (Fig. 3). These distinct spatially regulated signals could affect gene expression profiles of antigen-specific T cells, resulting in divergent cell function and fate. We performed transcriptome mRNA sequencing (RNAseq) analysis on TCR transgenic P14 CD8+ T cells isolated from the splenic WP and RP compartments at 0, 7, 11, 15 and 33 days following LCMV-Arm infection in order to kinetically assess differences in gene expression during T cell activation, expansion and memory development. We observed distinct gene expression profiles between P14 T cells isolated from the WP and RP when compared to their respective naïve day 0 pre-infection compartment, ranging from 28–48% non-overlapping differentially expressed genes (DEGs; 2 fold, P<0.001) throughout the infection period despite the fact that these were genetically identical T cells (Fig. 4A).
Fig. 4. Anatomic compartmentalization regulates gene expression patterns of CD8+ T cells.

A. Gene expression profiles of the WP and RP P14 T cells were compared to naïve cells by RNA-seq analysis (5 mice per group). Up- or down-regulated DEGs are shown in the heat map (2-fold, P<0.001). Venn diagram indicates genes specific for the WP (left) and RP (right) and overlapping genes (middle). B. Time-series analysis on RNA-seq data between the WP and RP P14 T cells was performed. Each path represents a set of genes with a similar expression profile. Four major nodes with transition states (TS) are depicted for the WP and RP. The size of a node is proportional to the standard deviation of the expression of the genes assigned to that node. The numbers with lines indicate the number of genes for each TS. C. DEGs from the WP (blue line) and RP (red line) at 11 dpi were analyzed for functional annotation of the cellular component. Membrane structure-related GO terms are depicted. Log10 P values are represented in the radar chart. D. Effective 2D TCR affinities of P14 T cells from the WP or RP that were untreated (CTR) or treated with nystatin were measured at 11 dpi. E. P14 T cells that sorted from splenic WP and RP were either untreated (CTR) or treated with cholesterol oxidase (CO, 5 U per mL) for 30 min at 37 °C at 11 dpi. F. DEGs from the WP and RP at 11 dpi were analyzed for enrichment of biological processes. Nodes represent enriched pathways (gene size >15 genes, B-H P value < 0.0001). Edges between nodes represent overlap between two connected gene sets. Node size is proportional to enrichment significance. Blue Node edge represents common pathways between the WP and RP. Black Nodes edges represent RP-specific pathways. Enrichment scores (−log10 B–H P value) are depicted under the name of each biological function. Effective 2D TCR affinity was measured by micropipette assay. For each condition, more than 10 cell pairs with 30 contacts were tested for each condition (D and E). The box displays 25–75% of data and whisker represents the minimum and maximum values. The median value was shown as line within the box. See also Figure S5 and Table S2.
We further performed time-series analyses (Ernst et al., 2007) of these RNAseq data to better understand how gene expression is regulated between the WP and RP isolated P14 cells throughout the T cell developmental phases (Fig. 4B and S5). Kinetically, by 7 dpi, we observe four distinct nodes that denote genes that are either up or down regulated when compared to their initial pre-infection time point at day 0. Between 7 and 11 dpi, further changes in gene expression are indicated as transition states (TS) where differences both in the number of genes and their fold expression values between the WP and RP derived P14 cells are shown. For example, the expression levels for the 80 genes of WP TS1 were increased ~64 fold at 11 dpi and were subsequently maintained throughout the memory phase. However, such fold increases were not observed in any of the RP isolated P14 cells’ gene subsets. At most, there is a 16 fold increase in the 210 genes that are expressed in the TS1 of the RP compartment. In addition, when the top ten genes, solely based on their expression values in P14 cells at 11 dpi from each transition state, were compared, not only the gene list was different, but also their expression levels were markedly different between the two compartments (see heat maps of each transition state for WP and RP derived P14 cells shown in Fig. S5). Transcriptional decisions for memory cell fate were established during this early immune contraction phase. Once the transition states were established by ~11 dpi, the patterns and their expression values were maintained throughout the subsequent contraction (15 dpi) and memory phases (33 dpi).
To better understand the differential 2D TCR affinities between CD8+ T cells from the WP and RP compartments at 11 dpi, we analyzed genes related to the cell surface and plasma membrane. Through gene ontology (GO) analysis, we found substantial enrichment for genes related to cell surface-related membrane structures in RP P14 T cells when compared to WP P14 T cells. We identified DEGs that enriched for the membrane microdomain (RP, P = 2.18 × 10⁻⁸; WP, P = 3.32 × 10⁻⁴), plasma membrane protein complex (RP, P = 2.83 × 10⁻⁶; WP, P = 7.39 × 10⁻⁴), extrinsic component of plasma membrane (RP, P = 1.90 × 10⁻⁵; WP, P = 5.39 × 10⁻³), extrinsic component of membrane (RP, P = 3.58 × 10⁻⁵; WP, P = 7.68 × 10⁻⁴), integrin complex (RP, P = 2.06 × 10⁻⁴; WP, P =2.11 × 10⁻³), and plasma membrane receptor complex (RP, P = 7.68 × 10⁻⁴; WP, P = 0) (Fig. 4C). TGF-β that affects 2D TCR affinity of T cells (Fig. 3C, D, E) has been known to regulate plasma membrane protein clustering (Yamazaki et al., 2009). Thus, these results suggested that the TCR–pMHC interaction may be regulated by the T cell membrane spatial connectedness. Since cholesterol is critically important to maintain membrane integrity, we measured the TCR–pMHC interaction following cholesterol sequestration by nystatin (Fig. 4D) or depletion using cholesterol oxidase (Fig. 4E) at 11 dpi. Consistent with previous reports (Huang et al., 2007; Huang et al., 2010; Jiang et al., 2011; Liu et al., 2015), these treatments significantly reduced the effective 2D TCR affinities and eliminated the differences seen between P14 cells isolated from splenic WP and RP compartments.
We next performed enrichment map analysis to identify biological processes that are differentially enriched between the RP and WP P14 T cells at 11 dpi. We found significant enrichment for biological processes related to regulation of cell activation including immune response (enrichment score [ES] = 43.9), lymphocyte effector response (ES = 34.8), lymphocyte activation (ES = 27.4), regulation of immune response (ES = 25.2), and regulation of lymphocyte activation (ES = 25.2) in T cells from RP at 11 dpi (Fig. 4F and Table S2). We found little overlap of significantly enriched biological processes between the WP and RP P14 T cells, strongly suggesting that the RP P14 T cells may have greater effector-like responses as compared to WP P14 T cells. These results suggest that anatomic compartmentalization is an important regulator of T cell gene expression, effector function and memory formation.
TCR-pMHC interaction is regulated by differentiation status of CD8+ T cells
We observed differential effective 2D TCR affinities of T cells isolated from the WP and RP compartments during the early contraction phase (Fig. 1A). Coincidentally, decisions for memory gene expression patterns were established between 7 and 11 dpi (Fig. 4B), indicating that T cells actively underwent effector to memory differentiation during this period. These results led us to hypothesize that the differentiation status of T cells in their respective compartment may influence the TCR–pMHC interaction. To this end, we first subdivided CD8+ T cells into effector and memory cells in each compartment based on their phenotypic marker expression (KLRG1 and CD127) (Joshi et al., 2007; Kaech et al., 2003). A higher preponderance of effector T cells was observed in the RP than WP, while memory precursor population were preferentially located in the WP as compared to RP by 11 dpi (Fig. 5A and (Jung et al., 2010)). Effective 2D TCR affinity of effector T cells (KLRG1highCD127low) isolated from the RP was significantly higher than that of memory precursor cells (KLRG1lowCD127high) from the same anatomic location in the RP (Fig. 5B). In fact, this population accounts for the overall increased 2D TCR effective affinity that we observed earlier in Fig. 1. Moreover, the effective 2D TCR affinities of each effector and memory precursor P14 cells were lower in the WP compared to their respective counterparts in the RP despite the fact that they expressed the same cell surface molecules (Fig. 5B). As engagement of TCR with pMHC is critical for the effector function of T cells, we tested whether higher effective 2D TCR affinity of T cells results in better control of viremia. To this end, we infected naïve B6 mice with LCMV-arm that is cleared much more effectively by virus-specific CD8+ T cells than the LCMV Clone 13 in vivo (Wherry et al., 2003). Then, effector P14 cells (KLRG1highCD127low) were sorted from either the WP or RP at 11 dpi and adoptively transferred into mice that were infected with LCMV-arm one day before. Viral titers in the spleens were determined by focus-forming assay. As expected, the RP effector P14 T cells were able to decrease the viral load by more than five fold as compared to the WP-derived P14 T cells (Fig. 5C). These results showed that the effector functions of anti-viral CD8+ T cells and their improved control of viremia are regulated by their respective anatomic location.
Fig. 5. Differentiation status controls effective 2D TCR affinity of CD8+ T cells.

A. Percentage of KLRG-1lowCD127high and KLRG-1highCD127low population was compared between the WP and RP at 11 dpi (n=5). B. Effective 2D TCR affinity of KLRG-1lowCD127high or KLRG-1highCD127low P14 T cells from the WP or RP was analyzed by micropipette at 11 dpi. For each condition, 10 cell pairs with 30 contacts were tested. C. KLRG-1highCD127low effector P14 T cells were sorted from the WP or RP at 11 dpi and adoptively transferred into the mice that were infected with LCMV-Arm one day before (200,000 cells per mouse). Viral titers in spleens were determined by focus-forming assay at 3 dpi (n=15). Each figure shows a representative result of at least three independent experiments. For the box whisker graph, the box represents 25–75% of data and whisker indicates the minimum and maximum values. The median value was shown as line within the box. NS=not significant; *=P<0.05, **=P<0.01, ***=P<0.001.
Anatomic localization determines memory formation of CD8+ T cells
Transcriptional profiling analyses revealed that gene expression patterns for memory population were differentially established between T cells isolated from the WP and RP during early contraction phase (Fig. 4B). Also, when we compared the molecular signatures of memory responses using previously established databases (Kaech et al., 2002; Wherry et al., 2007), the expression patterns related to memory response genes were significantly different between the WP and RP isolated P14 cells at 11 dpi (Fig. 6A). For example, Ifng, Itgax, Ggh, and Prdm1 were expressed much higher in the WP-derived P14 T cells than the RP. In contrast, higher expression of Ccr5, Ctla4, Cox17, and Tbx21 were observed in RP-derived T cells than the WP (Fig. 6B). These observations suggest that anatomic compartmentalization of T cells during this early contraction phase may influence the formation of memory cell population. To test this hypothesis, P14 T cells expressing the same memory precursor markers (KLRG1lowCD127high) (Joshi et al., 2007; Kaech et al., 2003) from either the WP or RP compartments were sorted at 11 dpi. Equal number of cells were then transferred into naive B6 mice and rested until they reached 30 dpi (Fig. S6A). To determine how the transferred cells were distributed 30 dpi, splenic location of P14 cells were analyzed by intravascular staining (Anderson et al., 2014). Both the WP- and RP-derived P14 cells were preferentially enriched in the WP rather than the RP at 30 dpi (Fig. S6B). Finally, we evaluated the degree of antigen-specific T cell expansion by challenging the mice with LCMV Clone 13. At 5 days after challenge, memory precursor P14 cells that were initially derived from the WP compartment expanded to significantly higher frequencies than cells from the RP (~50% versus ~12% respectively) (Fig. 6D). Effector cells from neither WP nor RP expanded after challenge (<1%, data not shown). These data demonstrated that anatomic compartmentalization of T cells is an important regulator of T cell memory differentiation and that the decision programming to become a memory cell is made during the early contraction phase.
Fig. 6. Anatomic compartmentalization regulates memory formation of CD8+ T cells.

A. Gene expression profiles of WP and RP P14 T cells were compared to naïve cells by RNA-seq analysis. 222 DEGs of WP and RP P14 T cells out of memory (468 DEGs) CD8+ T cell-specific DEGs at 11 dpi were enriched and shown in heat map. B. Representative genes related to cytokines, chemokine, activation, metabolism, and transcription factors are shown. C. KLRG-1lowCD127high P14 T cells from the WP or RP at 11 dpi were transferred into naïve B6 mice. Three weeks later, mice were challenged with LCMV Clone 13 (CL13). Expansion of P14 in spleen was analyzed by flow cytometry 5 days after infection with LCMV CL13 (n=3). A representative result of three independent experiments is shown. **=P<0.01. See also Figure S6.
Discussion
Host immune T cell responses must deploy a sensory strategy to find and clear to the best of their ability any residual antigen or potential viruses that harbor CTL escape epitopes during this fragile period. Typically, selection of viral escape mutants occurs immediately after peak of viremia (Goulder and Watkins, 2004) when immune response begins to wane and undergo contraction. Indeed, our results indicated that the effective 2D TCR affinity of anti-viral CD8+ T cells was increased immediately after the virus was cleared. In addition, this increased ability to see antigen correlated with P14 T cells’ capacity to kill the gp35A mutant epitope-expressing cells. Since failure to recognize escape mutant epitopes leads to viral persistence, this observation of increased TCR–pMHC interaction during the early contraction phase provides important insights into the development of novel strategies to prevent persistent infections.
Lymphoid organs such as a spleen provide a unique environment for expansion and differentiation of immune cells upon infection. Thus, most immunological studies rely on analyses of immune cells within lymphoid organs. We observed that despite expression of the same phenotypic markers such as KLRG1 and CD127, TCR–pMHC interaction of anti-viral CD8+ T cells were differentially regulated according to their anatomic location within the same organ. This suggests that effector cells defined by their phenotypic marker expressions are not a homogenous population based on their effective 2D TCR affinity measurements. This notion was not attainable simply by tetramer staining. Also, our gene expression profiling analyses reveal that gene expression patterns of CD8+ T cells for effector function-related pathways were influenced by their anatomic location. These features strongly support more efficient killing of target cells and controlling the viremia by CD8+ T cells. Furthermore, anatomic compartmentalization differentially determined the potential of KLRG1lowCD127high WP memory precursor resident cells to become long-term memory cells. Therefore, anatomic location of immune cells through their developmental journey is an important factor to define their cell function and fate.
As anti-viral T cells undergo contraction, T cells reprogram their metabolic genes required for differentiation of long-term memory cell population (Man and Kallies, 2015). For example, Memory CD8+ T cells use lysosomal acid lipase (LAL) to mobilize fatty acid for FAO and memory development (O’Sullivan et al., 2014). Also Kaech and colleagues reported that IL-7-induced glycerol channel aquaporin 9 (AQP9) promotes memory CD8+ T cell survival and self-renewal (Cui et al., 2015). Interestingly, we found that anatomic segregation differentially regulates expression of several metabolic-related genes such as Lipa, Ctpa, Cox17, and Ggh. Also, memory precursor cells from the WP compartment displayed better potential to become long-lived memory cells. Thus, the differential expression of metabolic-related genes exclusively in T cells residing in the WP may possibly influence their ability to differentiate into memory cells.
After virus is cleared, immune cells rapidly undergo contraction to return to homeostasis and potentially select long-term memory cells. Our transcriptional profiling results indicated that during the early contraction phase, gene expression patterns were differentially determined between the WP and RP-derived antigen-specific P14 T cells within the splenic compartments. In addition, once the decision was made very early post vial clearance, the gene expression patterns and their respective levels were maintained throughout the ensuing contraction and memory phases. These results provide a better understanding of how memory precursor population are established and may have important implication for development of efficacious vaccines.
Our data also indicated that TCR–pMHC interaction of CD8+ T cells was regulated by Treg and TGF-β in the WP. Treg and TGF-β may provide local protection against T cell-mediated damage by maintaining consistent TCR–pMHC 2D effective affinity of WP-resident CD8+ T cells. Treg and TGF-β both play critical roles in controlling CD8+ T cell responses in many different illnesses, including infectious disease and cancer (Ahmadzadeh et al., 2009; Penaloza-MacMaster et al., 2014; Tinoco et al., 2009). In addition, increased TCR–pMHC interaction may influence organ-specific hyperactive CD8+ T cell response in autoimmune disorders (Liblau et al., 2002). Therefore, regulation of TCR–pMHC interaction by their anatomic compartmentalization, presence of regulatory cells and cytokines within these microcompartments may be implicated in disease outcome.
Together, our findings suggest that compartmentalization of T cells into discrete areas of lymphoid structures within the same organ has important consequences for how they see antigen. Compartmentalization of these T cells during early contraction phase affects their differential gene expression and memory development. These results have substantial implications for the development of more effective vaccines and T cell-targeted immunotherapy for infectious diseases, cancers, and autoimmune disorders.
Experimental Procedures
Animal
C57BL6 and FoxP3 DTR-GFP mice (male 8 – 12 week old) were purchased from Jackson Lab. P14 TCR transgenic mice were provided from Dr. Rafi Ahmed at Emory University. RAG-1-deficient P14 mice were also generated to obtain pure monoclonal T cell population (Fig. S1). Mice were bred and maintained at the vivarium of Emory University according to institutional guideline and with protocols approved by Institutional Animal Care and Use Committee.
Virus, antibody, and pMHC
LCMV (Arm and Cl13) was a gift from Dr. Rafi Ahmed at Emory University. For the infection, the mice were infected intraperitoneally (i.p.) with 2×10⁵ plaque-forming unit (PFU) of LCMV-Arm. Viral titers were determined by focus-forming assay on Vero cells as described previously (Battegay et al., Journal of virological methods, 1991) Detailed information for antibody and pMHC is available in Supplemental Information.
Intravascular cell staining
P14 TCR transgenic T cells (Thy1.1+ or CD45.1+) were adoptively transferred into C57BL6 (Thy1.2+CD45.2+) mice one day before infection with LCMV-Arm. At indicated days post infection, mice were intravenously injected with fluorochrome-conjugated anti-CD45.2 (3 μg per mouse, clone: 104, eBiosciences) or anti-CD8α antibody (3 μg per mouse, clone: 53-6.7, eBiosciences) and euthanized 3 min after antibody delivery as previously described (Anderson et al., 2014). Spleens were harvested, processed to a single cell suspension and followed by staining with ex vivo antibodies (Thy1.1 or CD45.1). P14 cells from splenic WP (i.v. antibody negative) and RP (i.v. antibody positive) were sorted by BD FACSAria™ II for analyses of effective 2D TCR affinity, transcriptional profiles, and memory response.
Transcriptional profile analysis
DESeq was used to determine differentially expressed genes between sorted WP or RP P14 T cells following LCMV infection and naïve P14 T cells in their respective compartment (2 fold; P<0.001). Detailed protocol for RNA preparation and time-series analysis can be found in Supplemental Information. Functional analysis was performed using Gene Ontology Consortium (Gene Ontology, 2015) and DAVID Bioinformatics Resources (Huang da et al., 2009a, b) online tools. The raw data of all arrays were deposited with the Gene Expression Omnibus (GEO) repository under the accession number GEO: GSE87561.
In vitro killing assay
P14 T cells that sorted from either WP or RP were mixed with CFSE-labeled, unpulsed or LCMV gp33- or gp35A-pulsed splenocytes (effector:target ratio = 5:1, 2.5:1, or 1:1). After 4 hours, cells were stained with propidium iodide (PI, BD biosciences). Cell death was estimated by PI inclusion of CFSE+ cells on flow cytometry.
Depletion of CD4 & Treg and inhibition of TGF-β
For the depletion of CD4+ cells, mice were administrated intraperitoneally with CD4-depleting antibody (GK1.5, 500 μg per mouse) at −1 and 0 dpi. CD4 depletion was verified by flow cytometry before measurement of 2D TCR affinity. Depletion of FoxP3+ Treg was performed by intraperitoneal administration of FoxP3-DTR mice with DT (Calbiochem, diphtheria toxin, 1 μg per mouse) at 7, 8, and 10 dpi. Depletion of FoxP3+ cells was verified by flow cytometry before measurement of effective 2D TCR affinity. In order to inhibit TGF-β receptor signaling, mice were treated intraperitoneally with a specific inhibitor (Sigma, SB431542, 20 mg per Kg per mouse) at 8, 9, and 10 dpi.
Sequestration or depletion of cholesterol
To sequester cholesterol from plasma membrane, splenocytes were left untreated or treated with nystatin (Sigma, 25 μg per mL) for 30 min at 37 °C followed by sorting cells and measuring effective 2D TCR affinity. Depletion of cholesterol was performed by treating sorted cells with cholesterol oxidase (Sigma, 5 U per mL) for 30 min at 37 °C. Cells were continuously exposed to cholesterol oxidase during micropipette assay.
Protein coating on RBC surface
Human RBCs were purified from peripheral blood of healthy donors at Georgia Institute of Technology with an Institute Review Board-approved protocol as described (Chesla et al., 1998). Detailed description can be found in the Supplemental Information.
Site density measurements
Densities of TCR, CD8, and pMHC were determined by flow cytometry for every micropipette experiment conducted as previously described (Chesla et al., 1998; Huang et al., 2010). Detailed description is available in the Supplemental Information.
2D micropipette adhesion frequency assay
Briefly, two laterally opposing pipettes respectively aspirated a T cell and a pMHC-coated RBC. The RBC pipette was driven by a piezo controller to allow the RBC to contact the T cell for certain duration before retracting it back to the starting point. Detailed information can be found in Supplemental Information.
Calculating effective 2D affinity
The adhesion frequency Pa vs. contact time (tc) data was fit using a nonlinear regression to the following probabilistic kinetic model (Chesla et al., 1998; Huang et al., 2010) along with the respective site densities of the TCR or CD8 (mr) and pMHC or anti-TCR (ml)
| (1) |
to obtain two parameters: a zero-force off-rate koff (s−1) and 2D effective binding affinity, AcKa (μm4). Ac is the functional contact area between the RBC and T cell and Ka denotes 2D affinity(Chesla et al., 1998; Huang et al., 2010). Upon taking the log transformation of equation 1 as tc approaches steady state simplifies the equation, which was used more extensively for analysis.
| (2) |
For the majority of the experiment, the adhesion frequency was measured at 4-s contact duration as any contact time >2 s resulted in comparable adhesion frequencies. For the measurements of cooperative TCR–pMHC–CD8 tri-molecular interaction, the right-hand side of equation 2 represents the average number of bonds <n> (the numerator) per unit densities of TCR and pMHC.
Statistical analysis
All error bars represent mean ± standard error of the mean (SEM), and averages were compared using unpaired Student’s t-test or one-way ANOVA. Data are representative of at least 2 independent experiments.
Supplementary Material
Acknowledgments
We thank Drs. Rafi Ahmed, David Weiss, Brian Evavold, and Christopher Walker for helpful discussions. We would like to thank Drs. David Masopust and Jacob Kohlmeier for helping us to establish and adapt the intravascular staining procedure and Larissa Doudy for technical support. We acknowledge the NIH Tetramer Core Facility (contract HHSN272201300006C) for provision of tetramers. We also would like to thank Yerkes Nonhuman Primate Genomics Core and the Immunology and Flow Cytometry Core of the Center for AIDS Research at Emory University (P30AI050409). This project was supported by NIH grants U19AI083019 and R56AI110516 to M.S.S., NIH grants AI038282, GM096187, and R01AI124680 to C.Z., and ORIP-OD P51OD011132 (formerly NCRR P51RR000165) to the Yerkes National Primate Research Center and NIH grants R01AI070101, R01AI124680, R01AI126890, and R21AI118337 to A.G. Its contents are solely the responsibility of the authors and do not necessarily represent the official views of the NIH.
Footnotes
Author contributions
Y.S. and P.J. performed the experiments; M.S. performed the transcriptional profiling analysis; Y.S., P.J., M.S., C.Z. and A.G. conceived and designed the experiments, interpreted the data, and wrote the manuscript.
Publisher's Disclaimer: This is a PDF file of an unedited manuscript that has been accepted for publication. As a service to our customers we are providing this early version of the manuscript. The manuscript will undergo copyediting, typesetting, and review of the resulting proof before it is published in its final citable form. Please note that during the production process errors may be discovered which could affect the content, and all legal disclaimers that apply to the journal pertain.
References
- Adams JJ, Narayanan S, Liu B, Birnbaum ME, Kruse AC, Bowerman NA, Chen W, Levin AM, Connolly JM, Zhu C, et al. T cell receptor signaling is limited by docking geometry to peptide-major histocompatibility complex. Immunity. 2011;35:681–693. doi: 10.1016/j.immuni.2011.09.013. [DOI] [PMC free article] [PubMed] [Google Scholar]
- Ahmadzadeh M, Johnson LA, Heemskerk B, Wunderlich JR, Dudley ME, White DE, Rosenberg SA. Tumor antigen-specific CD8 T cells infiltrating the tumor express high levels of PD-1 and are functionally impaired. Blood. 2009;114:1537–1544. doi: 10.1182/blood-2008-12-195792. [DOI] [PMC free article] [PubMed] [Google Scholar]
- Anderson G, Jenkinson EJ. Lymphostromal interactions in thymic development and function. Nature reviews Immunology. 2001;1:31–40. doi: 10.1038/35095500. [DOI] [PubMed] [Google Scholar]
- Anderson KG, Mayer-Barber K, Sung H, Beura L, James BR, Taylor JJ, Qunaj L, Griffith TS, Vezys V, Barber DL, Masopust D. Intravascular staining for discrimination of vascular and tissue leukocytes. Nature protocols. 2014;9:209–222. doi: 10.1038/nprot.2014.005. [DOI] [PMC free article] [PubMed] [Google Scholar]
- Beemiller P, Krummel MF. Mediation of T-cell activation by actin meshworks. Cold Spring Harbor perspectives in biology. 2010;2:a002444. doi: 10.1101/cshperspect.a002444. [DOI] [PMC free article] [PubMed] [Google Scholar]
- Campi G, Varma R, Dustin ML. Actin and agonist MHC-peptide complex-dependent T cell receptor microclusters as scaffolds for signaling. The Journal of experimental medicine. 2005;202:1031–1036. doi: 10.1084/jem.20051182. [DOI] [PMC free article] [PubMed] [Google Scholar]
- Chen W, Jin W, Hardegen N, Lei KJ, Li L, Marinos N, McGrady G, Wahl SM. Conversion of peripheral CD4+CD25− naive T cells to CD4+CD25+ regulatory T cells by TGF-beta induction of transcription factor Foxp3. The Journal of experimental medicine. 2003;198:1875–1886. doi: 10.1084/jem.20030152. [DOI] [PMC free article] [PubMed] [Google Scholar]
- Chesla SE, Selvaraj P, Zhu C. Measuring two-dimensional receptor-ligand binding kinetics by micropipette. Biophysical journal. 1998;75:1553–1572. doi: 10.1016/S0006-3495(98)74074-3. [DOI] [PMC free article] [PubMed] [Google Scholar]
- Cui G, Staron MM, Gray SM, Ho PC, Amezquita RA, Wu J, Kaech SM. IL-7-Induced Glycerol Transport and TAG Synthesis Promotes Memory CD8+ T Cell Longevity. Cell. 2015;161:750–761. doi: 10.1016/j.cell.2015.03.021. [DOI] [PMC free article] [PubMed] [Google Scholar]
- Ernst J, Vainas O, Harbison CT, Simon I, Bar-Joseph Z. Reconstructing dynamic regulatory maps. Molecular systems biology. 2007;3:74. doi: 10.1038/msb4100115. [DOI] [PMC free article] [PubMed] [Google Scholar]
- Gene Ontology C. Gene Ontology Consortium: going forward. Nucleic Acids Res. 2015;43:D1049–1056. doi: 10.1093/nar/gku1179. [DOI] [PMC free article] [PubMed] [Google Scholar]
- Gerlach C, Rohr JC, Perie L, van Rooij N, van Heijst JW, Velds A, Urbanus J, Naik SH, Jacobs H, Beltman JB, et al. Heterogeneous differentiation patterns of individual CD8+ T cells. Science. 2013;340:635–639. doi: 10.1126/science.1235487. [DOI] [PubMed] [Google Scholar]
- Goulder PJ, Watkins DI. HIV and SIV CTL escape: implications for vaccine design. Nature reviews Immunology. 2004;4:630–640. doi: 10.1038/nri1417. [DOI] [PubMed] [Google Scholar]
- Grakoui A, Bromley SK, Sumen C, Davis MM, Shaw AS, Allen PM, Dustin ML. The immunological synapse: a molecular machine controlling T cell activation. Science. 1999;285:221–227. doi: 10.1126/science.285.5425.221. [DOI] [PubMed] [Google Scholar]
- Huang da W, Sherman BT, Lempicki RA. Bioinformatics enrichment tools: paths toward the comprehensive functional analysis of large gene lists. Nucleic Acids Res. 2009a;37:1–13. doi: 10.1093/nar/gkn923. [DOI] [PMC free article] [PubMed] [Google Scholar]
- Huang da W, Sherman BT, Lempicki RA. Systematic and integrative analysis of large gene lists using DAVID bioinformatics resources. Nature protocols. 2009b;4:44–57. doi: 10.1038/nprot.2008.211. [DOI] [PubMed] [Google Scholar]
- Huang J, Edwards LJ, Evavold BD, Zhu C. Kinetics of MHC-CD8 interaction at the T cell membrane. Journal of immunology. 2007;179:7653–7662. doi: 10.4049/jimmunol.179.11.7653. [DOI] [PubMed] [Google Scholar]
- Huang J, Zarnitsyna VI, Liu B, Edwards LJ, Jiang N, Evavold BD, Zhu C. The kinetics of two-dimensional TCR and pMHC interactions determine T-cell responsiveness. Nature. 2010;464:932–936. doi: 10.1038/nature08944. [DOI] [PMC free article] [PubMed] [Google Scholar]
- Jiang N, Huang J, Edwards LJ, Liu B, Zhang Y, Beal CD, Evavold BD, Zhu C. Two-stage cooperative T cell receptor-peptide major histocompatibility complex-CD8 trimolecular interactions amplify antigen discrimination. Immunity. 2011;34:13–23. doi: 10.1016/j.immuni.2010.12.017. [DOI] [PMC free article] [PubMed] [Google Scholar]
- Joshi NS, Cui W, Chandele A, Lee HK, Urso DR, Hagman J, Gapin L, Kaech SM. Inflammation directs memory precursor and short-lived effector CD8(+) T cell fates via the graded expression of T-bet transcription factor. Immunity. 2007;27:281–295. doi: 10.1016/j.immuni.2007.07.010. [DOI] [PMC free article] [PubMed] [Google Scholar]
- Jung YW, Rutishauser RL, Joshi NS, Haberman AM, Kaech SM. Differential localization of effector and memory CD8 T cell subsets in lymphoid organs during acute viral infection. Journal of immunology. 2010;185:5315–5325. doi: 10.4049/jimmunol.1001948. [DOI] [PMC free article] [PubMed] [Google Scholar]
- Kaech SM, Cui W. Transcriptional control of effector and memory CD8+ T cell differentiation. Nature reviews Immunology. 2012;12:749–761. doi: 10.1038/nri3307. [DOI] [PMC free article] [PubMed] [Google Scholar]
- Kaech SM, Hemby S, Kersh E, Ahmed R. Molecular and functional profiling of memory CD8 T cell differentiation. Cell. 2002;111:837–851. doi: 10.1016/s0092-8674(02)01139-x. [DOI] [PubMed] [Google Scholar]
- Kaech SM, Tan JT, Wherry EJ, Konieczny BT, Surh CD, Ahmed R. Selective expression of the interleukin 7 receptor identifies effector CD8 T cells that give rise to long-lived memory cells. Nature immunology. 2003;4:1191–1198. doi: 10.1038/ni1009. [DOI] [PubMed] [Google Scholar]
- Li MO, Flavell RA. TGF-beta: a master of all T cell trades. Cell. 2008;134:392–404. doi: 10.1016/j.cell.2008.07.025. [DOI] [PMC free article] [PubMed] [Google Scholar]
- Liblau RS, Wong FS, Mars LT, Santamaria P. Autoreactive CD8 T cells in organ-specific autoimmunity: emerging targets for therapeutic intervention. Immunity. 2002;17:1–6. doi: 10.1016/s1074-7613(02)00338-2. [DOI] [PubMed] [Google Scholar]
- Liu B, Chen W, Natarajan K, Li Z, Margulies DH, Zhu C. The cellular environment regulates in situ kinetics of T-cell receptor interaction with peptide major histocompatibility complex. European journal of immunology. 2015 doi: 10.1002/eji.201445358. [DOI] [PMC free article] [PubMed] [Google Scholar]
- Liu B, Zhong S, Malecek K, Johnson LA, Rosenberg SA, Zhu C, Krogsgaard M. 2D TCR-pMHC-CD8 kinetics determines T-cell responses in a self-antigen-specific TCR system. European journal of immunology. 2014;44:239–250. doi: 10.1002/eji.201343774. [DOI] [PMC free article] [PubMed] [Google Scholar]
- Man K, Kallies A. Synchronizing transcriptional control of T cell metabolism and function. Nature reviews Immunology. 2015;15:574–584. doi: 10.1038/nri3874. [DOI] [PubMed] [Google Scholar]
- Manning TC, Kranz DM. Binding energetics of T-cell receptors: correlation with immunological consequences. Immunology today. 1999;20:417–422. doi: 10.1016/s0167-5699(99)01508-x. [DOI] [PubMed] [Google Scholar]
- Matloubian M, Concepcion RJ, Ahmed R. CD4+ T cells are required to sustain CD8+ cytotoxic T-cell responses during chronic viral infection. Journal of virology. 1994;68:8056–8063. doi: 10.1128/jvi.68.12.8056-8063.1994. [DOI] [PMC free article] [PubMed] [Google Scholar]
- Miceli MC, Moran M, Chung CD, Patel VP, Low T, Zinnanti W. Co-stimulation and counter-stimulation: lipid raft clustering controls TCR signaling and functional outcomes. Seminars in immunology. 2001;13:115–128. doi: 10.1006/smim.2000.0303. [DOI] [PubMed] [Google Scholar]
- Monks CR, Freiberg BA, Kupfer H, Sciaky N, Kupfer A. Three-dimensional segregation of supramolecular activation clusters in T cells. Nature. 1998;395:82–86. doi: 10.1038/25764. [DOI] [PubMed] [Google Scholar]
- O’Sullivan D, van der Windt GJ, Huang SC, Curtis JD, Chang CH, Buck MD, Qiu J, Smith AM, Lam WY, DiPlato LM, et al. Memory CD8(+) T cells use cell-intrinsic lipolysis to support the metabolic programming necessary for development. Immunity. 2014;41:75–88. doi: 10.1016/j.immuni.2014.06.005. [DOI] [PMC free article] [PubMed] [Google Scholar]
- Penaloza-MacMaster P, Kamphorst AO, Wieland A, Araki K, Iyer SS, West EE, O’Mara L, Yang S, Konieczny BT, Sharpe AH, et al. Interplay between regulatory T cells and PD-1 in modulating T cell exhaustion and viral control during chronic LCMV infection. The Journal of experimental medicine. 2014;211:1905–1918. doi: 10.1084/jem.20132577. [DOI] [PMC free article] [PubMed] [Google Scholar]
- Puglielli MT, Zajac AJ, van der Most RG, Dzuris JL, Sette A, Altman JD, Ahmed R. In vivo selection of a lymphocytic choriomeningitis virus variant that affects recognition of the GP33-43 epitope by H-2Db but not H-2Kb. Journal of virology. 2001;75:5099–5107. doi: 10.1128/JVI.75.11.5099-5107.2001. [DOI] [PMC free article] [PubMed] [Google Scholar]
- Richer MJ, Nolz JC, Harty JT. Pathogen-specific inflammatory milieux tune the antigen sensitivity of CD8(+) T cells by enhancing T cell receptor signaling. Immunity. 2013;38:140–152. doi: 10.1016/j.immuni.2012.09.017. [DOI] [PMC free article] [PubMed] [Google Scholar]
- Sabatino JJ, Jr, Huang J, Zhu C, Evavold BD. High prevalence of low affinity peptide-MHC II tetramer-negative effectors during polyclonal CD4+ T cell responses. The Journal of experimental medicine. 2011;208:81–90. doi: 10.1084/jem.20101574. [DOI] [PMC free article] [PubMed] [Google Scholar]
- Slifka MK, Whitton JL. Functional avidity maturation of CD8(+) T cells without selection of higher affinity TCR. Nature immunology. 2001;2:711–717. doi: 10.1038/90650. [DOI] [PubMed] [Google Scholar]
- Starr TK, Jameson SC, Hogquist KA. Positive and negative selection of T cells. Annual review of immunology. 2003;21:139–176. doi: 10.1146/annurev.immunol.21.120601.141107. [DOI] [PubMed] [Google Scholar]
- Tinoco R, Alcalde V, Yang Y, Sauer K, Zuniga EI. Cell-intrinsic transforming growth factor-beta signaling mediates virus-specific CD8+ T cell deletion and viral persistence in vivo. Immunity. 2009;31:145–157. doi: 10.1016/j.immuni.2009.06.015. [DOI] [PMC free article] [PubMed] [Google Scholar]
- Wherry EJ, Blattman JN, Murali-Krishna K, van der Most R, Ahmed R. Viral persistence alters CD8 T-cell immunodominance and tissue distribution and results in distinct stages of functional impairment. Journal of virology. 2003;77:4911–4927. doi: 10.1128/JVI.77.8.4911-4927.2003. [DOI] [PMC free article] [PubMed] [Google Scholar]
- Wherry EJ, Ha SJ, Kaech SM, Haining WN, Sarkar S, Kalia V, Subramaniam S, Blattman JN, Barber DL, Ahmed R. Molecular signature of CD8+ T cell exhaustion during chronic viral infection. Immunity. 2007;27:670–684. doi: 10.1016/j.immuni.2007.09.006. [DOI] [PubMed] [Google Scholar]
- Yamazaki S, Iwama A, Takayanagi S, Eto K, Ema H, Nakauchi H. TGF-beta as a candidate bone marrow niche signal to induce hematopoietic stem cell hibernation. Blood. 2009;113:1250–1256. doi: 10.1182/blood-2008-04-146480. [DOI] [PubMed] [Google Scholar]
- Yokosuka T, Sakata-Sogawa K, Kobayashi W, Hiroshima M, Hashimoto-Tane A, Tokunaga M, Dustin ML, Saito T. Newly generated T cell receptor microclusters initiate and sustain T cell activation by recruitment of Zap70 and SLP-76. Nature immunology. 2005;6:1253–1262. doi: 10.1038/ni1272. [DOI] [PubMed] [Google Scholar]
Associated Data
This section collects any data citations, data availability statements, or supplementary materials included in this article.