Summary
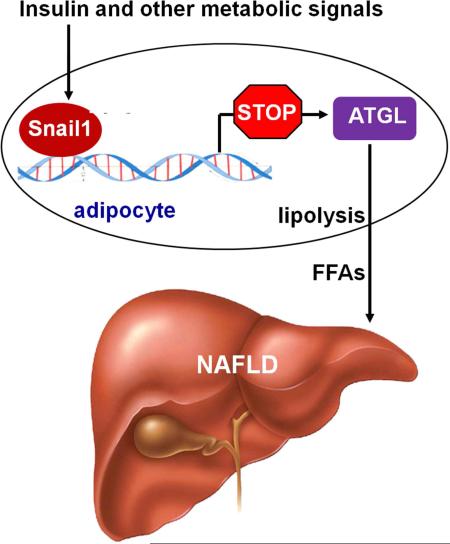
Lipolysis provides metabolic fuel; however, aberrant adipose lipolysis results in ectopic lipid accumulation and lipotoxicity. While adipose triacylglycerol lipase (ATGL) catalyzes the first step of lipolysis, its regulation is not fully understood. Here, we demonstrate that adipocyte Snail1 suppresses both ATGL expression and lipolysis. Adipose Snail1 levels are higher in fed than in fasted mice, and higher in obese as opposed to lean mice. Insulin increases Snail1 levels in both murine and human adipocytes wherein Snail1 binds to the ATGL promoter to repress its expression. Importantly, adipocyte-specific deletion of Snail1 increases adipose ATGL expression and lipolysis, resulting in decreased fat mass and increased liver fat content in mice fed either a normal chow diet or a high fat diet. Thus, we have identified a Snail1-ATGL axis that regulates adipose lipolysis and fatty acid release, thereby governing lipid partitioning between adipose and non-adipose tissues.
Graphical abstract
Introduction
White adipose tissue (WAT) stores metabolic fuel as triacylglycerol (TAG) in lipid droplets (LDs). During fasting, exercise, or cold exposure, adipose lipolysis is activated by the sympathetic nervous system (SNS) to release free fatty acids (FFAs) that power biological activities. Lipolysis also controls lipid partitioning between adipose and non-adipose tissues, and aberrant adipose lipolysis increases ectopic lipid accumulation and lipotoxicity in non-adipose tissue (e.g. the liver), thereby promoting metabolic disease (Fuchs et al., 2014; Morigny et al., 2015).
Adipose triglyceride lipase (ATGL), also termed desnutrin or Patalin-like phospholipase domain containing 2 (PNPLA2), catalyzes the first step of lipolysis in both rodents and humans (Bezaire et al., 2009; Young and Zechner, 2013). Adipose ATGL is activated upon SNS-stimulated activation of the cAMP/protein kinase A (PKA) pathway, thereby mediating lipolysis to release FFAs as key metabolic fuel during fasting (Ahmadian et al., 2011; Granneman et al., 2009; Pagnon et al., 2012; Sahu-Osen et al., 2015; Xie et al., 2014; Yamaguchi et al., 2007). Whole body deletion of ATGL blocks adipose lipolysis, and ATGL-null mice die prematurely (Haemmerle et al., 2006). Adipocyte-specific deletion of ATGL similarly blocks adipose lipolysis, thus protecting against high fat diet (HFD)-induced liver steatosis (Ahmadian et al., 2011; Schoiswohl et al., 2015; Wu et al., 2012). Conversely, adipocyte-specific overexpression of ATGL increases adipose lipolysis, thus decreasing fat mass in ATGL transgenic mice (Ahmadian et al., 2009).
Insulin, a primary metabolic hormone, inhibits lipolysis, thus allowing WAT to store TAG in the fed state. Insulin rapidly inhibits ATGL activation by suppressing the cAMP/PKA pathway, which may account for acute suppression of lipolysis (Berggreen et al., 2009; Degerman et al., 1998; DiPilato et al., 2015). Insulin also suppresses ATGL transcription in adipocytes (Bartness et al., 2014; Chakrabarti and Kandror, 2009; Chakrabarti et al., 2013; Eguchi et al., 2011; Kershaw et al., 2006; Kim et al., 2006), likely contributing to the sustained suppression of lipolysis. Expression of adipose ATGL is reduced in mice with either genetic (ob/ob) or HFD-induced obesity (Kim et al., 2006; Villena et al., 2004); reduction in adipose ATGL levels is expected to decrease adipose lipolysis, thereby protecting against ectopic lipid accumulation and lipotoxicity.
Snail1 is a Snail transcription factor family (Snail1, 2 and 3) member, and deletion of Snail1 is embryonic lethal (Carver et al., 2001). Snail1 is known to promote epithelial-tomesenchymal transition (EMT) by suppressing the expression of E-cadherin (Lin et al., 2014). Snail1 binds to the E2-boxes (CAGGTG or CACCTG) of its target promoters, eliciting transcriptionally-repressing epigenetic modifications, including H3K9 deacetylation, H3K4 demethylation, and H3K9 and H3K27 methylation (Dong et al., 2013a; Herranz et al., 2008; Lin et al., 2010; Peinado et al., 2004). Recent studies suggest that Snail1 may be involved in metabolic regulation. Snail1 suppresses the expression of PPARγ, thereby inhibiting 3T3-L1 adipocyte differentiation (Batlle et al., 2013; Lee et al., 2013). In cancer cells, Snail1 inhibits mitochondrial activity as well as the expression of lipogenic (e.g. ChREBP, ACC, and FAS) and gluconeogenic (e.g. FBPase1) genes (Dong et al., 2013b; Jiang et al., 2014; Lee et al., 2012). However, the metabolic function of Snail1 in vivo remains undefined. Herein, we demonstrate that insulin potently stimulates Snail1 expression in WAT where it acts as a molecular brake to block lipolysis via the epigenetic inhibition of ATGL expression. Consistent with its regulatory role, adipocyte-specific deletion of Snail1 results in nonalcoholic fatty liver disease (NAFLD) due to increased adipose lipolysis. Thus, adipose Snail1 operates as an epigenetic rheostat that governs lipid metabolism and lipid partitioning between tissues.
Results
Insulin stimulation increases Snail1 levels in both mouse and human adipocytes
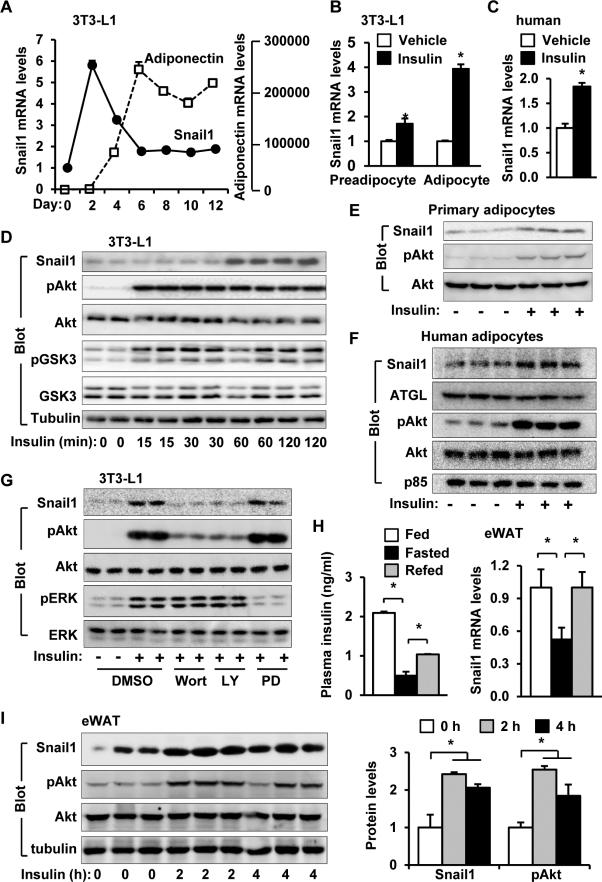
Following the induction of 3T3-L1 adipocyte differentiation, Snail1 and adiponectin expression levels were monitored by qPCR. The expression of adiponectin (an adipocyte marker) was undetectable in preadipocytes, and progressively increased from day 2 to day 6 after induction (Figure 1A). By contrast, Snail1 expression increased to the highest levels on day 2, and gradually declined between day 2 and day 6 after induction (Figure 1A). Insulin stimulation significantly increased Snail1 mRNA levels in 3T3-L1 preadipocytes and adipocytes (Figure 1B), and in human adipose stem cell-derived adipocytes (Figure 1C). Insulin receptor levels are higher in adipocytes than in preadipocytes, potentially explaining the increased ability of insulin to stimulate Snail1 expression in adipocytes. As expected, insulin stimulated phosphorylation of Akt and GSK3α/β while markedly increasing Snail1 protein in a time- and dose-dependent manner (Figure 1D and Figure S1A). Similarly, insulin stimulation increased Snail1 levels in mouse primary adipocytes (Figure 1D) and human adipose stem cell-derived adipocytes (Figure 1F and Figure S1B). To gain insight into signaling pathways mediating insulin action, 3T3-L1 adipocytes were pretreated with Wortmannin (PI 3-kinase inhibitor), LY294002 (PI 3-kinase inhibitor), or PD98059 (MEK inhibitor). Both Wortmannin and LY294002, but not PD98059, blocked the ability of insulin to increase Snail1 levels (Figure 1G), indicating that PI 3-kinase activity is required for insulin-stimulated Snail1 induction. To determine whether insulin increases adipose Snail1 expression in vivo, mice were fasted for 24 h and then refed for 3 h. Plasma insulin levels were lower in the fasted group than in the fed or refed group; accordingly, Snail1 expression in epididymal WAT (eWAT) was significantly lower in fasted mice relative to fed or refed mice (Figure 1H). Similarly, when mice were fasted overnight and intraperitoneally injected with insulin, Snail1 protein (Figure 1I) and mRNA (Figure S1C) levels increased in eWAT. Thus, insulin potently stimulates expression of adipose Snail1 both in vitro and in vivo.
Figure 1. Insulin stimulates Snail1 expression in both mouse and human adipocytes.
A. 3T3-L1 preadipocytes differentiated into adipocytes. Snail1 and adiponectin mRNA levels were measured by qPCR and normalized to 36B4 expression. n=6. B. 3T3-L1 preadipocytes and adipocytes were treated with insulin (100 nM) for 48 h. Snail1 expression was measured by qPCR and normalized to 36B4 expression. n=4. C. Human adipose stem cells differentiated into adipocytes and stimulated with insulin (100 nM) for 5 h. Snail1 mRNA levels were measured by qPCR and normalized to GAPDH levels. n=3. D. 3T3-L1 adipocytes were stimulated with insulin (100 nM) for 0-120 min. Cell extracts were immunoblotted with antibodies against Snail1, phospho-Akt (pSer473), Akt, phospho-GSK3α/β (pSer21/9), GSK3α/β, or tubulin. E. Primary adipocytes were prepared from mouse eWAT and stimulated with 100 nM insulin for 2 h. Cell extracts were immunoblotted with the indicated antibodies. F. Human adipose stem cells differentiated into adipocytes and stimulated with insulin (100 nM) for 5 h. Cell extracts were immunoblotted with the indicated antibodies. G. 3T3-L1 adipocytes were pretreated with Wortmannin (100 nM), LY294002 (10 μM), or PD98059 (50 μM) for 30 min, and then stimulated with insulin (100 nM) for additional 2 h. Cell extracts were immunoblotted with the indicated antibodies. H. C57BL males (9 weeks) were randomly fed (n=7), fasted for 24 h (n=8), or refed for 3 h after 24 h of fasting (n=8). Plasma insulin levels and Snail1 mRNA levels in eWAT (normalized to 36B4 levels) were measured. I. C57BL males (12 weeks) were fasted overnight and treated with insulin (2 units/kg body weight, i.p.) for 2 h or 4 h. eWAT extracts were immunoblotted with the indicated antibodies, and Snail1 protein levels (normalized to tubulin levels) and Akt phosphorylation (normalized to total Akt levels) were quantified. The values are mean ± sem. *p<0.05.
Snail1 cell-autonomously suppresses adipose lipolysis
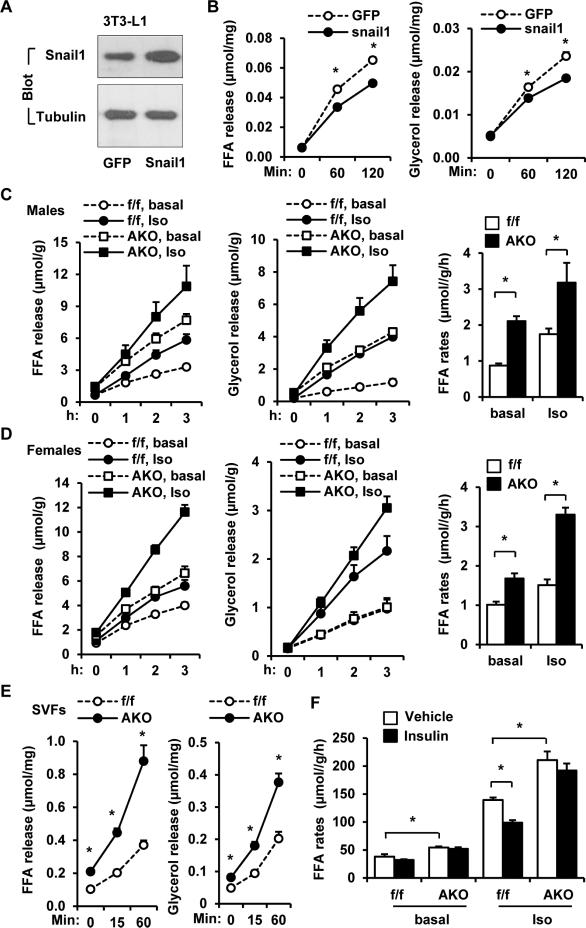
To determine whether Snail1 is involved in mediating insulin action, 3T3-L1 adipocytes were transduced with Snail1 or green fluorescent protein (GFP; control) adenoviral expression vectors. With an infection efficiency of ~50%, Snail1 levels were increased modestly (Figure 2A). The transduced adipocytes were then stimulated with isoproterenol (β adrenergic receptor agonist) 2 days after infection, and lipolysis was examined by measuring release of FFAs and glycerol. Under these conditions, Snail1 overexpression significantly inhibited isoproterenol-stimulated lipolysis (Figure 2B).
Figure 2. Snail1 suppresses adipocyte lipolysis.
A-B. 3T3-L1 adipocytes were infected with Snail1 or GFP adenoviruses for 2 days. A. Cell extracts were immunoblotted with antibodies against Snail1 or tubulin. B. Adipocytes were stimulated with isoproterenol (1 μM), and FFA and glycerol releases were measured (normalized to protein levels). n=3. C-D. Gonadal WAT explants were prepared from male (12 weeks) (AKO: n=3; Snail1flox/flox: n=5) and female (20 weeks, n=4) mice, and stimulated with or without isoproterenol (1 μM). FFA and glycerol release rates were measured (normalized to protein levels). FFA release rates (curve slopes) were calculated. E. SVFs were prepared eWAT, differentiated into adipocytes, and stimulated with isoproterenol (1 μM). FFA and glycerol release rates were measured. n=6. F. EMSCs were isolated from Snail1flox/flox and AKO males, differentiated to adipocytes, and stimulated with PBS vehicle or insulin (100 nM for 6 h) in the absence (basal) or presence of isoproterenol (0.1 μM). FFA release rates were measured (normalized to protein levels). The values are mean ± sem. *p<0.05.
To next assess the degree to which endogenous Snail1 regulates lipolysis, we generated adipocyte-specific Snail1 knockout (AKO) mice (C57BL/6 background) by crossing Snail1flox/flox mice with adiponectin-Cre drivers (Eguchi et al., 2011; Rowe et al., 2009). Snail1 protein levels in eWAT were decreased in AKO mice relative to Snail1flox/flox mice (Figure S2A) with residual levels of Snail1 in AKO mice likely arising from stromal cell populations in which the Snail1 gene would remain intact. As expected, Snail1 was disrupted in WAT, but not liver or kidney in AKO mice (Figure S2B). Further, Slug/Snail2 expression was unaffected in Snail1-null adipose tissues (Figure S2C). To examine the impact of Snail1 deletion on lipolysis, eWAT was isolated from AKO and Snail1flox/flox mice and stimulated with isoproterenol. Both basal and isoproterenol-stimulated lipolysis rates were significantly higher in AKO males and females (Figure 2C-D). To further validate cell-autonomous suppression of lipolysis by Snail1, epididymal stromal vascular fractions (SVFs) were prepared from AKO and Snail1flox/flox mice and differentiated into adipocytes. Differentiation efficiency was similar between the AKO and Snail1flox/flox groups (Figure S2D). Again, both basal and isoproterenol-stimulated lipolysis rates were higher in the AKO than in the Snail1flox/flox groups (Figure 2E). To explore the possibility that Snail1 likewise mediates insulin-induced suppression of lipolysis, ear mesenchymal stem cells (EMSCs) were prepared from Snail1flox/flox and AKO mice, differentiated into adipocytes (differentiation efficiency ~50%), and stimulated with insulin in the presence of isoproterenol. While insulin suppressed isoproterenol-stimulated lipolysis in WT adipocytes, the deletion of Snail1 decreased the ability of insulin to suppress isoproterenol-stimulated lipolysis (Figure 2F). Hence, insulin suppresses adipose lipolysis, at least in part, by increasing adipocyte Snail1 levels.
Snail1 suppresses ATGL expression in adipocytes
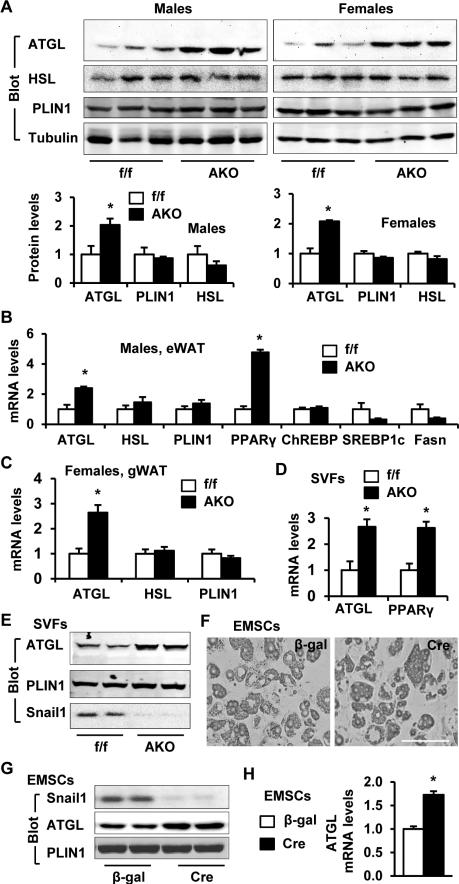
To gain insight into the potential mechanisms by which Snail1 suppresses lipolysis, we measured the levels of key proteins regulating lipolysis in eWAT. Interestingly, ATGL protein levels were markedly higher in AKO than in Snail1flox/flox males and females while hormone sensitive lipase (HSL) and perilipin-1 (PLIN1) levels were similar (Figure 3A). The mRNA levels of ATGL, but not PLIN1 or HSL, were also significantly higher in AKO mice (Figure 3B-C). Confirming previous reports that Snail1 inhibits PPARγ expression (Lee et al., 2013), PPARγ mRNA levels were also increased in AKO mice (Figure 3B). To confirm these findings in vitro, we next isolated AKO and Snail1flox/flox epididymal SVFs that were then differentiated into adipocytes. Under these conditions, both ATGL mRNA and protein levels were significantly higher in AKO relative to Snail1flox/flox adipocytes (Figure 3D-E). To further verify that Snail1 suppresses ATGL expression in a cell-autonomous fashion, we prepared EMSCs from Snail1flox/flox mice, differentiated the stem cells into adipocytes (Figure 3F), and then transduced the cells with Cre (to delete Snail1) or β-galactosidase (β-gal; control) adenoviruses. Following Cre-mediated excision of the Snail1 alleles, ATGL mRNA and protein levels were increased (Figure 3G-H). To assess the contribution of Snail1 to suppression of ATGL expression by insulin, we measured ATGL expression in SVF-derived adipocytes treated with or without insulin. In line with the above results, ATGL expression was higher in Snail1-deficient than in WT adipocytes under both basal and insulin-stimulated conditions; surprisingly, insulin failed to stimulate ATGL expression in either WT or Snail-null adipocytes under these conditions (Figure S2E). Taken together, the above results support a model wherein endogenous Snail1 inhibits lipolysis at least in part by directly suppressing ATGL expression.
Figure 3. Snail1 suppresses ATGL expression in adipocytes.
A-C. Gonadal WAT was prepared from AKO and Snail1flox/flox male (12 weeks) and female (20 weeks) mice. A. WAT extracts were immunoblotted with the indicated antibodies, and protein levels were quantified and normalized to tubulin levels. B-C. Gene expression (normalized to 36B4 expression) was measured by qPCR in males (AKO: n=3, Snail1flox/flox: n=5) and females (AKO: n=4, Snail1flox/flox: n=6). D-E. Epididymal SVFs differentiated into adipocytes. D. Gene expression (normalized to 36B4 expression) was measured by qPCR. n=6. E. Adipocyte extracts were immunoblotted with the indicated antibodies. F-H. EMSCs were isolated from Snail1flox/flox males, differentiated to adipocytes, and infected with Cre or β-gal adenoviruses for 2 days. F. Representative images of EMSC-derived adipocytes. Scale bar: 100 μm. G. Adipocyte extracts were immunoblotted with the indicated antibodies. H. ATGL expression (normalized to 36B4 expression) was measured by qPCR. n=4. The values are mean ± sem. *p<0.05.
Snail1 epigenetically represses the ATGL promoter
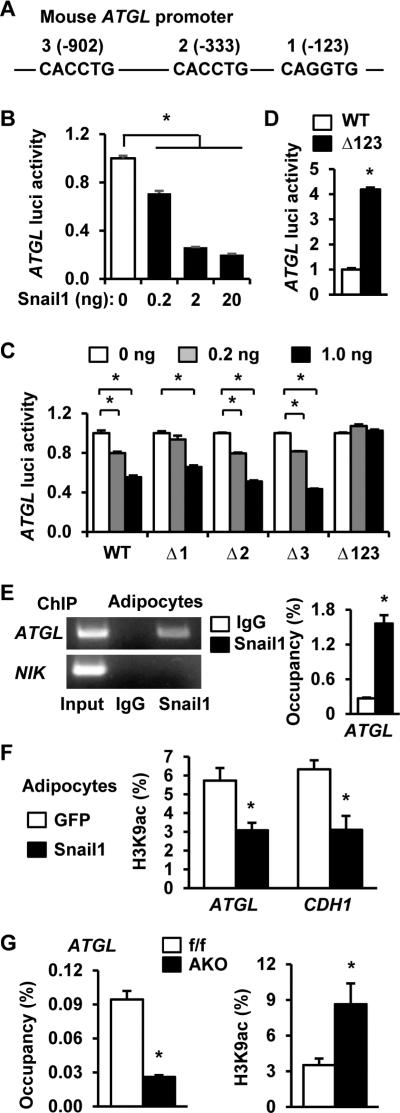
The mouse ATGL promoter contains three putative Snail1 binding sites (E2 boxes) that are conserved in humans (Figure 4A). Using mouse ATGL (from −987 to +71 bp) luciferase reporter plasmids, Snail1 dose-dependently repressed ATGL promoter activity (Figure 4B). When the 3 putative Snail1 binding sites were mutated individually (Δ1, Δ2, or Δ3) or in combination (Δ123), overexpression of Snail1 decreased Δ1, Δ2, and Δ3, but not Δ123, luciferase activities (Figure 4C), suggesting that each of the 3 sites is able to mediate Snail1 repression of the ATGL promoter. Further, Δ123 luciferase activities were significantly higher than WT ATGL luciferase activities in 3T3-L1 cells (Figure 4D), indicating that endogenous Snail1 likely represses the ATGL promoter through binding to these sites. Indeed, physical interactions between Snail1 and the ATGL promoter were confirmed using chromatin immunoprecipitation (ChIP) wherein Snail1 bound to the ATGL promoter, but not the NIK gene (negative controls), in 3T3-L1 adipocytes (Figure 4E).
Figure 4. Snail1 epigenetically represses the ATGL promoter.
A. A schematic representation of the mouse ATGL promoter (numbers: positions from the transcription start site). B. ATGL luciferase reporter plasmids were cotransfected with Snail1 expression vectors into HEK293 cells. Luciferase activities were measured 48 h after transfection and normalized to β-gal internal control. C. WT or mutant ATGL luciferase reporter plasmids were cotransfected with Snail1 plasmids into HEK293 cells, and luciferase activities were measured 48 h after transfection. D. WT or Δ123 ATGL luciferase reporter plasmids were transfected into 3T3-L preadipocytes. Luciferase activities were measured 48 h after transfection and normalized to β-gal internal control. E. ChIP assays were performed using 3T3-L1 adipocytes. Snail1 occupancy on the ATGL promoter (normalized to inputs) was quantified by qPCR. F. 3T3-L1 adipocytes were infected with Snail1 or GFP adenoviruses for 24 h. ATGL and CDH1 promoter H3K9 acetylation levels (normalized to inputs) were quantified by ChIP-qPCR. G. Gonadal WAT was isolated from Snail1flox/flox (n=3) and AKO (n=3) females fed a HFD for 8 weeks. Snail1 occupancy and H3K9 acetylation levels in the ATGL promoter were measured by ChIP-qPCR. The values are mean ± sem. *p<0.05.
Snail1 is known to repress target promoters through epigenetic modifications (Lin et al., 2014). Hence, 3T3-L1 adipocytes were transduced with Snail1 or GFP (control) adenoviruses, and H3K9 acetylation was measured by ChIP. Overexpression of Snail1 significantly reduced H3K9 acetylation levels in the promoter regions of ATGL as well as CDH1, a well-characterized Snail1 target (Figure 4F) (Lin et al., 2014). To confirm that endogenous Snail1 binds to the ATGL promoter and suppresses H3K9 acetylation, we measured Snail1 occupancy and H3K9 acetylation in the ATGL promoter of Snail1flox/flox versus AKO mice. In AKO eWAT, Snail1 occupancy on the ATGL promoter was significantly lower while H3K9 acetylation was significantly higher relative to Snail1flox/flox eWAT (Figure 4G). Taken together, these results are consistent with a model whereby Snail1 suppresses ATGL expression by epigenetically repressing the ATGL promoter.
Obesity is associated with increased expression of Snail1 in WAT
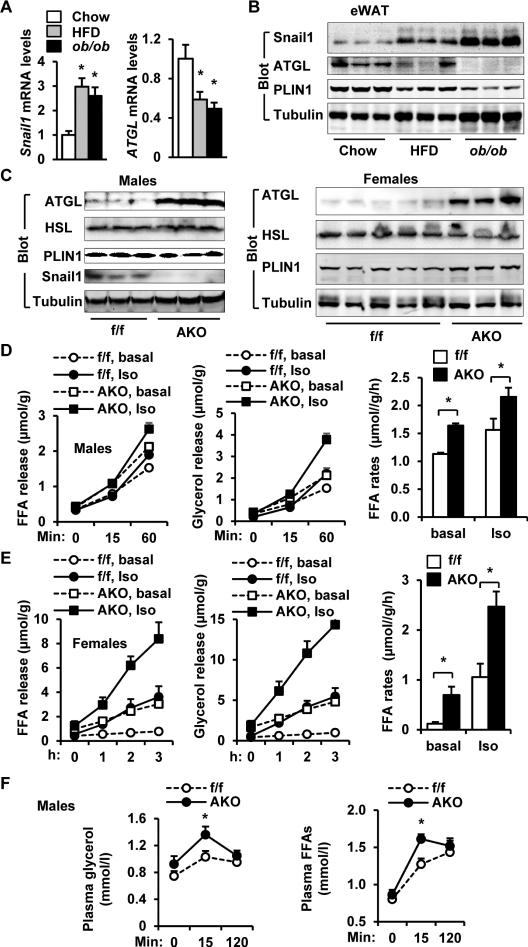
To assess the impact of obesogenic states on Snail1 expression, adipose tissue Snail1 levels were measured in mice either fed a HFD or rendered obese via genetic means (i.e., ob/ob). Snail1 mRNA levels in eWAT were significantly higher in both HFD-fed mice and ob/ob mice relative to wild type (WT) mice fed a standard chow diet (Figure 5A). Likewise, Snail1 protein levels were also higher in HFD-fed WT or ob/ob mice (Figure 5B and Figure S3A). As plasma insulin levels were significantly higher in HFD-fed mice or ob/ob mice relative to chow-fed mice (Figure S3B), adipose tissue Snail1 protein levels appeared to be positively correlated with plasma insulin levels (Figure S3C). Given that obesity is known to induce insulin resistance selectively in gluconeogenic but not lipogenic pathways (Li et al., 2010), the insulin-Snail1 pathway may also remain relatively intact in obesity, thereby allowing obesity-associated hyperinsulinemia to increase Snail1 expression levels in adipose tissues.
Figure 5. Adipocyte Snail1 mediates downregulation of adipose ATGL in obesity.
A-B. C57BL male mice (7 weeks) were fed a standard chow diet or a HFD for 13-14 weeks; ob/ob male mice were fed a normal chow diet. A. Snail1 and ATGL expression (normalized to 36B4 expression) was measured in eWAT by qPCR. Chow: n=5, HFD: n=6, ob/ob: n=4. B. eWAT extracts were immunoblotted with the indicated antibodies. C. AKO and Snail1flox/flox mice were fed a HFD for 8 weeks (females) or 30 weeks (males). Gonadal WAT extracts were immunoblotted with the indicated antibodies. D-E. AKO and Snail1flox/flox mice were fed a HFD for 8 weeks (females) or 20 weeks (males). Gonadal WAT explants were stimulated with isoproterenol (1 μM), and FFAs and glycerol release was measured (normalized to protein levels). AKO males: n=6, Snail1flox/flox males: n=6, AKO females: n=3, Snail1flox/flox females: n=5. F. AKO and Snail1flox/flox male mice (7 weeks) were fed a HFD for 20 weeks, and injected with CL316243 (1 mg/kg body weight). Plasma FFA and glycerol levels were measured. n=11. The values are mean ± sem. *p<0.05.
Adipose Snail1 mediates downregulation of adipose ATGL in obesity
Confirming earlier studies, ATGL mRNA and protein levels were lower in the eWAT of HFD-fed mice and ob/ob mice relative to WT mice fed a normal chow diet (Figure 5A-B) (Kim et al., 2006; Villena et al., 2004). As ATGL expression was inversely correlated with Snail1 expression in eWAT, we sought to determine whether the in vivo deletion of adipose Snail1 might reverse the obesity-associated downregulation of ATGL. As such, AKO and Snail1flox/flox mice were fed a HFD, and ATGL levels were measured in gonadal WAT by immunoblotting. Under these conditions, ATGL, but not HSL or PLIN1, levels were markedly higher in both AKO males and females relative to Snail1flox/flox males and females, respectively (Figure 5C and Figure S4A). Deletion of adipocyte Snail1 fully reversed HFD-induced reduction in adipose ATGL (Figure S4B). In agreement with these results, both basal and isoproterenol-stimulated lipolysis rates of gonadal WAT explants were also significantly higher in AKO males and females relative to Snail1flox/flox mice (Figure 5D-E). Basal lipolysis rates were very low in obese Snail1flox/flox female mice under these conditions. We also measured CL316243 (β3 adrenergic receptor agonist) stimulated lipolysis in mice fed a HFD, where blood FFA as well as glycerol levels were significantly higher in AKO mice relative to Snail1flox/flox mice 15 min after CL316243 stimulation (Figure 5F). To corroborate these findings, we assessed fasting-stimulated lipolysis in mice fed a HFD for 2 weeks. Blood FFA levels, after normalization to fat mass, were higher in AKO than in Snail1flox/flox mice under fasted conditions, and remained higher in AKO mice after refeeding (Figure S5A). Fasting-induced increase in blood FFAs were also higher in AKO mice relative to Snail1flox/flox mice (Figure S5A). However, the differences were not statistically significant, presumably due to a small sample size (AKO: n=4; Snail1flox/flox: n=8). Together, these results demonstrate that obesity-associated factors, including hyperinsulinemia, increase the levels of adipose Snail1 which in turn suppress ATGL expression.
Deletion of adipose Snail1 decreases WAT mass and white adipocyte size in mice
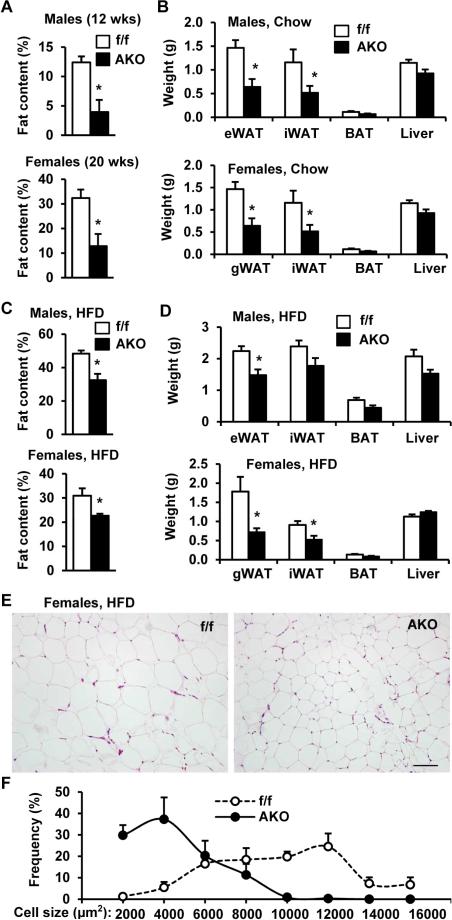
While body weight, food intake, O2 consumption, and CO2 production were similar between AKO and Snail1flox/flox male or female mice (Figure S5B-D), whole body fat content and WAT weight were significantly lower in both AKO males and females relative to Snail1flox/flox controls on a normal chow diet (Figure 6A-B). Fat content and WAT weight were also significantly lower in HFD-fed AKO males and females relative to HFD-fed Snail1flox/flox mice (Figure 6C-D). The size of individual white adipocytes was smaller in AKO than in Snail1flox/flox mice (Figure 6E-F), suggesting that adipocyte Snail1 is a determinant of adipocyte capacity to store TAG. Nevertheless, insulin tolerance and glucose tolerance were similar between Snail1flox/flox and AKO mice fed either a normal chow diet or a HFD (Figure S6). Hence, adipose Snail1 regulates adipocyte size and whole body fat content, most likely in a process linked to the suppression of ATGL-mediated lipolysis.
Figure 6. Adipocyte-specific deletion of Snail1 decreases adiposity and white adipocyte size.
A-B. Fat content and tissue weights in male (8 weeks) and female (20 weeks) mice fed a normal chow diet. gWAT: gonadal WAT. n=6. C-D. Fat content and tissue weights in mice fed a HFD for 8 weeks (females) or 30 weeks (males). n=6. E-F. Females were fed a HFD for 8 weeks. E. H&E staining of gWAT. Scale bar: 100 μm. F. Adipocyte sizes were calculated and presented as % of total cell number. n=3. The values are mean ± sem. *p<0.05.
Adipocyte-specific deletion of Snail1 increases liver fat content in mice fed either a normal chow diet or a HFD
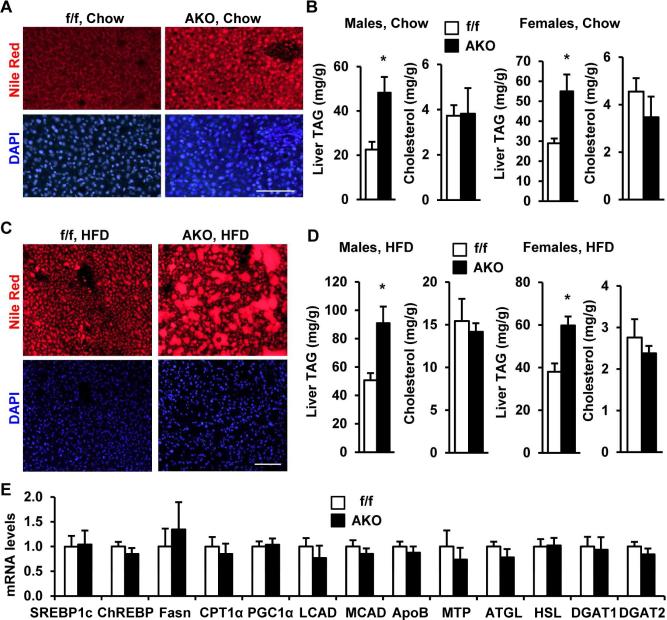
Given the demonstrated ability of endogenous Snail1 to repress ATGL expression in vivo, the impact of Snail1 deletion on hepatic lipid deposition was assessed. When visualized by Nile red staining, both LD number and size were increased in AKO mice fed a normal chow diet (Figure 7A). Further, liver TAG levels were also significantly higher in both AKO males and females relative to Snail1flox/flox males and females, respectively, while liver cholesterol levels were similar (Figure 7B). Deletion of adipose Snail1 also markedly exacerbated HFD-induced hepatic steatosis in both AKO males and females (Figure 7C-D). By contrast, plasma, skeletal muscle, and kidney TAG levels were similar between Snail1flox/flox and AKO mice (Figure S4C-D). Further, the expression of hepatic genes known to stimulate lipogenesis (e.g. SREBP1c, ChREBP, and Fasn), TAG synthesis (e.g. DGAT1 and DGAT2), lipolysis (e.g. ATGL and HSL), fatty acid β oxidation (e.g. CPT1, PGC1α, LCAD and MCAD), and VLDL secretion (e.g. ApoB and MTP), was similar between AKO and Snail1flox/flox mice (Figure 7E). As expected, no differences in liver ATGL or Snail1 protein levels were detected between Snail1flox/flox and AKO mice (Figure S4E). Together, these data suggest that loss of adipocyte Snail1 leads to liver steatosis as a consequence of increased adipose lipolysis and subsequent mobilization of fatty acids from adipose tissue to the liver.
Figure 7. Adipocyte-specific deletion of Snail1 promotes hepatic steatosis.
A-B. Mice (8 weeks) were fed a normal chow diet. A. Nile red staining of male liver sections (overnight fasting). Scale bar: 100 μm. B. Liver TAG and cholesterol levels (normalized to liver weight). AKO males: n=3, Snail1flox/flox males: n=5, AKO females: n=7, Snail1flox/flox females: n=7. C-D. Mice were fed a HFD for 8 weeks (females) or 30 weeks (males). C. Nile red staining of male liver sections (overnight fasting). Scale bar: 100 μm. D. Liver TAG and cholesterol levels (normalized to liver weight). AKO (n=17) and Snail1flox/flox (n=19) males were fasted for 24 h; AKO (n=3) and Snail1flox/flox (n=6) females were randomly fed. E. Gene expression (normalized to 36B4 expression) was measured in the liver by qPCR. The values are mean ± sem. *p<0.05.
Discussion
Herein, we have identified a previously-unknown Snail1-ATGL axis that controls adipocyte size and adiposity while playing an equally important role in fatty acid partitioning between adipose tissue and the liver.
Insulin is an essential anabolic hormone that increases adipose TAG storage, in part by suppressing ATGL-mediated lipolysis. While multiple mechanisms likely allow insulin to control ATGL expression, we observed that adipose Snail1 levels positively correlated with insulin levels and body weights. Consistent with this finding, insulin stimulation increased Snail1 mRNA and protein levels in both mouse adipocytes and eWAT as well as human adipose stem cell-derived adipocytes. In addition to stimulating Snail1 expression, insulin may also increase Snail1 protein stability by suppressing GSK3α/β as these kinases can directly phosphorylate Snail1, thereby promoting its ubiquitination and degradation (Yook et al., 2005; Zhou et al., 2004). Further, we found that Snail1 bound to the ATGL promoter, and directly suppressed ATGL expression, at least in part by eliciting repressive epigenetic modifications of the ATGL promoter. As Snail1 overexpression decreased lipolysis in adipocytes while adipocyte-specific deletion of Snail1 markedly increased lipolysis, Snail1-dependent epigenetic reprograming of ATGL, and possibly additional metabolic gene products, likely impacts the regulation of lipolysis in chronic overnutrition states. Thus, our findings define a previously-unknown adipose tissue insulin-Snail1-ATGL-lipolysis axis that operates to control metabolic regulation in vivo.
We also observed that Snail1 suppressed the expression of PPARγ, conforming the previous findings (Lee et al., 2013). PPARγ is known to stimulate ATGL expression (Kershaw et al., 2006; Kim et al., 2006), raising the possibility that adipose Snail1 may inhibit ATGL expression indirectly via regulating PPARγ. Additionally, it may also regulate other aspects of adipose metabolism through PPARγ. As FoxO1 and Egr1 have been reported to bind to the ATGL promoter and participate in mediating insulin suppression of ATGL expression (Bartness et al., 2014; Chakrabarti and Kandror, 2009; Chakrabarti et al., 2013), insulin may suppress ATGL expression by multiple pathways. While additional studies are needed to determine the relative contributions of Snail1, PPARγ, FoxO1, and Egr1 pathways in regulating ATGL expression and lipolysis, particularly in the setting of obesity, our studies directly define a key role for adipocyte Snail1 in regulating ATGL activity in vitro as well as in vivo.
The Snail1-ATGL-lipolysis axis characterized herein is required for the maintenance of normal adipocyte size and adiposity. Adipocyte-specific deletion of Snail1 resulted in a reduction in both adipocyte size and whole body fat mass in mice, accompanied by increased ATGL-mediated lipolysis. Adipose Snail1 levels were higher in obesity and inversely correlated with ATGL expression, suggesting that elevated adipose Snail1 levels promote adipocyte hypertrophy in obesity at least in part by inhibiting ATGL expression. WAT-derived FFAs are believed to be an important lipid source for liver steatosis during NAFLD progression (Schoiswohl et al., 2015; Wilson et al., 2016), and in this regard, it is noteworthy that AKO mice displayed spontaneous lipid accumulation in the liver while the severity of HFD-induced liver steatosis was increased in AKO mice. These observations demonstrate that the adipose Snail1-ATGL-lipolysis axis plays a critical role in the maintenance of normal lipid partitioning between WAT and the liver. By suppressing ATGL expression, Snail1 increases TAG storage capacity of WAT while decreasing FFA release, thereby protecting against improper lipid partitioning, ectopic lipid accumulation, and lipotoxicity in non-adipose tissues.
The role of adipose ATGL in glucose metabolism is complex, as revealed by the observations that both adipocyte-specific overexpression and deletion of ATGL similarly improve insulin resistance and glucose intolerance in mice (Ahmadian et al., 2009; Schoiswohl et al., 2015). We did not, however, detect differences in glucose and insulin tolerance between AKO and Snail1f/f mice fed either a normal chow diet or a HFD. Thus, additional studies are warranted to examine the role of Snail1 in glucose metabolism. Nevertheless, our findings highlight a heretofore unrecognized ability of adipose Snail1 to act as a molecular brake that serves to regulate lipolysis and fatty acid mobilization between adipose and non-adipose tissues.
Experimental Procedures
Animals
Animal experiments were conducted following the protocols approved by the University of Michigan Institutional Animal Care and Use Committee (IACUC). Mice were housed on a 12-h light/12-h dark cycle in the Unit for Laboratory Animal Medicine at the University of Michigan (ULAM), and fed either a standard chow diet (9% fat; Lab Diet) or a HFD (60% fat; Research Diets).
Plasma FFA, glycerol, and insulin levels
Mice were fasted overnight or injected intraperitoneally with CL316243. Blood samples were collected from tail veins. Plasma FFA and glycerol levels were measured using NEFA-HR reagents (Wako Chemicals, Richmond, VA) and Free Glycerol Reagents (Sigma, F6428), respectively. Insulin levels were measured using a rat insulin ELISA kit (Crystal Chem Inc., Downers Grove, IL).
Preparation of EMSCs, SVFs, and primary adipocytes
Ears were pooled from 3 mice, submerged in 70% ethanol for 2 min, washed with sterile Hanks' Balanced Salt Solution (HBSS; Invitrogen, 14025-092), and minced into small pieces in sterile HBSS supplemented with collagenase type II (1.66 mg/ml). Ear tissues were digested for 1 h at 37 °C, filtered through 70 μm cell strainer (BD Biosciences, 352350), and centrifuged at 1350 rpm for 8 min. Cell pellets were resuspended in red blood cell lysing buffer (Sigma) and centrifuged again. EMSCs (cell pellets) were resuspended and grown in DMEM/F12 (Invitrogen, 11330-032) supplemented with 10% fetal bovine serum (FBS) and 0.2% primocin (Invivogen).
eWAT was minced in PBS containing 10 mM CaCl2, and digested at 37 °C for 20 min in PBS containing 10 mM CaCl2, 1.5 units/ml collagenase D (Roche, 11088882001), and 2.4 units/ml dispase II (Roche, 4942078001). Tissue suspensions were filtered through a 100 μm filter and centrifuged at 200 g for 5 min. Primary adipocytes (top floating fractions) and SVFs (pellets) were collected. SVFs were resuspended and washed in PBS containing 10 mM CaCl2 and 2% fetal bovine serum, and grown in DMEM containing 25 mM glucose and 10% FBS.
Adipocyte differentiation
3T3-L1 preadipocytes were maintained at 5% CO2 and 37 °C in DMEM containing 25 mM glucose and 8% calf serum. Confluent 3T3-L1 preadipocytes, EMSCs, or SVFs were grown for additional 2 days, and then cultured in a differentiation cocktail: DMEM (3T3-L1) or DMEM/F12 (EMSCs and SVFs) containing 25 mM glucose, 10% FBS, 0.1 μM insulin, 1 μM dexamethasone (Sigma, D-1756), 0.5 mM 3-isobutyl-1-methylxanthine (IBMX; Sigma, I-5879), and 0.1 μM rosiglitazone (Cayman Chemical Company, Ann Arbor, Michigan). Two days later, the cells were grown in DMEM (3T3-L1) or DMEM/F12 (SVFs) supplemented with 10% FBS and 0.1 μM insulin for additional 2 days, and then maintained in DMEM (3T3-L1) or DMEM/F12 (SVFs) containing 10% FBS.
Human adipose stem cells (#hASC-01) were purchased from the LaCell LLC (New Orleans, LA) and grown in Stromal Medium (LaSM) (LaCell LLC). Confluent cells were grown for 3 days in a differentiation medium (DMEM/F12 supplemented with 3% FBS, 0.5 mM IBMX, 1 μM dexamethasone, 200 nM insulin, 5 μM rosiglitazone, 33 μM biotin, and 17 μM d-pantothenate), and then in a maintenance medium (DMEM/F12 supplemented with 3% FBS, 1 μM dexamethasone, 200 nM insulin, 33 μM biotin, and 17 μM d-pantothenate) for additional 6 days. Human adipocytes were starved for 16 h in DMEM/F12 supplemented with 0.6% BSA, and then stimulated with insulin (100 nM) for 5 h.
Lipolysis assays
eWAT was minced into small pieces (1-2 mm) in cold PBS. Fat explants (5-6 pieces) were incubated at 37 °C for 2 h in KRH buffer (136 mM NaCl, 4.7 mM KCl, 1.25 mM MgSO4, 1.25 mM CaCl2, 20 mM Hepes, pH 7.4, and 2% BSA), and then stimulated with isoproterenol (1 μM). 3T3-L1, EMSC-derived, or SVF-derived adipocytes were incubated in KRH buffer for 3 h and then stimulated with isoproterenol (1 μM). FFA and glycerol, which were released from adipocytes into KRH buffer, were measured and normalized to total adipocyte protein levels.
Liver TAG and cholesterol levels
Liver samples were homogenized in 1% acetic acid and extracted using 80% chloroform:methanol (2:1). Lipids (organic phase) were transferred to a new tube, dried by evaporation in a chemical hood, resuspended in 3 M KOH, incubated at 70 °C for 1 h, mixed with MgCl2 (0.75 M), and centrifuged. The aqueous fractions were used to measure TAG levels using Free Glycerol Reagents (Sigma, F6428). Liver lipids were suspended in isopropanol and used to measure cholesterol using a kit (Pointe Scientific Inc., Canton, MI, C7510).
ATGL luciferase reporter assays
The murine ATGL promoter (from −985 to +71) was prepared by PCR (forward primer: 5’-AGTGCCTCTCATGTATGCTTAA-3’, and reverse primer: 5’-TCCCGCAGTCTCGATACCTTGG-3’) and inserted into pGL3 vectors at Xho I and Hind III sites. The 3 putative Snail1 binding sites were replaced with “CTAATG” to generate Δ1, Δ2, Δ3, or Δ123 luciferase reporters, using site-directed mutagenesis kits (Stratagene, La Jolla, CA). ATGL luciferase reporter plasmids were cotransfected with Snail1 expression vectors into HEK293 or 3T3-L1 cells (Jiang et al., 2015). Luciferase activities were measured 48 h after transfection using a kit (Progema, Madison, WI), and normalized to the activities of coexpressed β-gal (internal control).
Chromatin immunoprecipitation (ChIP)
3T3-L1 adipocytes were treated with 1% formaldehyde for 15 min and lyzed in a lysis buffer (1% SDS 5 mM EDTA, 50 mM Tris-HCl, protease inhibitor cocktail, pH 7.9). Genomic DNA was sheared to 200-1000 bp fragments using a soinic dismenbrator (Model Q800R, QSONICA). Female mice (12 weeks) were fed a HFD for 8 weeks. Gonadal WAT (200 mg) was isolated, minced on ice, and incubated with 1.5% formaldehyde for 20 min. WAT was homogenized in hypotonic buffer (20 mM Hepes, 1 mM EDTA, 1 mM EGTA,0.2% Triton X-100, protease inhibitor cocktail, pH 7.9). Nuclei were isolated by centrifugation (13500 rpm for 30 seconds), and genomic DNA was sheared to 200-1000 bp fragments. DNA-protein complexes were immunoprecipitated with antibody against Snail1 or H3K9ac or normal rabbit IgG (control). DNA was purified after reversing crosslink and used to measure Snail1 occupancy and H3K9ac levels in the ATGL promoter using qPCR. Antibodies and primers were listed in Tables S1 and S2, respectively.
Immunoblotting
Tissues or cells were homogenized in a lysis buffer (50 mM Tris HCl, pH 7.5, 1.0% NP-40, 150 mM NaCl, 2 mM EGTA, 1 mM Na3VO4, 100 mM NaF, 10 mM Na4P2O7, 1 mM PMSF, 10 μg/ml aprotinin, 10 μg/ml leupeptin) (Chen et al., 2012). Tissue or cell extracts were immunoblotted with the indicated antibodies. Antibodies were listed in Table S1.
Quantitative real time PCR (qPCR) analysis
Total RNAs were extracted using TRIzol reagent (Invitrogen life technologies, Carlsbad, CA). The first-strand cDNAs were synthesized using random primers and M-MLV reverse transcriptase (Promega, Madison, WI). The abundance of mRNA was measured using Radiant™ SYBR Green 2X Hi-ROX qPCR kits (Alkali Scientific, Pompano Beach, FL) and Mx3000P real-time PCR system (Stratagene, LA Jolla, CA). Primers were listed in Table S2.
Nile red staining
Liver frozen sections (7 μm) were prepared using a Leica cryostat (Leica Biosystems Nussloch GmbH, Nussloch, Germany), fixed in 4% paraformaldehyde for 30 min, stained with Nile red, and visualized using a BX51 microscope equipped with a DP72 Digital Camera (Olympus, Tokyo, Japan).
Statistical Analysis
Data were presented as means ± sem. Differences between groups were analyzed by two-tailed Student's t tests. P< 0.05 was considered statistically significant.
Supplementary Material
Highlights.
Insulin increases Snail1 levels in white adipocytes
Snail1 represses ATGL expression and suppresses lipolysis
Adipocyte-specific deletion of Snail1 decreases adipocyte size and adiposity
Adipocyte-specific deletion of Snail1 promotes liver steatosis in mice
Acknowledgements
We thank Drs. Yi Xiong, Mark J. Canet, Bijie Jiang, Lei Yin, and Ormond MacDougald for assistance and discussion. This study was supported by grants DK091591 and DK094014 from the National Institutes of Health (to LR) and by grant 31470798 from the National Natural Science Foundation of China (to YZ). This work utilized the cores supported by the Michigan Diabetes Research and Training Center (NIH DK20572), the University of Michigan's Cancer Center (NIH CA46592), the University of Michigan Nathan Shock Center (NIH P30AG013283), and the University of Michigan Gut Peptide Research Center (NIH DK34933).
Footnotes
Publisher's Disclaimer: This is a PDF file of an unedited manuscript that has been accepted for publication. As a service to our customers we are providing this early version of the manuscript. The manuscript will undergo copyediting, typesetting, and review of the resulting proof before it is published in its final citable form. Please note that during the production process errors may be discovered which could affect the content, and all legal disclaimers that apply to the journal pertain.
Disclosure Statement: All authors have nothing to declare.
Author Contributions
C.S., H.S., L.J., and Y.L. conducted the experiments, C.S., L.J. and L.R. designed the experiments and wrote the paper, and C.S., H.S., L.J., L.R., S.J.W., Y.L. and Y.Z. performed data analysis and edited the paper. C.S. and L.J. contributed equally to this work.
References
- Ahmadian M, Abbott MJ, Tang T, Hudak CS, Kim Y, Bruss M, Hellerstein MK, Lee HY, Samuel VT, Shulman GI, et al. Desnutrin/ATGL is regulated by AMPK and is required for a brown adipose phenotype. Cell Metab. 2011;13:739–748. doi: 10.1016/j.cmet.2011.05.002. [DOI] [PMC free article] [PubMed] [Google Scholar]
- Ahmadian M, Duncan RE, Varady KA, Frasson D, Hellerstein MK, Birkenfeld AL, Samuel VT, Shulman GI, Wang Y, Kang C, et al. Adipose overexpression of desnutrin promotes fatty acid use and attenuates diet-induced obesity. Diabetes. 2009;58:855–866. doi: 10.2337/db08-1644. [DOI] [PMC free article] [PubMed] [Google Scholar]
- Bartness TJ, Liu Y, Shrestha YB, Ryu V. Neural innervation of white adipose tissue and the control of lipolysis. Frontiers in neuroendocrinology. 2014 doi: 10.1016/j.yfrne.2014.04.001. [DOI] [PMC free article] [PubMed] [Google Scholar]
- Batlle R, Alba-Castellon L, Loubat-Casanovas J, Armenteros E, Franci C, Stanisavljevic J, Banderas R, Martin-Caballero J, Bonilla F, Baulida J, et al. Snail1 controls TGF-beta responsiveness and differentiation of mesenchymal stem cells. Oncogene. 2013;32:3381–3389. doi: 10.1038/onc.2012.342. [DOI] [PMC free article] [PubMed] [Google Scholar]
- Berggreen C, Gormand A, Omar B, Degerman E, Goransson O. Protein kinase B activity is required for the effects of insulin on lipid metabolism in adipocytes. Am J Physiol Endocrinol Metab. 2009;296:E635–646. doi: 10.1152/ajpendo.90596.2008. [DOI] [PubMed] [Google Scholar]
- Bezaire V, Mairal A, Ribet C, Lefort C, Girousse A, Jocken J, Laurencikiene J, Anesia R, Rodriguez AM, Ryden M, et al. Contribution of adipose triglyceride lipase and hormone-sensitive lipase to lipolysis in hMADS adipocytes. J Biol Chem. 2009;284:18282–18291. doi: 10.1074/jbc.M109.008631. [DOI] [PMC free article] [PubMed] [Google Scholar]
- Carver EA, Jiang R, Lan Y, Oram KF, Gridley T. The mouse snail gene encodes a key regulator of the epithelial-mesenchymal transition. Mol Cell Biol. 2001;21:8184–8188. doi: 10.1128/MCB.21.23.8184-8188.2001. [DOI] [PMC free article] [PubMed] [Google Scholar]
- Chakrabarti P, Kandror KV. FoxO1 controls insulin-dependent adipose triglyceride lipase (ATGL) expression and lipolysis in adipocytes. J Biol Chem. 2009;284:13296–13300. doi: 10.1074/jbc.C800241200. [DOI] [PMC free article] [PubMed] [Google Scholar]
- Chakrabarti P, Kim JY, Singh M, Shin YK, Kim J, Kumbrink J, Wu Y, Lee MJ, Kirsch KH, Fried SK, et al. Insulin inhibits lipolysis in adipocytes via the evolutionarily conserved mTORC1-Egr1-ATGL-mediated pathway. Mol Cell Biol. 2013;33:3659–3666. doi: 10.1128/MCB.01584-12. [DOI] [PMC free article] [PubMed] [Google Scholar]
- Chen Z, Sheng L, Shen H, Zhao Y, Wang S, Brink R, Rui L. Hepatic TRAF2 regulates glucose metabolism through enhancing glucagon responses. Diabetes. 2012;61:566–573. doi: 10.2337/db11-0474. [DOI] [PMC free article] [PubMed] [Google Scholar]
- Degerman E, Landstrom TR, Wijkander J, Holst LS, Ahmad F, Belfrage P, Manganiello V. Phosphorylation and activation of hormone-sensitive adipocyte phosphodiesterase type 3B. Methods. 1998;14:43–53. doi: 10.1006/meth.1997.0564. [DOI] [PubMed] [Google Scholar]
- DiPilato LM, Ahmad F, Harms M, Seale P, Manganiello V, Birnbaum MJ. The Role of PDE3B Phosphorylation in the Inhibition of Lipolysis by Insulin. Mol Cell Biol. 2015;35:2752–2760. doi: 10.1128/MCB.00422-15. [DOI] [PMC free article] [PubMed] [Google Scholar]
- Dong C, Wu Y, Wang Y, Wang C, Kang T, Rychahou PG, Chi YI, Evers BM, Zhou BP. Interaction with Suv39H1 is critical for Snail-mediated E-cadherin repression in breast cancer. Oncogene. 2013a;32:1351–1362. doi: 10.1038/onc.2012.169. [DOI] [PMC free article] [PubMed] [Google Scholar]
- Dong C, Yuan T, Wu Y, Wang Y, Fan TW, Miriyala S, Lin Y, Yao J, Shi J, Kang T, et al. Loss of FBP1 by Snail-mediated repression provides metabolic advantages in basal-like breast cancer. Cancer cell. 2013b;23:316–331. doi: 10.1016/j.ccr.2013.01.022. [DOI] [PMC free article] [PubMed] [Google Scholar]
- Eguchi J, Wang X, Yu S, Kershaw EE, Chiu PC, Dushay J, Estall JL, Klein U, Maratos-Flier E, Rosen ED. Transcriptional control of adipose lipid handling by IRF4. Cell Metab. 2011;13:249–259. doi: 10.1016/j.cmet.2011.02.005. [DOI] [PMC free article] [PubMed] [Google Scholar]
- Fuchs CD, Claudel T, Trauner M. Role of metabolic lipases and lipolytic metabolites in the pathogenesis of NAFLD. Trends in endocrinology and metabolism: TEM. 2014;25:576–585. doi: 10.1016/j.tem.2014.08.001. [DOI] [PubMed] [Google Scholar]
- Granneman JG, Moore HP, Krishnamoorthy R, Rathod M. Perilipin controls lipolysis by regulating the interactions of AB-hydrolase containing 5 (Abhd5) and adipose triglyceride lipase (Atgl). J Biol Chem. 2009;284:34538–34544. doi: 10.1074/jbc.M109.068478. [DOI] [PMC free article] [PubMed] [Google Scholar]
- Haemmerle G, Lass A, Zimmermann R, Gorkiewicz G, Meyer C, Rozman J, Heldmaier G, Maier R, Theussl C, Eder S, et al. Defective Lipolysis and Altered Energy Metabolism in Mice Lacking Adipose Triglyceride Lipase 10.1126/science.1123965. Science. 2006;312:734–737. doi: 10.1126/science.1123965. [DOI] [PubMed] [Google Scholar]
- Herranz N, Pasini D, Diaz VM, Franci C, Gutierrez A, Dave N, Escriva M, Hernandez-Munoz I, Di Croce L, Helin K, et al. Polycomb complex 2 is required for E-cadherin repression by the Snail1 transcription factor. Mol Cell Biol. 2008;28:4772–4781. doi: 10.1128/MCB.00323-08. [DOI] [PMC free article] [PubMed] [Google Scholar]
- Jiang B, Shen H, Chen Z, Yin L, Zan L, Rui L. Carboxyl Terminus of HSC70-interacting Protein (CHIP) Down-regulates NF-kappaB-inducing Kinase (NIK) and Suppresses NIK-induced Liver Injury. J Biol Chem. 2015;290:11704–11714. doi: 10.1074/jbc.M114.635086. [DOI] [PMC free article] [PubMed] [Google Scholar]
- Jiang L, Xiao L, Sugiura H, Huang X, Ali A, Kuro OM, Deberardinis RJ, Boothman DA. Metabolic reprogramming during TGFbeta1-induced epithelial-to-mesenchymal transition. Oncogene. 2014;0 doi: 10.1038/onc.2014.321. [DOI] [PMC free article] [PubMed] [Google Scholar]
- Kershaw EE, Hamm JK, Verhagen LA, Peroni O, Katic M, Flier JS. Adipose triglyceride lipase: function, regulation by insulin, and comparison with adiponutrin. Diabetes. 2006;55:148–157. [PMC free article] [PubMed] [Google Scholar]
- Kim JY, Tillison K, Lee JH, Rearick DA, Smas CM. The adipose tissue triglyceride lipase ATGL/PNPLA2 is downregulated by insulin and TNF-alpha in 3T3-L1 adipocytes and is a target for transactivation by PPARgamma. Am J Physiol Endocrinol Metab. 2006;291:E115–127. doi: 10.1152/ajpendo.00317.2005. [DOI] [PubMed] [Google Scholar]
- Lee SY, Jeon HM, Ju MK, Kim CH, Yoon G, Han SI, Park HG, Kang HS. Wnt/Snail signaling regulates cytochrome C oxidase and glucose metabolism. Cancer research. 2012;72:3607–3617. doi: 10.1158/0008-5472.CAN-12-0006. [DOI] [PubMed] [Google Scholar]
- Lee YH, Kim SH, Lee YJ, Kang ES, Lee BW, Cha BS, Kim JW, Song DH, Lee HC. Transcription factor Snail is a novel regulator of adipocyte differentiation via inhibiting the expression of peroxisome proliferator-activated receptor gamma. Cellular and molecular life sciences : CMLS. 2013;70:3959–3971. doi: 10.1007/s00018-013-1363-8. [DOI] [PMC free article] [PubMed] [Google Scholar]
- Li S, Brown MS, Goldstein JL. Bifurcation of insulin signaling pathway in rat liver: mTORC1 required for stimulation of lipogenesis, but not inhibition of gluconeogenesis. Proc Natl Acad Sci U S A. 2010;107:3441–3446. doi: 10.1073/pnas.0914798107. [DOI] [PMC free article] [PubMed] [Google Scholar]
- Lin Y, Dong C, Zhou BP. Epigenetic regulation of EMT: the Snail story. Current pharmaceutical design. 2014;20:1698–1705. doi: 10.2174/13816128113199990512. [DOI] [PMC free article] [PubMed] [Google Scholar]
- Lin Y, Wu Y, Li J, Dong C, Ye X, Chi YI, Evers BM, Zhou BP. The SNAG domain of Snail1 functions as a molecular hook for recruiting lysine-specific demethylase 1. EMBO J. 2010;29:1803–1816. doi: 10.1038/emboj.2010.63. [DOI] [PMC free article] [PubMed] [Google Scholar]
- Morigny P, Houssier M, Mouisel E, Langin D. Adipocyte lipolysis and insulin resistance. Biochimie. 2015 doi: 10.1016/j.biochi.2015.10.024. [DOI] [PubMed] [Google Scholar]
- Pagnon J, Matzaris M, Stark R, Meex RC, Macaulay SL, Brown W, O'Brien PE, Tiganis T, Watt MJ. Identification and functional characterization of protein kinase A phosphorylation sites in the major lipolytic protein, adipose triglyceride lipase. Endocrinology. 2012;153:4278–4289. doi: 10.1210/en.2012-1127. [DOI] [PubMed] [Google Scholar]
- Peinado H, Ballestar E, Esteller M, Cano A. Snail mediates E-cadherin repression by the recruitment of the Sin3A/histone deacetylase 1 (HDAC1)/HDAC2 complex. Molecular and Cellular Biology. 2004;24:306–319. doi: 10.1128/MCB.24.1.306-319.2004. [DOI] [PMC free article] [PubMed] [Google Scholar]
- Rowe RG, Li XY, Hu Y, Saunders TL, Virtanen I, Garcia de Herreros A, Becker KF, Ingvarsen S, Engelholm LH, Bommer GT, et al. Mesenchymal cells reactivate Snail1 expression to drive three-dimensional invasion programs. The Journal of cell biology. 2009;184:399–408. doi: 10.1083/jcb.200810113. [DOI] [PMC free article] [PubMed] [Google Scholar]
- Sahu-Osen A, Montero-Moran G, Schittmayer M, Fritz K, Dinh A, Chang YF, McMahon D, Boeszoermenyi A, Cornaciu I, Russell D, et al. CGI-58/ABHD5 is phosphorylated on Ser239 by protein kinase A: control of subcellular localization. J Lipid Res. 2015;56:109–121. doi: 10.1194/jlr.M055004. [DOI] [PMC free article] [PubMed] [Google Scholar]
- Schoiswohl G, Stefanovic-Racic M, Menke MN, Wills RC, Surlow BA, Basantani MK, Sitnick MT, Cai L, Yazbeck CF, Stolz DB, et al. Impact of Reduced ATGL-Mediated Adipocyte Lipolysis on Obesity-Associated Insulin Resistance and Inflammation in Male Mice. Endocrinology. 2015;156:3610–3624. doi: 10.1210/en.2015-1322. [DOI] [PMC free article] [PubMed] [Google Scholar]
- Villena JA, Roy S, Sarkadi-Nagy E, Kim KH, Sul HS. Desnutrin, an adipocyte gene encoding a novel patatin domain-containing protein, is induced by fasting and glucocorticoids: ectopic expression of desnutrin increases triglyceride hydrolysis. J Biol Chem. 2004;279:47066–47075. doi: 10.1074/jbc.M403855200. [DOI] [PubMed] [Google Scholar]
- Wilson CG, Tran JL, Erion DM, Vera NB, Febbraio M, Weiss EJ. Hepatocyte-Specific Disruption of CD36 Attenuates Fatty Liver and Improves Insulin Sensitivity in HFD-Fed Mice. Endocrinology. 2016;157:570–585. doi: 10.1210/en.2015-1866. [DOI] [PMC free article] [PubMed] [Google Scholar]
- Wu JW, Wang SP, Casavant S, Moreau A, Yang GS, Mitchell GA. Fasting Energy Homeostasis in Mice with Adipose Deficiency of Desnutrin/Adipose Triglyceride Lipase. Endocrinology. 2012 doi: 10.1210/en.2011-1518. [DOI] [PubMed] [Google Scholar]
- Xie X, Langlais P, Zhang X, Heckmann BL, Saarinen AM, Mandarino LJ, Liu J. Identification of a novel phosphorylation site in adipose triglyceride lipase as a regulator of lipid droplet localization. Am J Physiol Endocrinol Metab. 2014;306:E1449–1459. doi: 10.1152/ajpendo.00663.2013. [DOI] [PMC free article] [PubMed] [Google Scholar]
- Yamaguchi T, Omatsu N, Morimoto E, Nakashima H, Ueno K, Tanaka T, Satouchi K, Hirose F, Osumi T. CGI-58 facilitates lipolysis on lipid droplets but is not involved in the vesiculation of lipid droplets caused by hormonal stimulation. J Lipid Res. 2007;48:1078–1089. doi: 10.1194/jlr.M600493-JLR200. [DOI] [PubMed] [Google Scholar]
- Yook JI, Li XY, Ota I, Fearon ER, Weiss SJ. Wnt-dependent regulation of the E-cadherin repressor snail. J Biol Chem. 2005;280:11740–11748. doi: 10.1074/jbc.M413878200. [DOI] [PubMed] [Google Scholar]
- Young SG, Zechner R. Biochemistry and pathophysiology of intravascular and intracellular lipolysis. Genes Dev. 2013;27:459–484. doi: 10.1101/gad.209296.112. [DOI] [PMC free article] [PubMed] [Google Scholar]
- Zhou BP, Deng J, Xia W, Xu J, Li YM, Gunduz M, Hung MC. Dual regulation of Snail by GSK-3beta-mediated phosphorylation in control of epithelial-mesenchymal transition. Nat Cell Biol. 2004;6:931–940. doi: 10.1038/ncb1173. [DOI] [PubMed] [Google Scholar]
Associated Data
This section collects any data citations, data availability statements, or supplementary materials included in this article.


