Abstract
In the past decade, tissue microarray (TMA) technology has evolved as an innovative tool for high-throughput proteomics analysis and mainly for biomarker validation. Similarly, enormous amount of data can be obtained from the cell line macroarray (CLMA) technology, which developed from the TMA using formalin-fixed, paraffin-embedded cell pellets. Here, we applied CLMA technology in stem cell research and in particular to identify bona fide neogenerated human induced pluripotent stem cell (hiPSC) clones suitable for down the line differentiation. All hiPSC protocols generate tens of clones, which need to be tested to determine genetically stable cell lines suitable for differentiation. Screening methods generally rely on fluorescence-activated cell sorting isolation and coverslip cell growth followed by immunofluorescence; these techniques could be cumbersome. Here, we show the application of CLMA to identify neogenerated pluripotent cell colonies and neuronal differentiated cell products. We also propose the use of the automated image analyzer, TissueQuest, as a reliable tool to quickly select the best clones, based upon the level of expression of multiple pluripotent biomarkers.
Keywords: cell line macroarray, high-throughput screening and quantification, hiPSC clones
Introduction
Human pluripotent stem cells, including embryonic stem cells (ESCs) and induced pluripotent stem cells (iPSCs), represent extremely attractive tools for cell therapy.1 However, large-scale production, screening for bona fide clones, and future storage of selected and stable lines in tightly controlled conditions are necessary to deliver high-quality cells to satisfy clinical demands.2 Furthermore, to address these needs and guarantee the use of these cells in medical research and drug development, different culture strategies, more robust production, and cell-specific differentiation protocols need to be implemented.3 Currently, reprogramming of human primary dermal fibroblasts is often performed with lentiviruses or Sendai viruses encoding the pluripotent transcription factors, octamer-binding transcription factor 4 (Oct4), Kruppel-like factor 4 (Klf4), sex-determining region Y–Box2 (Sox2), and v-myc avian myelocytomatosis viral oncogene homolog (cMyc), as discovered by Takahashi and colleagues.4 Alternatively, direct reprogramming and differentiation procedures have also been performed using small molecules, specific RNA, mRNA, or proteins.5 However, regardless of reprogramming methods with integrative or non-integrative vectors, or with genetic manipulation–free way, tens of clones are produced and need to be screened for the following characteristics: (1) silencing of viral gene expression; (2) oncogene activation or deactivation of oncosuppressive genes; (3) good expression of several stem cell markers that include Sox2, Oct4, the homeobox transcription factor Nanog, the surface antigens TRA-1-60 and TRA-1-81, and the stage-specific embryonic antigens 3 and 4, and finally (4) the ability to generate differentiated cell products. This process is laborious, time-consuming, and very expensive, limiting the number of clones that can be selected and grown for down the line applications. Unfortunately, many of the neoforming clones do not proliferate; other instead stop growing after few passages or undergo spontaneous undefined differentiation. Often human induced pluripotent stem cells (hiPSCs) can be contaminated by mesenchymal or fibroblast cells, which are not pluripotent but can dominate the cell population; even a differentiated population can be contaminated by immature cells, in both cases; nevertheless, contaminants need to be taken into account. Although recent strategies support pooled selection of polyclonal hiPSC lines,6 each clone is usually analyzed separately to select a good and stable hiPSC clone that can be used for differentiation into self-renewing progenitor cells and mature committed cells of interest. One way to expedite this process is to use the cell line macroarray (CLMA) technology, which allows the analysis of multiple clones in a single experiment.7 The assembly of in vitro–cultured cells into a tissue microarray–like block facilitates the analysis of protein expression in a wide range of different experimental settings, where cells have been manipulated before fixation.
A wide spectrum of basic, translational, and clinical researches is using various single-cell workflows, such as fluorescence-activated cell sorting to classify the cell population.8 Precasted gene scorecards are commercially available9 to assess pluripotency at gene level; however, CLMA is particularly useful to immunophenotype stem cell populations or to assess treatment performances as a quantitative or qualitative control tool. Indeed, it allows high-throughput and cost-effective analysis, with the potential to rapidly identify good or promising clones suitable for differentiation. The use of automated image analyzer to quantitatively score the levels of immunopositivity can even further speed up the search for those clones that offer the greatest probability of differentiation success. Here, we describe the reliability and efficiency of the CLMA technology to screen a series of hiPSC clones and their differentiated cell products.
Materials and Methods
Cell Lines
hiPSCs have been generated using Sendai virus as reprogramming technology10 on multiple sclerosis (MS) and amyotrophic lateral sclerosis (ALS) patients or healthy subjects (control: CTR) fibroblasts. Cells were maintained in mTeSR1 (StemCell Technologies, Milan, Italy) on hESC-qualified Matrigel (BD Biosciences, Milan, Italy) and dissociated with 0.5-mM EDTA (Ambion, Milan, Italy). Neuronal differentiation was performed on human fetal neural stem cell line CB660SP and long-term self-renewing neuroepithelial stem (lt-NES) cells AF22 as well as on mouse ESCs, ES46C, using dedicated protocols.11–13 The cell lines used in this study are available at ISENET, Milan, Italy (www.isenet.it).
Formalin-Fixed, Paraffin-Embedded Cell Pellets
CLMA technology requires the embedding of fixed cells in paraffin. To prepare the formalin-fixed, paraffin-embedded (FFPE) cell blocks, two methods were applied, essentially as described in La Spada et al.14: trypsinization and mechanical scraping.
For trypsinization, cells were detached using Accutase (Sigma Aldrich, Milan, Italy), washed twice in PBS (centrifugation at 270 × g for 3 min, each time), and fixed in 4% paraformaldehyde (PFA; Sigma Aldrich) for 20 min at room temperature, as histological standard procedure. Cells were pelleted by centrifugation for 3 min at 270 × g and then included in 300 µl of 2% low-melting agarose (LMA; Sigma Aldrich) in PBS at 55C. LMA cell pellet was subsequently incubated on ice for 30 min to solidify. LMA-embedded pellet was finally stored in 1% PFA at 4C overnight.
Mechanical scraping required the addition of 4% PFA for 20 min at room temperature; the cells were then scraped with a rubber policeman and centrifuged for 3 min at 270 × g. The pellet was resuspended in 300 µl of 2% LMA, incubated on ice for 30 min, and maintained in 1% PFA at 4C overnight, as described previously.
Each donor block containing the LMA-included cell pellets was processed in an automatic tissue processor (Fully Enclosed Tissue Processor Leica ASP300S; Leica Microsystems, Milan, Italy) for dehydration by incubating the pellet in solutions with increasing alcohol content under vacuum pressure. Finally, cell pellets were embedded in paraffin, and from this point onward, the cell blocks were treated exactly like FFPE samples.
CLMA Design and Construction
Galileo CK4500 (ISENET, Milan, Italy; www.isenet.it) arrayer was used to make a predesigned recipient block equipped with 1-mm-diameter hollow needle, to follow the pluripotency and differentiation processes of neuronal-derived stem cells. The instrument is able to handle both the donor and recipient blocks simultaneously. Cell distribution in each core was evaluated on 3-µm sections that were sliced from the same paraffin donor block and stained with hematoxylin and eosin using Leica Autostainer ASP6525 (Leica Microsystems).
Immunofluorescence Analysis
Immunofluorescence (IF) analysis was performed on 3-µm CLMA slices, as reported in La Spada et al.14 Briefly, slides were deparaffinized for 30 min at 65C and rehydrated by incubating them in decreasing alcoholic scale solutions (5 min in xylene, repeated twice; 3 min in 100% ethanol, repeated twice; 3 min in 95% ethanol, repeated twice; 3 min in 70% ethanol; 3 min in 50% ethanol; and 3 min in H2O). Slides were boiled for 30 min in 0.01-M citrate buffer pH 6 for antigen retrieval, subsequently treated for 10 min with 0.1-M glycine pH 7.4, incubated for 30 min in blocking buffer (BB; 5% Normal Goat Serum [Life Technologies, Milan, Italy], 0.6% Triton X-100 [Sigma Aldrich] in PBS), and then incubated with the primary antibodies (Table 1) diluted in BB at 4C overnight. The slides were then washed six times for 5 min in 1× PBS with 0.3% Triton X-100 and incubated for 30 min at room temperature with the appropriate secondary antibodies (Table 2). Next, slides were rinsed six times for 5 min with 1× PBS and incubated with the nuclear marker Hoechst 33258 (Sigma Aldrich) diluted 1:600 in 1× PBS. Finally, slides were washed twice in H2O and mounted with coverslips using the Gel Mount aqueous mounting medium (Sigma Aldrich). Images were acquired using a Leica DMI4000B fluorescence microscope connected to a DFC365 FX camera (Leica Microsystems) at different magnifications (10×, 20×, and 40×), using the LAS AF software (Leica Microsystems).
Table 1.
Primary Antibodies Used in the Immunofluorescence Protocol.
| Antibody | Antigen Cellular Localization | Monoclonal Antibody Source and Ig Type | Dilution or Final Concentration | Supplier and Catalog Number |
|---|---|---|---|---|
| α-Sox2 | Nuclear | Rabbit IgG | 1:300 | Merck Millipore (Milan, Italy); AB5603 |
| α-Nestin | Cytosolic | Rabbit IgG | 1:200 | Merck Millipore; AB5922 |
| α-Oct3/4 | Nuclear | Mouse IgG | 1:50 | Santa Cruz Biotechnology (Heidelberg, Germany); SC5279 |
| α-Nanog | Nuclear | Rabbit IgG | 1:50 | Abcam; AB21624 |
| α-SEL1L | Ubiquitary | Mouse IgG | 5 µg/ml | Orlandi et al.15 |
| α-βIII-Tubulin | Cytosolic | Rabbit IgG | 1:100 | Sigma Aldrich; T2200 |
| α-GFAP | Cytosolic | Rabbit IgG | 1:1000 | Sigma Aldrich; G9269 |
| α-Vimentin | Cytosolic | Mouse IgG | 30 µg/ml | Sigma Aldrich; V6389 |
Abbreviation: GFAP, glial fibrillary acidic protein.
Table 2.
Fluorophore-Conjugated Secondary Antibodies Used for Visualization of Primary Antibodies.
| Secondary Antibody | Fluorophore Conjugation | Dilution | Supplier and Catalog Number |
|---|---|---|---|
| Goat α-Mouse IgG | Alexa Fluor 488 (green) | 1:200 | Invitrogen; A11017 |
| Goat α-Rabbit IgG | Alexa Fluor 568 (red) | 1:200 | Invitrogen; A21069 |
Software Analysis
Acquired images were analyzed using the dedicated software, TissueQuest (TissueGnostics GmbH, Vienna, Austria), which offers several algorithms for single-cell identification. Cutoffs were set interactively using non-reactive control primary antibodies. Specifically, the software is able to set cutoffs automatically using a class 2 cutoff algorithm, or alternatively, cutoffs can be identified by the operator: Background and signal intensity could be analyzed interactively using the software. This software allows an automated quantification of the cells in each spot and counts positive cells for specific marker stainings.16 TissueQuest software creates scatterplots that allows you to clearly visualize positive and negative cells by means of a backward gating function and manage cutoff values. Therefore, it was possible to accurately quantify the percentage of cells positive for stemness markers in each analyzed hiPSC clone in a rapid and unbiased manner. The same cutoff values were maintained for each marker and comparison, to minimize error rate. Minimum of four casual fields were analyzed for each sample.
Results
Immunopositivity for Cells Grown on Coverslips and for CLMA Technology
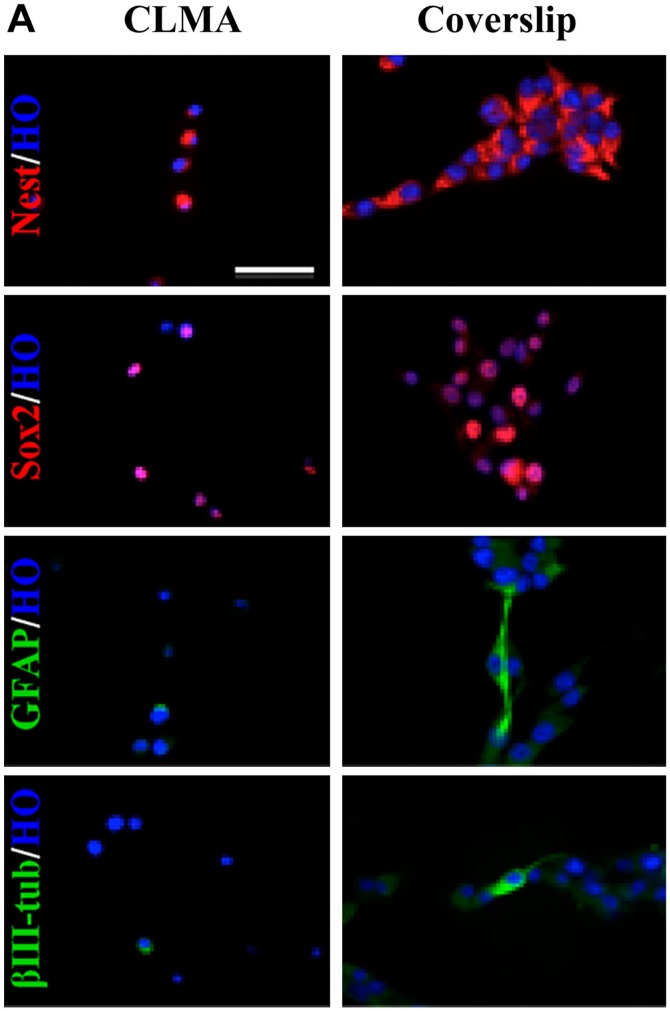
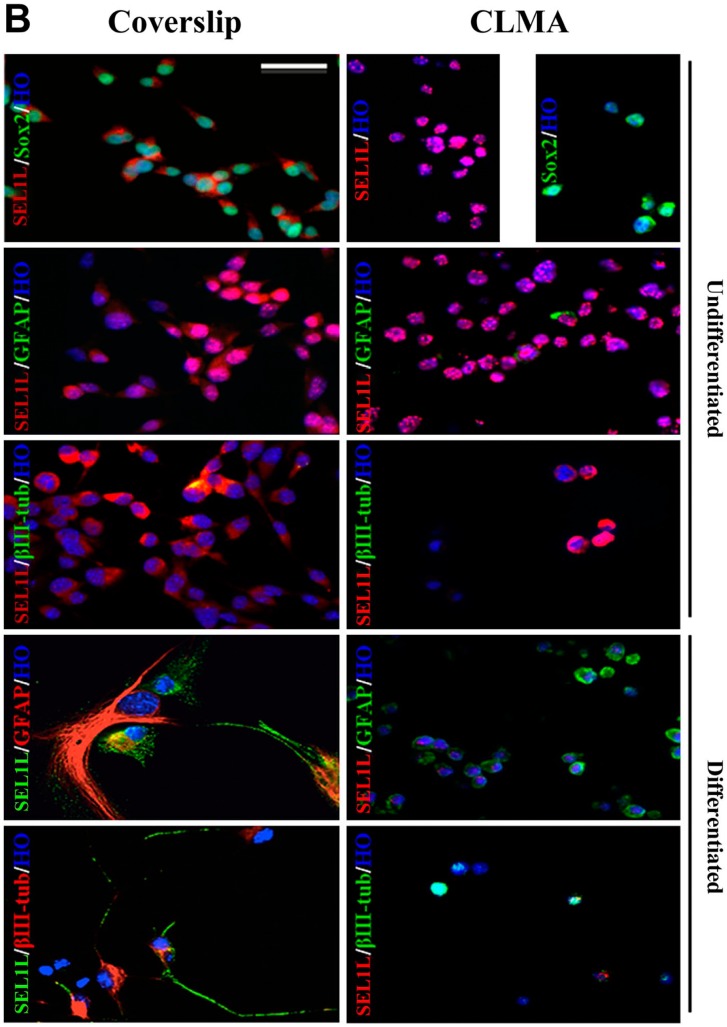
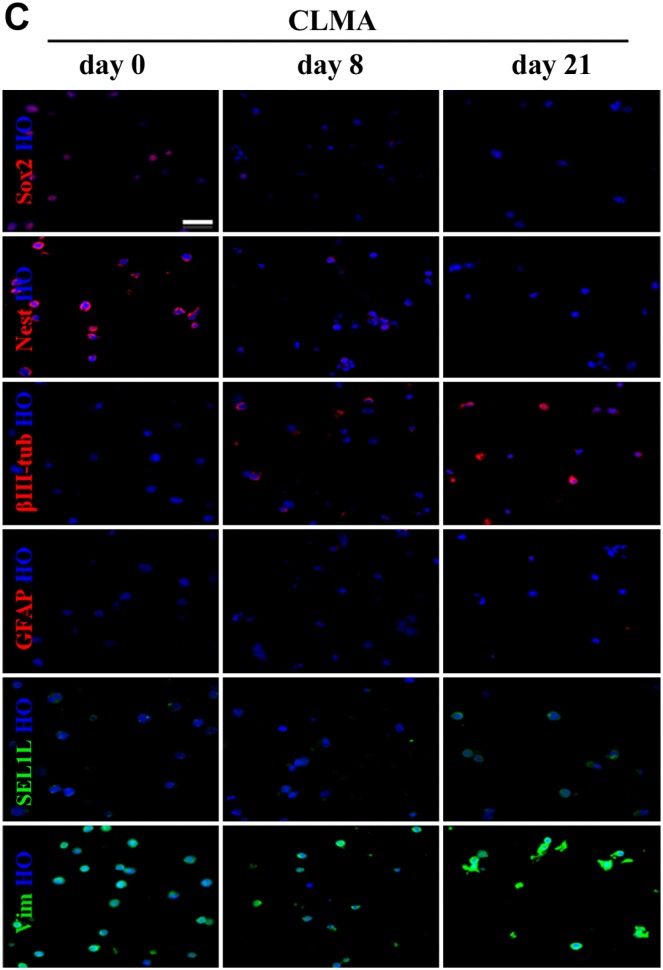
The most common method for hiPSC clone screening is IF analysis on coverslips. This procedure requires that each cell line is assayed at every time point with stage-specific markers. Culturing each cell line on coverslips is laborious and time-consuming. Here, we compared immunopositivity of the same cell lines grown on coverslips or prepared for CLMA. FFPE cell donor blocks were used to build the array, and several lines were processed for IF in a single experiment. Figure 1A shows IF analysis of lt-NES AF22 cell line grown on coverslips or prepared for cell array and simultaneously stained with the pluripotency markers Sox2 and Nestin, in stemness conditions and after neuronal differentiation using glial fibrillary acidic protein (GFAP) and βIII-tubulin antibodies. CLMA requires cell harvesting, which, in general, is performed by enzymatic treatment, and although this treatment caused drastic morphological changes, the signals in the cells were preserved and corresponded to the respective predicted cellular localizations (antigen localizations are listed in Table 1). Identical results are shown in Fig. 1B and C, where murine ESCs (mES46C) were both grown on coverslips and prepared for the CLMA analysis and subjected to neural differentiation (days 8 and 21). Again, no signal was lost although positivity was confined only in localized areas of the cells. In both cases, the marker subcellular localization was maintained in the CLMA cores (Fig. 1B and C).
Figure 1A.
Coverslip versus CLMA. Immunocharacterization of human induced pluripotent stem neuralized AF22 cell line by CLMA technology. AF22 cells grown in undifferentiated and differentiated conditions were expanded in flasks and collected by trypsinization for CLMA immunocharacterization or grown on coverslips. Undifferentiated and differentiated AF22 cells were analyzed for neural precursor markers Nestin and Sox2, and for the differentiation markers βIII-tubulin and GFAP.
Figure 1B.
Coverslip versus CLMA. Mouse embryonic stem cell line ES46C was induced to differentiate into neuronal lineage for 21 days. The expressions and distributions of stem cell markers Nestin, Sox2, and SEL1L and of neural differentiation markers βIII-tubulin and GFAP were assessed by immunofluorescence.
Figure 1C.
Coverslip versus CLMA. Representative images of CLMA cores of ES46C during neural induction at days 0, 8, and 21 of differentiation. Scale bars: A–C = 100 µm. Abbreviation: CLMA, cell line macroarray; GFAP, glial fibrillary acidic protein.
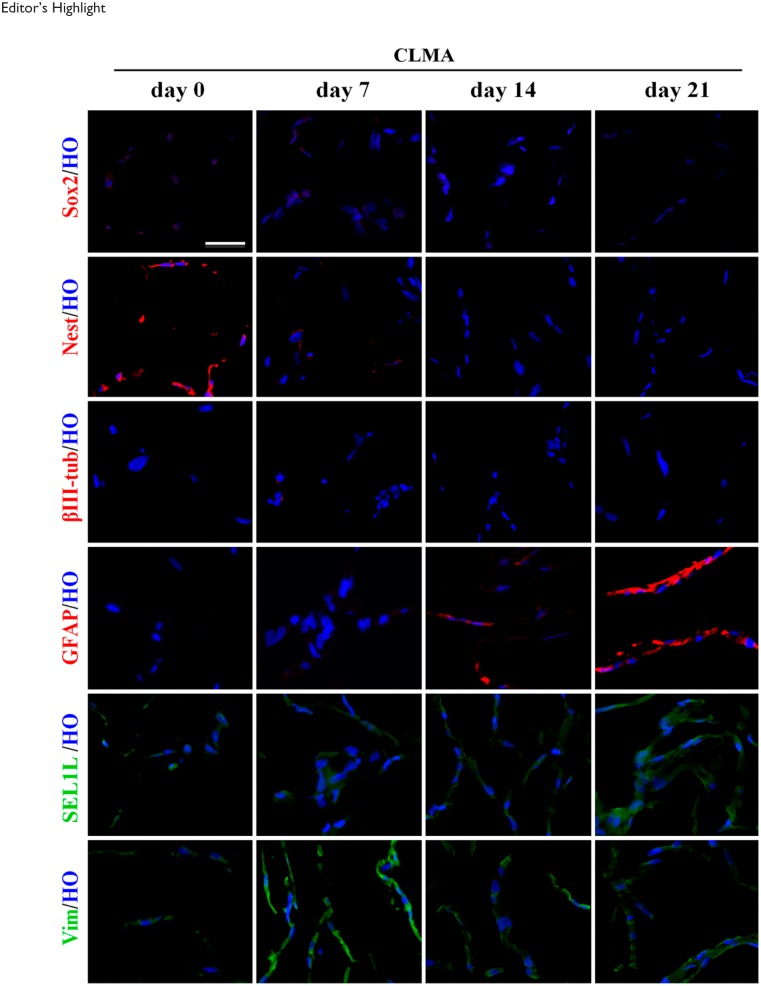
To subvert the morphological changes due to enzymatic treatment, we modified the process by adopting the rubber scraping approach, as described previously.14 Human fetal neural stem cells CB660SP (Fig. 2) were harvested by scraping with rubber policeman and analyzed by CLMA technology. Cells were collected at days 0, 7, 14, and 21 after neuronal differentiation. Sox2, Nestin, βIII-tubulin, and GFAP were stained with Alexa Fluor 568 (red) fluorophore; SEL1L and Vimentin were stained with Alexa Fluor 488 (green) fluorophore and nuclei counterstained with Hoechst (blue).
Figure 2.
Cell harvesting by mechanical scraping. No further subdivisions (lines A–X) were indicated in the figure. Human fetal neural stem cells CB660SP were differentiated toward neural lineage, and cell pellets were collected at days 0, 7, 14, and 21 of differentiation using mechanical scraping approach to better preserve cell morphology. Immunofluorescence analysis of pluripotency markers (Sox2, Nestin, and SEL1L) and neuronal differentiation markers (GFAP and βIII-tubulin) is shown in addition to Vimentin, a cytoskeleton marker used as control of intermediate filament. Scale bars: A–X = 200 µm. Abbreviation: CLMA, cell line macroarray; GFAP, glial fibrillary acidic protein.
CLMA technology allowed to reproduce the results of classical coverslip immunophenotypization, preserving marker expression and subcellular localization more rapidly than conventional screening methods.
CLMA Construction Applied to Bona Fide hiPSC Clone Screening
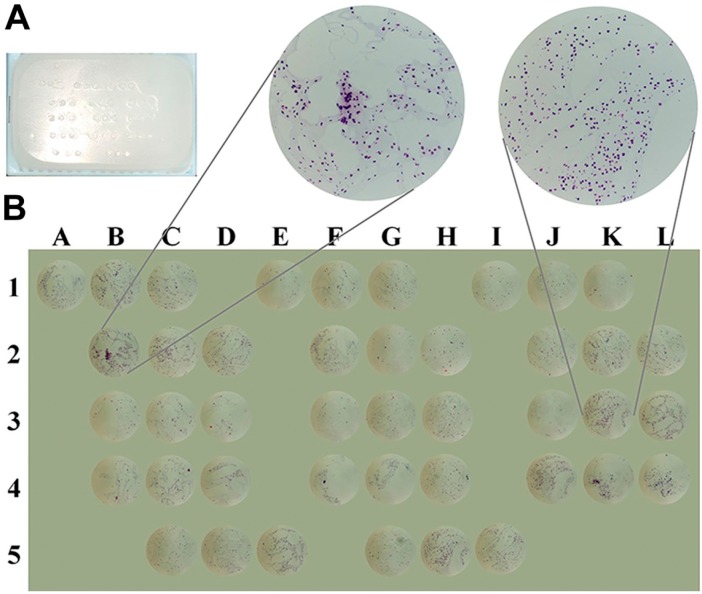
CLMA technology was applied to test hiPSC clones generated from skin fibroblasts of healthy control individuals (CTR), and subjects affected by MS (RR: relapsing–remitting and PP: primary progressive) or ALS. We tested 14 clones obtained from four different hiPSC lines: two PP11#3p8 (biological replicates), three RR25 (#11p8, #24p7, and #31p7), four CTR8 (#2p6, #2p7, #14p7, and #15p6), three ALS5 (#6p5, #12p6, and #12p7, as biological replicates), and two negative controls consisting of pools of partially differentiated colonies (CTR−, abortive clones). hiPSCs were generated using Sendai virus encoding Oct4, Klf4, Sox2, and cMyc (CytoTune; Life Technologies), grown in 35-mm dishes, and harvested and processed as described in the “Materials and Methods” section. For CLMA processing, 1-mm cores from each donor block containing each hiPSC clone were spotted asymmetrically in the recipient block as shown in Fig. 3A. A total of 42 spots in the CLMA recipient cassette represented the entire hiPSC collection, and each sample was spotted in triplicate. One microtome slide (3 µm) from the recipient cassette was stained with H&E as shown in Fig. 3B. The array design was as follows: three cores from control hiPSC (CTR8) were inserted in row 1 columns A to K and in row 2 columns B to D (total of 12 spots); MS_RR25 represented in nine spots in row 2 columns F to L and in row 4 columns J to L; MS_PP11 in row 4 columns B to H (six spots) and ALS5 in row 3 columns B to H (six spots); and negative control samples were placed in row 5 columns C to I (six spots) (Fig. 3B). Each spot was taken from different areas of the original agarose-embedded cell pellet. Cell density, distribution, and morphology within each hiPSC clone were established by H&E staining as shown in Fig. 3B. Several publications on tissue microarrays ascertained that three cores statistically represent the entire cell population collected from the 35-mm culture dish.17–19 The minimum number of cells necessary for CLMA analysis can be scaled down to about 1 × 10⁵.
Figure 3.
Cell line macroarray (CLMA) design/geometry for human induced pluripotent stem cell (hiPSC) screening and traceability. (A) Representative image of the CLMA block. The CLMA design was as follows: Rows 1 to 4 contain triplicates of each hiPSC (CTR8, RR25, PP11, ALS5) clone to be tested, whereas triplicates of differentiated clones were placed in row 5 and used as negative control samples. (B) Representative photomicrographs of hematoxylin and eosin staining of the assembled CLMA and their respective coordinates onto the array.
Immunophenotypical Characterization to Select Bona Fide hiPSC Clones
Fibroblast conversion into hiPSCs implies the generation of several clones; however, not all of them are suitable for further differentiations. Nonetheless, all clones need to be screened to select the ones with the highest probability to differentiate into the predecided cell fate. CLMA slides (containing 42 cell spots) were screened for Sox2, Nanog, and Oct3/4 protein expression by IF. We also included SEL1L as a putative novel stem cell pluripotency marker.11
To expedite the tedious screening of marker expression, we used TissueQuest 4.0 image processing software (TissueGnostics GmbH), which offers several algorithms for single-cell identification.16 Immunostained CLMA slides were scanned to generate high-resolution digital images. All the cells were identified using the nuclear staining Hoechst channel, and a nuclear measure mask was generated to measure the mean staining intensity. Identified cell nuclei were also used to generate measure masks for the other antigens based on their localization, that is, cytosolic, nuclear, membranous, or a combination of them. Cutoffs were set interactively using non-reactive control primary antibodies, as described in the “Materials and Methods” section. The percentage of single- and double-positive cells of each core was calculated automatically. TissueQuest allows to automatically quantify the number of positive cells in each spot and counts positive cells for specific markers in an unbiased manner. Therefore, it was possible to accurately quantify the percentage of positive cells for each marker in each hiPSC clone, minimizing researchers’ precious time. Output parameters from the software include the number of objects defined as cells in the image, staining intensity (negative, weak, moderate, and strong), and fraction (%) of positive cells.
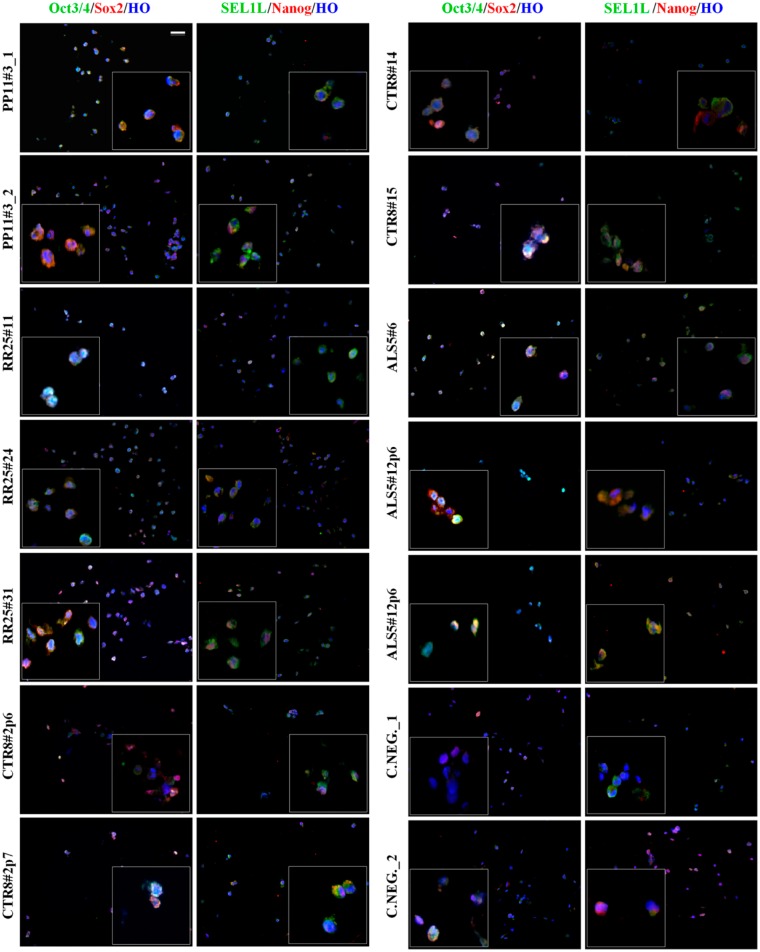
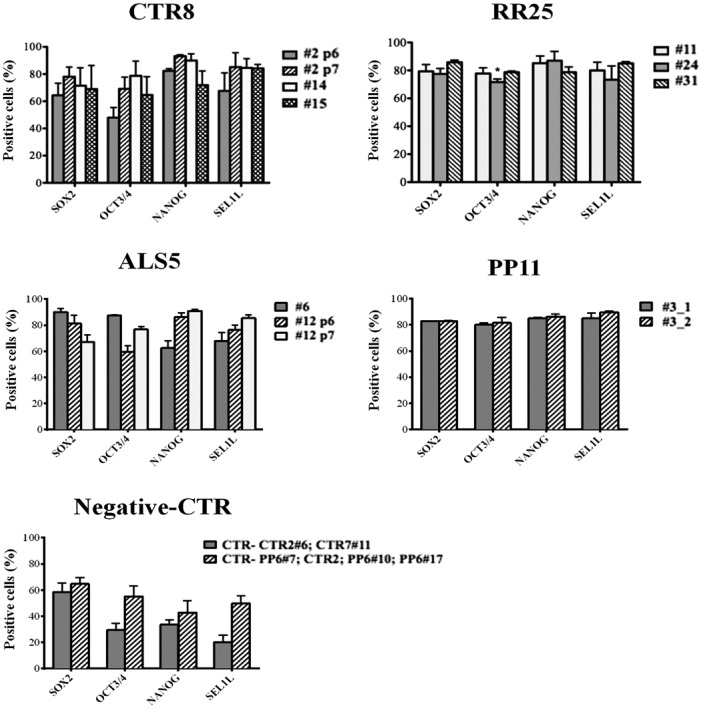
Clones PP11#3 and ALS5#12 are considered as independent biological replicates, as they were harvested in two pellets either at the same passage or at two consecutive passages but tested separately. The results indicated the uniform staining of the two replicate clones for PP11#3 and the homogeneity in the reprogramming conditions (Fig. 4). The histogram in Fig. 5 confirmed the homogeneity of clone PP11#3, as comparable expression levels for all the pluripotent markers were registered; indeed, both clones showed more than 80% positivity for each marker with negligible statistical differences between the first and second preparation (_1 and _2). Similar results were observed for RR25 clones that also showed nearly 80% of positivity for all the pluripotency markers in the cells constituting the array with very few exceptions (Fig. 4). hiPSC sample CTR8 instead showed certain level of variability of Sox2, Oct3/4, Nanog, and SEL1L expression; clone #2p7 showed the highest expression of all the pluripotency markers compared with #2p6, #14, and #15 (Fig. 5). Clone #2p6 was excluded from further differentiation process due to low levels of Oct3/4 expression, indicating incomplete reprogramming. Variability was also observed among the hiPSC ALS5 line clones #6p5, #12p6, and #12p7. The heterogeneity of expression in this hiPSC line would preclude further differentiation, although all the markers have some degree of positivity.
Figure 4.
Immunophenotypical characterization of human induced pluripotent stem cell (hiPSC) clones. The 14 hiPSC clones on the cell line macroarray slices were stained with Sox2, Nanog, Oct3/4, and SEL1L to establish their pluripotency state and determine which clone to use for subsequent differentiation. Scale bar: 50 µm.
Figure 5.
Quantification of marker expression. Immunoquantification of marker positivity was established automatically using TissueQuest software. The histogram indicates the percentage of positive cells ± standard deviation for each marker. Levels of pluripotency markers expression allowed to identify the best clone for each cell line for CTR8 cell line: CTR8 #2p7 was selected as the best clone. RR25 cell lines showed similar levels for all the clones. ALS5 cells were characterized by high variability, suggesting incomplete reprogramming. Reliability of cell line macroarray coupled to TissueQuest analysis was supported by overlapping levels of markers expression for technical independent replicates of PP11#3 clone (_1 and _2) and by low expression of pluripotency markers in the abortive clones (negative control samples, CTR−).
The two hiPSCs used as negative controls showed poor levels of pluripotency (Fig. 5): Only 20% to 50% of all the cells were positive as established by the TissueQuest software, confirming the accuracy of CLMA screening.
In conclusion, we tested both reproducibility and efficiency of CLMA analysis: results showed that CLMA technology coupled to TissueQuest software enabled a rigorous and time-saving analysis to select bona fide hiPSC clones for down the line applications. Therefore, it is possible to select the best hiPSC clone, discard the partially reprogrammed ones, and compare the results with negative control samples in a single experiment.
Discussion
hiPSC lines have a wide range of applications being extremely useful in drug testing and to model a variety of human cell types and conditions. hiPSC-derived organotypic cell lines as a model of organ response to drug metabolism, based upon individual genotype and phenotype, are particularly attractive for cell therapy. However, large-scale production of hiPSCs is necessary to deliver high-quality cells in relevant quantities to satisfy clinical demands. To meet the demands and be able to use these cells in medical research and drug development, different culture strategies and more robust bona fide clone production and screening need to be potentiated. The presently used methods of IF on coverslips or nucleic acid analysis are trustworthy, but they are not suitable for the screening of hundreds of cell clones. One way to expedite the analysis is to use the CLMA technology that allows the analysis of multiple clones in a single experiment. The assembly of in vitro–cultured cells into a tissue microarray–like block facilitates the analysis of protein expression in a range of different experimental settings, where cells have been manipulated before fixation. This investigating method enables high-throughput, cost-effective analysis, with the potential to rapidly identify good or promising clones suitable for differentiation. The advantage of using CLMA is the simultaneous study of a large number of cell lines of different origins and treatments. This analysis ensures identical processing of all specimens, eliminating individual variables (person-to-person handling) and inter- or intra-laboratory conditions. The uniformity of the protocol for the samples ensures the reliability and reproducibility of results. Moreover, picking of a small area of the sample (the diameters of the cores can range from 0.6 to 2.0 mm) enables to preserve the valuable tissues or cell samples, thus making them available for future analysis or diagnostic purposes. Another benefit is the wide range of uses and applications. On one array slide, it is possible to apply several techniques: IHC and IF, two techniques that involve the use of antibodies. Others implicate the use of nucleic acid probes, such as fluorescence in situ hybridization or mRNA in situ hybridization. Obviously, the technology has not only advantages but also some limitations. The main question relates to the number of cores necessary to represent the entire entity of the tissue. Different studies were carried out on this argument, and the conclusion was that with duplicate cores, the concordance between tissue microarray and the sample is near 95%,20 percentage that grows up to 98% if triplicate cores are used.21 A minimum of triplicate coring also ensures a good representation of the possible heterogeneity of the cell population and protects from possible loss of cores during sectioning or antigen retrieval procedures. Nonetheless, non-homogeneous cell distribution in the CLMA pellet, due to technical procedure, could be overcome by replicate coring. The fixation methods also generate limitations to the technique; indeed, the formalin-buffered solution inserts protein–nucleic acid cross-link and adds methyl groups to RNA bases generating false-positive and false-negative results. The use of frozen tissue microarray, trying to avoid these chemical modifications, could provoke tissue alterations loosing architecture and cellular morphology.22 Nevertheless, CLMAs can determine the number of contaminating cells within hiPS and differentiated cell populations, which may dramatically influence biomarker proteins and RNA expression. Presently, there are numbers of single-cell platforms that can analyze a cell population. Flow cytometry is the method of choice of most researchers; however, this technique requires good surface markers, but the main limitation of this assay is to assess the number of functional proteins within the cells and not on the surface. Scorecard assays based on quantitative real-time PCR constitute another platform to analyze hiPSC clones9; however, partially reprogrammed clones are difficult to be identified, and even if this assay is quantitative and able to quantify gene transcripts, it does not indicate the percentage of positive cells in the population. Moreover, to simultaneously test multiple markers, multiple cell preparations are necessary. CLMA assembles in vitro–cultured cell lines and primary cells in a macroarray format, allowing the simultaneous analysis of multiple protein expression in almost hundreds of cell samples. In this work, we demonstrated the reliability and reproducibility of CLMA technology applied to hiPSC clone screening by analyzing surface markers, as well as nuclear and cytoplasmic proteins; therefore, it could be used as a routinely screening technique for newly generated hiPSC clones. Furthermore, from CLMA blocks, hundreds of slides can be stored and used for future screening purposes with new biomarkers.
Footnotes
Competing Interests: The author(s) declared no potential conflicts of interest with respect to the research, authorship, and/or publication of this article.
Author Contributions: ALS, IB, SB, GM conceived and designed the experiments; ALS, LO, NC, FR, AN, ADB performed the experiments; ALS, LO, TS, ADB, IB analyzed the data; ALS, IB, LO, SB, ADB, wrote the paper; and IB, SB, GM, LO critically revised the paper. All authors have read and approved the final manuscript.
Funding: The author(s) disclosed receipt of the following financial support for the research, authorship, and/or publication of this article: This study was supported by grants from NeuroStemcellRepair (European Union Seventh Framework Programme, Grant Agreement No. 602278), Ministero dell’Istruzione, dell'Università e della Ricerca (MIUR) Regione Lombardia Network Lombardo iPS (NetLiPS; Project ID 30190629-2011), Progetto Quadro Regione Lombardia-CNR (RSPPTECH 2013–2015), and InterOmics Flagship Project (2015).
Literature Cited
- 1. Nishikawa S, Goldstein RA, Nierras CR. The promise of human induced pluripotent stem cells for research and therapy. Nat Rev Mol Cell Biol. 2008;9:725–9. [DOI] [PubMed] [Google Scholar]
- 2. Serra M, Brito C, Correia C, Alves PM. Process engineering of human pluripotent stem cells for clinical application. Trends Biotechnol. 2012;30:350–9. [DOI] [PubMed] [Google Scholar]
- 3. Macarron R, Banks MN, Bojanic D, Burns DJ, Cirovic DA, Garyantes T, Green DV, Hertzberg RP, Janzen WP, Paslay JW, Schopfer U, Sittampalam GS. Impact of high-throughput screening in biomedical research. Nat Rev Drug Discov. 2011;10:188–95. [DOI] [PubMed] [Google Scholar]
- 4. Takahashi K, Tanabe K, Ohnuki M, Narita M, Ichisaka T, Tomoda K, Yamanaka S. Induction of pluripotent stem cells from adult human fibroblasts by defined factors. Cell. 2007;131:861–72. [DOI] [PubMed] [Google Scholar]
- 5. Warren L, Manos PD, Ahfeldt T, Loh YH, Li H, Lau F, Ebina W, Mandal PK, Smith ZD, Meissner A, Daley GQ, Brack AS, Collins JJ, Cowan C, Schlaeger TM, Rossi DJ. Highly efficient reprogramming to pluripotency and directed differentiation of human cells with synthetic modified mRNA. Cell Stem Cell. 2010;7:618–30. [DOI] [PMC free article] [PubMed] [Google Scholar]
- 6. Paull D, Sevilla A, Zhou H, Hahn AK, Kim H, Napolitano C, Tsankov A, Shang L, Krumholz K, Jagadeesan P, Woodard CM, Sun B, Vilboux T, Zimmer M, Forero E, Moroziewicz DN, Martinez H, Malicdan MC, Weiss KA, Vensand LB, Dusenberry CR, Polus H, Sy KT, Kahler DJ, Gahl WA, Solomon SL, Chang S, Meissner A, Eggan K, Noggle SA. Automated, high-throughput derivation, characterization and differentiation of induced pluripotent stem cells. Nat Methods. 2015;12:885–92. [DOI] [PubMed] [Google Scholar]
- 7. Kallioniemi OP, Wagner U, Kononen J, Sauter G. Tissue microarray technology for high-throughput molecular profiling of cancer. Hum Mol Genet. 2001;10:657–62. [DOI] [PubMed] [Google Scholar]
- 8. Adan A, Alizada G, Kiraz Y, Baran Y, Nalbant A. Flow cytometry: basic principles and applications. Crit Rev Biotechnol. 2016:1–14. [DOI] [PubMed] [Google Scholar]
- 9. Bock C, Kiskinis E, Verstappen G, Gu H, Boulting G, Smith ZD, Ziller M, Croft GF, Amoroso MW, Oakley DH, Gnirke A, Eggan K, Meissner A. Reference maps of human ES and iPS cell variation enable high-throughput characterization of pluripotent cell lines. Cell. 2011;144:439–52. [DOI] [PMC free article] [PubMed] [Google Scholar]
- 10. Ban H, Nishishita N, Fusaki N, Tabata T, Saeki K, Shikamura M, Takada N, Inoue M, Hasegawa M, Kawamata S, Nishikawa S. Efficient generation of transgene-free human induced pluripotent stem cells (iPSCs) by temperature-sensitive Sendai virus vectors. Proc Natl Acad Sci U S A. 2011;108:14234–9. [DOI] [PMC free article] [PubMed] [Google Scholar]
- 11. Cardano M, Diaferia GR, Cattaneo M, Dessì SS, Long Q, Conti L, Deblasio P, Cattaneo E, Biunno I. mSEL-1L (suppressor/enhancer Lin12-like) protein levels influence murine neural stem cell self-renewal and lineage commitment. J Biol Chem. 2011;286:18708–19. [DOI] [PMC free article] [PubMed] [Google Scholar]
- 12. Falk A, Koch P, Kesavan J, Takashima Y, Ladewig J, Alexander M, Wiskow O, Tailor J, Trotter M, Pollard S, Smith A, Brüstle O. Capture of neuroepithelial-like stem cells from pluripotent stem cells provides a versatile system for in vitro production of human neurons. PLoS ONE. 2012;7:e29597. [DOI] [PMC free article] [PubMed] [Google Scholar]
- 13. Sun Y, Pollard S, Conti L, Toselli M, Biella G, Parkin G, Willatt L, Falk A, Cattaneo E, Smith A. Long-term tripotent differentiation capacity of human neural stem (NS) cells in adherent culture. Mol Cell Neurosci. 2008;38:245–58. [DOI] [PubMed] [Google Scholar]
- 14. La Spada A, Rainoldi B, De Blasio A, Biunno I. Application of tissue microarray technology to stem cell research. Microarrays. 2014;3:159–67. [DOI] [PMC free article] [PubMed] [Google Scholar]
- 15. Orlandi R, Cattaneo M, Troglio F, Campiglio M, Biunno I, Ménard S. Production of a monoclonal antibody directed against the recombinant SEL1L protein. Int J Biol Markers. 2002;17:104-11. [DOI] [PubMed] [Google Scholar]
- 16. Steiner GE, Ecker RC, Kramer G, Stockenhuber F, Marberger MJ. Automated data acquisition by confocal laser scanning microscopy and image analysis of triple stained immunofluorescent leukocytes in tissue. J Immunol Methods. 2000;237:39–50. [DOI] [PubMed] [Google Scholar]
- 17. Bartlett JM, Christiansen J, Gustavson M, Rimm DL, Piper T, van de Velde CJ, Hasenburg A, Kieback DG, Putter H, Markopoulos CJ, Dirix LY, Seynaeve C, Rea DW. Validation of the IHC4 breast cancer prognostic algorithm using multiple approaches on the multinational TEAM clinical trial. Arch Pathol Lab Med. 2016;140:66–74. [DOI] [PubMed] [Google Scholar]
- 18. Liu M, Pitcher B, Mardis E, Davies S, Friedman P, Snider J, Vickery T, Reed J, DeSchryver K, Singh B, Gradishar W, Perez E, Martino S, Citron M, Norton L, Winer E, Hudis C, Carey L, Bernard P, Nielsen T, Perou C, Ellis M, Barry W. PAM50 gene signatures and breast cancer prognosis with adjuvant anthracycline- and taxane-based chemotherapy: correlative analysis of C9741 (Alliance). npj Breast Canc. 2016;2:15023. [DOI] [PMC free article] [PubMed] [Google Scholar]
- 19. Varambally S, Dhanasekaran SM, Zhou M, Barrette TR, Kumar-Sinha C, Sanda MG, Ghosh D, Pienta KJ, Sewalt RG, Otte AP, Rubin MA, Chinnaiyan AM. The polycomb group protein EZH2 is involved in progression of prostate cancer. Nature. 2002;419:624–9. [DOI] [PubMed] [Google Scholar]
- 20. Goethals L, Perneel C, Debucquoy A, De Schutter H, Borghys D, Ectors N, Geboes K, McBride WH, Haustermans KM. A new approach to the validation of tissue microarrays. J Pathol. 2006;208:607–14. [DOI] [PubMed] [Google Scholar]
- 21. Gulmann C, Butler D, Kay E, Grace A, Leader M. Biopsy of a biopsy: validation of immunoprofiling in gastric cancer biopsy tissue microarrays. Histopathology. 2003;42:70–6. [DOI] [PubMed] [Google Scholar]
- 22. Schoenberg Fejzo M, Slamon DJ. Frozen tumor tissue microarray technology for analysis of tumor RNA, DNA, and proteins. Am J Pathol. 2001;159:1645–50. [DOI] [PMC free article] [PubMed] [Google Scholar]


