

In this review, van der Knapp and Verrijzer discuss the current understanding of the molecular mechanisms connecting metabolism to gene expression and their implications for development and disease.
Keywords: metabolism, cancer, chromatin, development, epigenetics, transcription
Abstract
To make the appropriate developmental decisions or maintain homeostasis, cells and organisms must coordinate the expression of their genome and metabolic state. However, the molecular mechanisms that relay environmental cues such as nutrient availability to the appropriate gene expression response remain poorly understood. There is a growing awareness that central components of intermediary metabolism are cofactors or cosubstrates of chromatin-modifying enzymes. As such, their concentrations constitute a potential regulatory interface between the metabolic and chromatin states. In addition, there is increasing evidence for a direct involvement of classic metabolic enzymes in gene expression control. These dual-function proteins may provide a direct link between metabolic programing and the control of gene expression. Here, we discuss our current understanding of the molecular mechanisms connecting metabolism to gene expression and their implications for development and disease.
Metabolism and gene regulation are two fundamental biological processes that are essential to all living organisms. Homeostasis, cell growth, and differentiation all require the coordination of metabolic state and gene expression programs. Nevertheless, how expression of the genome adapts to metabolic state or environmental changes is not well understood. One level of regulation involves signal transduction pathways that control key transcription factors that act as master regulators of gene expression programs. In addition, post-translational modifications (PTMs) of chromatin play a major role in the activation or repression of gene transcription. These include acetylation, methylation, and phosphorylation of the histones and DNA methylation. Some of these chromatin modifications are involved in the maintenance of stable patterns of gene expression, usually referred to as epigenetic regulation. Pertinently, the activity of enzymes that modulate chromatin is critically dependent on central metabolites as cofactors or cosubstrates. Thus, the availability of metabolites that are required for the activity of histone-modifying enzymes may connect metabolism to chromatin structure and gene expression. Finally, selective metabolic enzymes act in the nucleus to adjust gene transcription in response to changes in metabolic state. Here, we review the interface between metabolism and gene transcription. We focus on the molecular mechanisms involved and discuss unresolved issues and implications for development and disease.
The basics of metabolism and gene expression control
Metabolism is the total of all chemical reactions in cells and organisms that maintain life. Metabolism can be divided into two classes: catabolic processes (the breakdown of molecules that usually results in the release of energy) and anabolic processes (the synthesis of components such as proteins, lipids, and nucleic acids, which costs energy). Cellular (or intermediary) metabolism is organized in separate chemical pathways formed by a chain of linked enzymatic reactions in which the product of one step is the substrate for the next. A small set of cofactors, nonprotein compounds that are required for an enzymatic activity, is used in a multitude of reactions to mediate the transfer of chemical groups (see Tables 1, 2 for abbreviations of key metabolites and metabolic enzymes). A classic example is nicotinamide (NAM) adenine dinucleotide (NAD), which exists in an oxidized (NAD+) or reduced (NADH) form. NAD+ is used as an electron acceptor by dehydrogenases in a wide variety of pathways to remove electrons from their substrate, producing NADH. Conversely, NADH serves as an electron donor for reductases (yielding NAD+). Thus, cofactors like NAD+/NADH are used broadly and recycled continuously in metabolic reactions. In eukaryotic cells, the functional specialization of metabolic pathways is enabled by compartmentalization. For example, oxidative phosphorylation and the tricarboxylic acid (TCA) cycle take place on the inner membrane of mitochondria, but glycolysis occurs in the cytosol. The bulk of intermediary metabolism happens in the cytoplasm, whereas the nucleus is largely dedicated to the replication, maintenance, and expression of the eukaryotic genome (Fig. 1).
Table 1.
Metabolic enzymes and their function
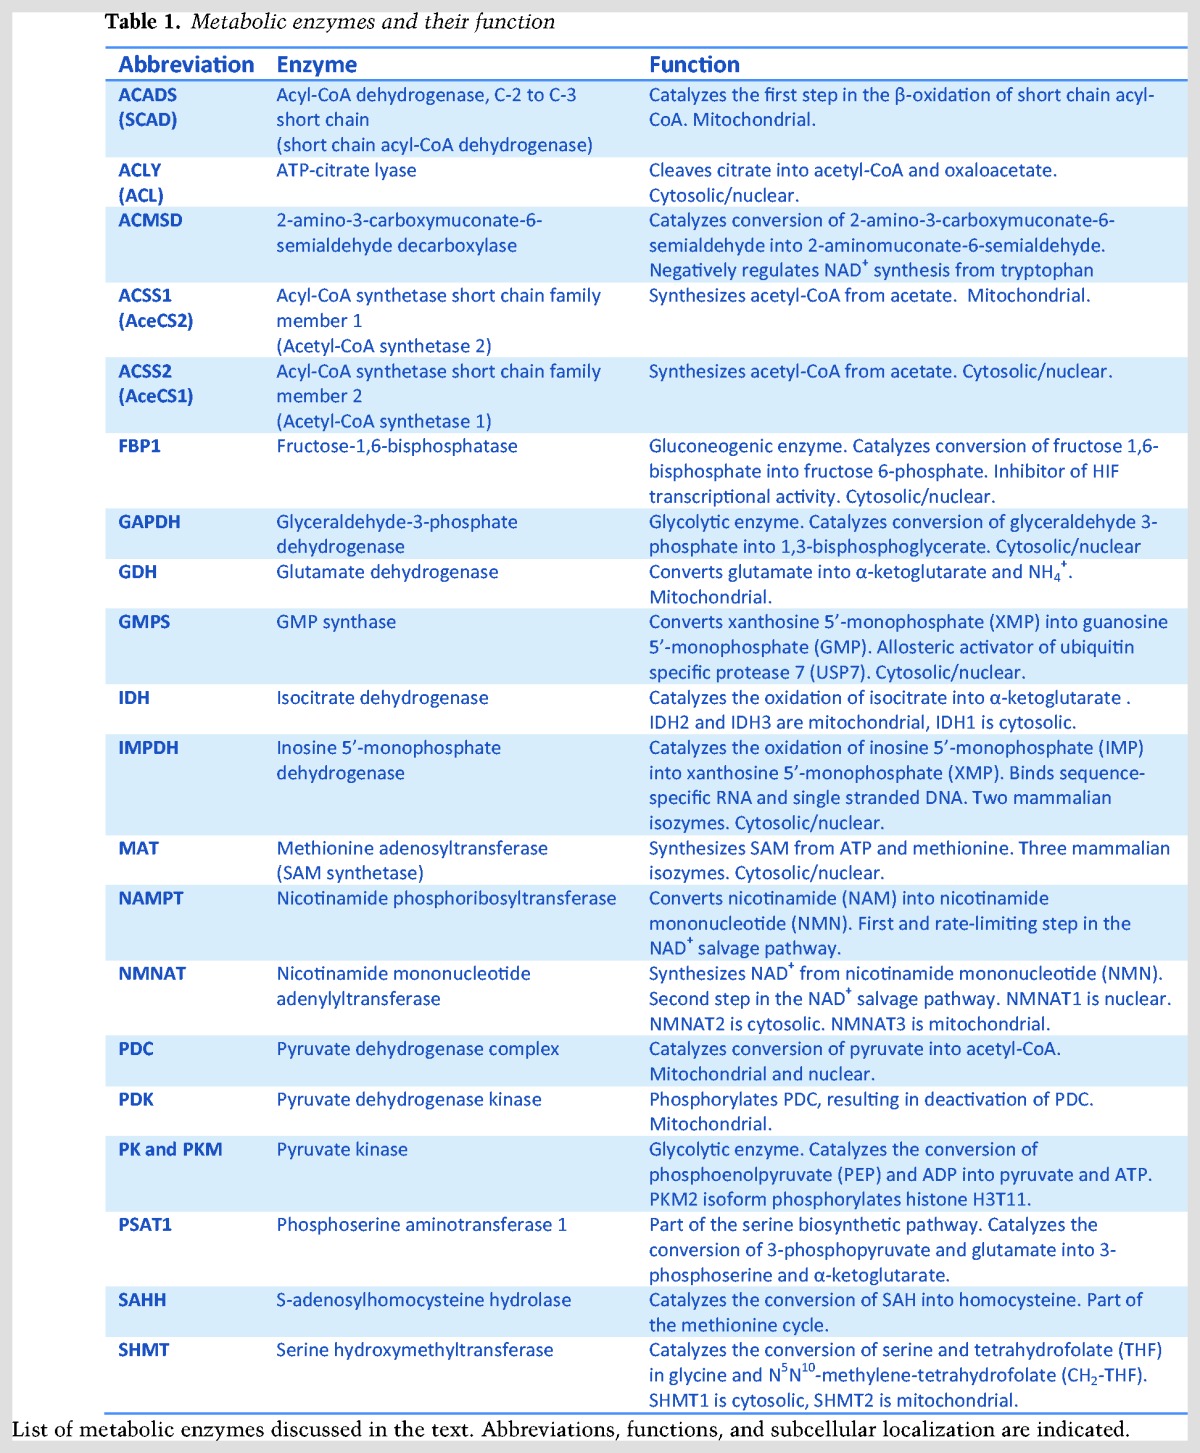
Table 2.
Metabolites involved in chromatin regulation
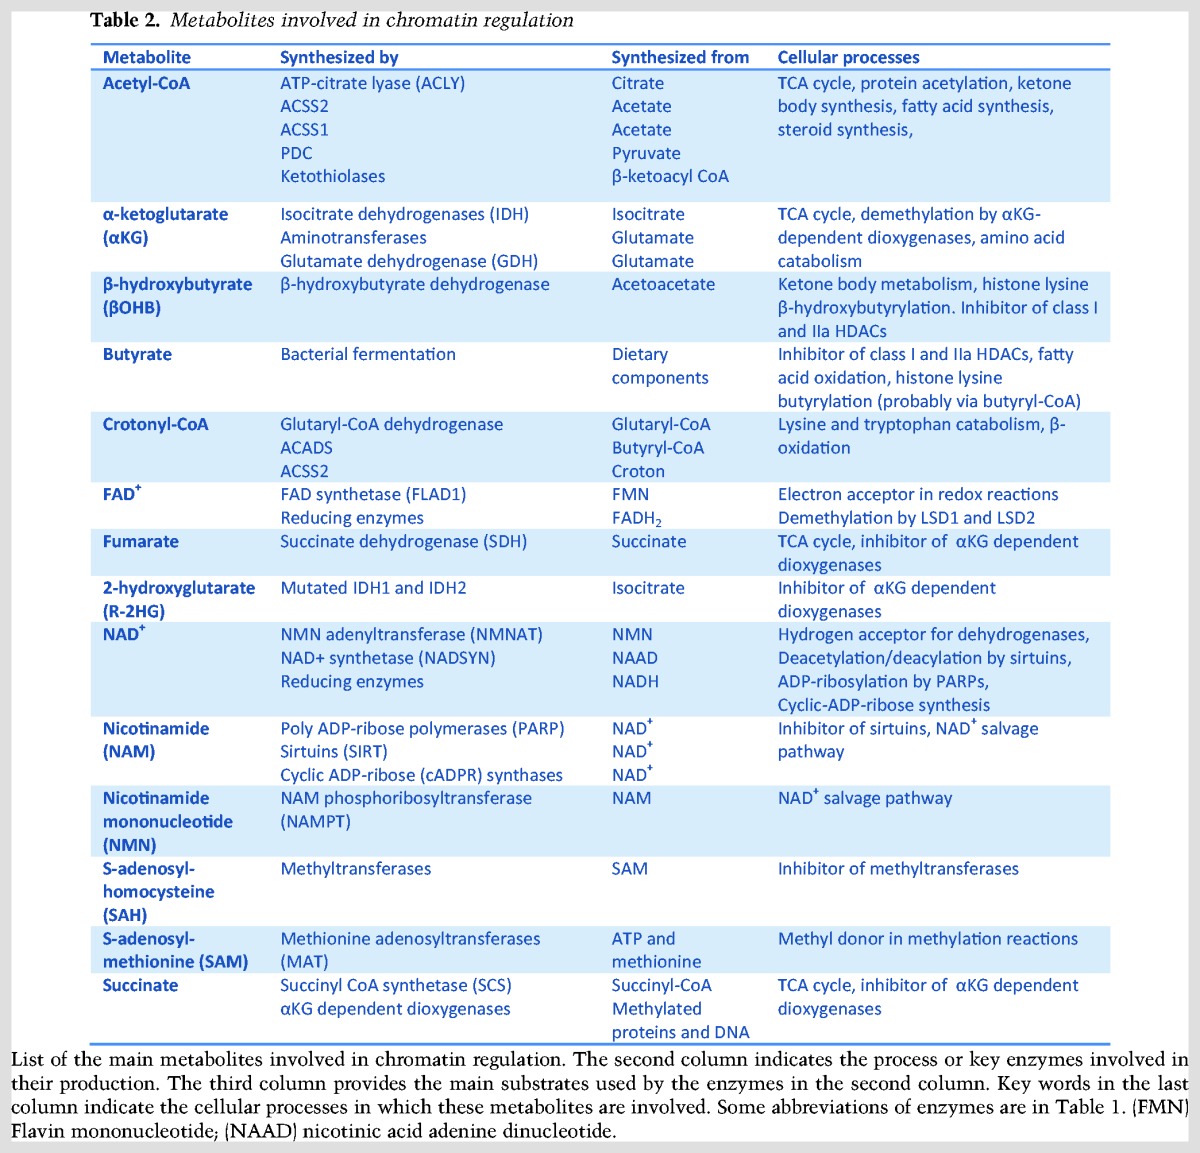
Figure 1.
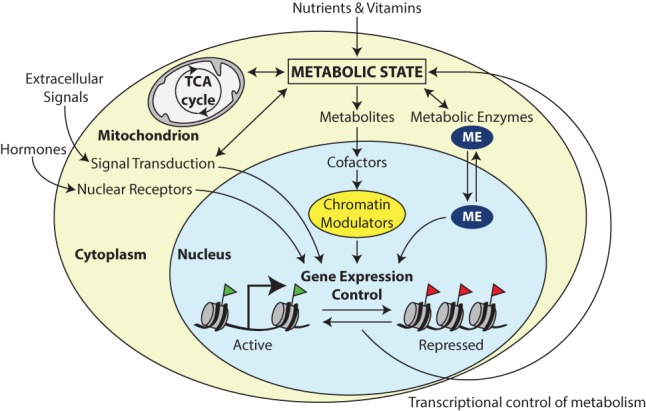
The interface between metabolism and transcription. Specialized transcription factors that are activated by metabolic sensors or extracellular signals, such as hormones, direct a transcriptional response to changes in metabolic state. In addition, key components of intermediary metabolism are cofactors or cosubstrates of chromatin-modifying enzymes. Therefore, changes in cofactor availability may affect chromatin structure and gene expression. Finally, specialized metabolic enzymes (MEs) do double duty as regulators of chromatin and transcription. Frequently, cytoplasmic–nuclear partitioning is used as a regulatory mechanism to link metabolic state to transcriptional outcomes.
Control of gene expression underlies cell differentiation and development and allows a cell to respond to signals and environmental changes. Gene transcription by DNA-dependent RNA polymerases is the primary level at which genes are regulated. Eukaryotic nuclear genes are transcribed by three different RNA polymerases (polymerase I [Pol I], Pol II, and Pol III). RNA Pol I transcribes most ribosomal RNA genes, whereas RNA Pol III transcribes mainly tRNAs, 5S RNA, and some additional small RNAs. Thus, Pol I and Pol III transcription is responsible for major components of the protein synthesis machinery and is closely linked to nutrient availability and cell growth (Campbell and White 2014). RNA Pol II and a set of auxiliary general (or basal) transcription factors are responsible for the expression of all protein-encoding genes and a diverse group of regulatory noncoding RNA genes (Sainsbury et al. 2015). The differential regulation of RNA Pol II initiation and elongation is fundamental to gene expression during development, homeostasis, and disease. Sequence-specific DNA-binding transcription factors that bind promoters and enhancer elements impose gene selectivity on RNA Pol II transcription (Levine et al. 2014; Koster et al. 2015). These transcription factors function through the recruitment of transcriptional corepressors or coactivators to regulatory DNA elements. Many of these transcriptional coregulators target the structure of chromatin to either enable or block gene transcription.
The packaging of eukaryotic genomic DNA into chromatin constitutes a major level of gene transcription control (Koster et al. 2015; Venkatesh and Workman 2015; Allis and Jenuwein 2016). The nucleosome is the basic repeat unit of eukaryotic chromatin, comprising 147 base pairs (bp) of DNA wrapped tightly around a protein core formed by two copies each of the core histones: H2A, H2B, H3, and H4 (Luger et al. 1997). Put simply, nucleosomes create a barrier to the accessibility of genes and regulatory DNA sequences, thereby controlling transcription. Consequently, by mediating the assembly, sliding, restructuring, or ejection of nucleosomes, ATP-dependent chromatin remodeling factors play a central role in the regulation of gene expression (Venkatesh and Workman 2015). A distinct biochemical mechanism involves a plethora of PTMs of specific residues within the histone N-terminal tails, which protrude from the nucleosome. These modifications, including acetylation, methylation, and phosphorylation, can modulate the folding of the chromatin fiber or direct recruitment of regulatory proteins, such as transcription factors or other chromatin regulators.
Transcriptional activity is intimately associated with specific histone modifications (Patel and Wang 2013; Zentner and Henikoff 2013; Swygert and Peterson 2014; Allis and Jenuwein 2016). For example, acetylation of histone H3 Lys27 (H3K27ac) marks active genes, whereas trimethylation of the same residue (H3K27me3) by the Polycomb-repressive complex 2 (PRC2) leads to gene silencing. Histone acetylation is generally associated with active chromatin irrespective of which residue is modified. In contrast, the consequences of histone methylation are determined by the specific residue that is targeted or even by the number of methyl groups added. Methylation of H3K4, H3K36, or H3K79 is usually associated with active transcription, whereas methylation of H3K9, H3K20, or H3K27 marks transcriptionally repressed chromatin. The recognition of histone PTMs by specific protein domains is important for the formation of repressive or active chromatin structures (Allis and Jenuwein 2016). For example, the bromodomain acts as an acetyl-lysine-binding module, enhancing the recruitment of transcription factors to chromatin. In contrast, the binding of the chromodomain of HP1 to H3K9me3 mediates heterochromatin formation. It is important to note that chromatin PTMs are dynamic; they are continuously placed and removed by antagonizing sets of enzymes. Moreover, enzymes that modify histones also target and modulate the activity of transcription factors (and other proteins). Thus, caution should be used in equating the regulatory role of a chromatin-modifying enzyme to a particular histone PTM. Reflecting their key role in gene control, cancer genome sequencing studies revealed that chromatin-modulating enzymes are frequently mutated in human cancers (Laugesen and Helin 2014; Masliah-Planchon et al. 2015; Morgan and Shilatifard 2015).
The DNA itself is also subject to modifications. In particular, methylation of cytosines (5-methylcytosine [5mC]) by DNA methyltransferases (DNMTs) within CpG islands in vertebrate genomes is linked tightly to gene transcription (Schübeler 2015). CpG islands, the most common promoter motifs in vertebrate genomes, are GC-rich DNA sequences of several hundreds of base pairs that are highly enriched for CpG dinucleotides. CpG promoters are stably silenced by a high level of CpG methylation. Many tumors are characterized by aberrant CpG island methylation, which is referred to as a CpG island methylator phenotype (Toyota and Issa 1999). DNA methylation can be reversed passively (i.e., lost during several rounds of DNA replication) or removed actively by the ten-eleven translocation (TET) enzymes (Schübeler 2015; Rasmussen and Helin 2016). TET enzymes oxidize 5mC to 5-hydroxymethylcytosine (5hmC), which is the first step in active DNA demethylation. Moreover, 5hmC may function as a chromatin mark, but more research on this potential function is needed.
In summary, sequence-specific transcription factors provide gene specificity but act through the recruitment of coregulators. Many of these coregulators function by modulating chromatin structure; e.g., by opening it up to allow DNA access to other transcriptional regulators. Furthermore, histone PTMs can be recognized by selective regulatory proteins, including basal transcription factors or other histone-modulating enzymes. This way, chromatin modifications can lead to a cascade of events that either promote or block gene expression.
The interface between metabolism and gene expression
Whereas some aspects of the coordination of metabolism and gene expression are well understood, others are still largely speculative. Specialized transcription factors are activated in response to changes in metabolism and elicit the appropriate changes in gene expression (Fig. 1). For example, unactivated, the transcription factor sterol regulatory element-binding protein (SREBP) is anchored to the membrane of the endoplasmatic reticulum. When sterol levels become low, SREBP is cleaved, and an N-terminal transcriptionally active version is released and translocates to the nucleus. Here, it activates genes encoding sterol biosynthetic enzymes (Raghow et al. 2008). Likewise, nuclear receptors mediate transcriptional responses to steroid hormones, thyroid hormone, and vitamins A and D (Evans and Mangelsdorf 2014). Thus, by controlling the expression of various metabolic enzymes, transcription factors such as SREBP and nuclear receptors regulate the metabolic state of cells.
Eukaryotic cells harbor two kinases that are specifically adapted to sense metabolic state. The mechanistic target of rapamycin (mTOR) is a kinase that has a fundamental role in integrating both intracellular and extracellular signals (Kennedy and Lamming 2016). mTOR is activated in response to nutrients or growth factors and serves as a central regulator of cell homeostasis and growth. The AMP-activated protein kinase (AMPK) system acts as a sensor of cellular energy status (Burkewitz et al. 2014). AMPK is activated by an increase in the cellular AMP/ATP ratio and then switches on catabolic pathways that generate ATP while repressing ATP-consuming anabolic processes. Current knowledge indicates that the mTOR and AMPK signaling pathways act predominantly at a post-transcriptional level. However, AMPK phosphorylates histone H2B to activate gene transcription in response to cellular stress (Bungard et al. 2010).
Virtually all enzymes that modify chromatin rely on cofactors or substrates that are core metabolites of intermediary metabolism (Fig. 2). These metabolites may thus provide an alternate way to coordinate gene regulation with metabolic state. Histone acetyltransferases (HATs) use acetyl-CoA as an acetyl donor (Fig. 3A). HATs are also called lysine acetyltransferases (KATs) to reflect that they acetylate many other proteins in addition to histones. Histone acetylation is associated with active chromatin and is removed by histone deacetylases (HDACs; also called lysine deacetylases [KDACs]) that are part of transcriptional repressor complexes. Most HDACs require Zn2+ and use water as nucleophile in the deacetylation reaction. The sirtuins (class III HDACs), however, consume NAD+ as a cosubstrate, converting it into NAM and O-acetyl-ADP-ribose (Fig. 3A).
Figure 2.

Cofactors and cosubstrates of intermediary metabolism that are involved in chromatin regulation. Note that the schematic representation of key metabolic pathways is simplified. To emphasize the steps discussed in the text, we omitted multiple steps and connections between pathways. (3-PG) 3-phosphoglycerate; (3-P-PYR) 3-phosphopyruvate; (3-P-Ser) 3-phosphoserine; (THF) tetrahydrofolate; (10-fTHF) N10-formyl-THF; (ac) acetyl; (Ac-CoA) acetyl-CoA; (Acet.) acetate; (αKG) α-ketoglutarate; (ar) ADP-ribosyl; (βOHB) β-hydroxybutyrate; (β-oxid.) β-oxidation; (but) butyrate; (CH2-THF) N5N10-methylene-THF; (CH3-THF) N5-methyl-THF; (cit) citrate; (FAD) Flavin adenine dinucleotide; (fum) fumarate; (HCO−2) formate; (hCys) homocysteine; (icit) isocitrate; (JMJC) Jumonji C domain-containing demethylase; (KMT) lysine methyltransferase; (lac) lactate; (LSD) lysine-specific demethylase; (Mal-CoA) malonyl-CoA; (me) methyl; (Met) methionine; (NA) nicotinic acid; (NR) NAM riboside; (PARP) poly-ADP-ribose polymerase; (pep) phosphoenolpyruvate; (pyr) pyruvate; (PRMT) protein arginine methyltransferase; (R-2HG) R-enantiomer of 2-hydroxyglutarate; (SAM) S-adenosylmethionine; (SAH) S-adenosylhomocysteine; (suc) succinate; (TET) TET DNA demethylase; (Trp) tryptophan;(vit) vitamin.
Figure 3.
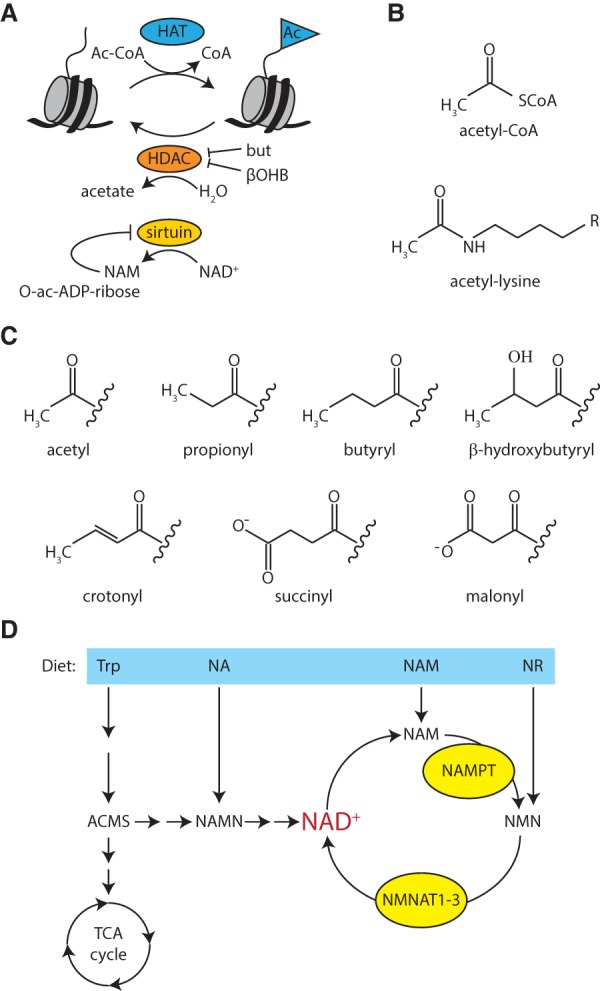
Histone acetylation and deacetylation. (A) Histone lysines are acetylated by HATs, which use acetyl-CoA as a cosubstrate. HDACs are grouped in four classes. Classes I, II, and IV are Zn2+-dependent and release acetate as a coproduct. Sirtuins (class III HDACs) consume NAD+ and produce NAM and O-acetyl-ADP-ribose. (B) Chemical structures of acetyl-CoA and acetyl-lysine. (C) Chemical structures of acyl modifications found on histones. (D) Schematic overview of NAD+ biosynthetic pathways. (ACMS) 2-amino-3-carboxymuconate-6-semialdehyde; (but) butyrate; (NAMN) NA mononucleotide; (NAMPT) NAM phosphoribosyltransferase; (NMN) NAM mononucleotide; (NMNAT) NMN adenyltransferase; (Trp) tryptophan.
Histone methylation is mediated by lysine methyltransferases (KMTs; also called histone methyltransferases [HMTs]) and protein arginine methyltransferases (PRMTs). Both classes of enzymes use S-adenosylmethionine (SAM) as methyl donor (Figs. 2, 4A). SAM is also the methyl donor for DNMTs that methylate CpGs. Removal of methyl groups from lysine residues in histones involves two different classes of lysine demethylases (KDMs; also called histone demethylases [HDMs]). Demethylation by the first KDM identified, LSD1 (lysine-specific demethylase 1) (Shi et al. 2004), or its paralog, LSD2, requires the reduction of Flavin adenine dinucleotide (FAD). The Jumonji C (JmjC) domain-containing KDMs catalyze a different demethylation reaction that requires α-ketoglutarate (αKG), O2, and Fe(II) (Walport et al. 2012). Hydroxylation of 5meC in DNA by TET enzymes involves a similar reaction. Collectively, these demethylases are known as αKG-dependent dioxygenases. As we discuss below, fluctuations in metabolites that function as cofactors for chromatin modifications may provide a mechanism to couple a transcriptional response to changes in nutrient status.
Figure 4.
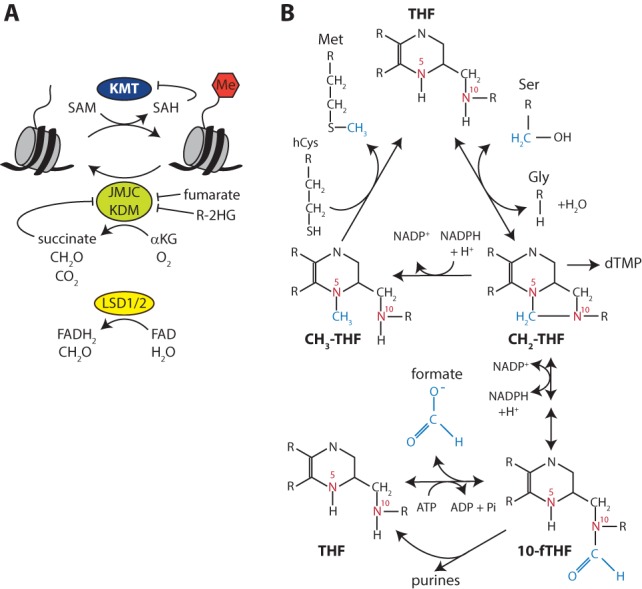
Histone methylation and demethylation. (A) Histones are methylated by KMTs, which require SAM as a cosubstrate. Two different classes of KDMs can remove a methyl group. LSD1/2 require FAD as an electron acceptor. The JmjC domain-containing KDMs use αKG as a cosubstrate. Fumarate, succinate, and R-2HG are competitive inhibitors. (FADH2) FAD, reduced; (Me) methyl. (B) Schematic representation of folate-mediated one-carbon metabolism in the cytosol. (hCys) Homocysteine; (Met) methionine; (NADP+) NAD phosphate.
Finally, a small but increasing number of metabolic enzymes have been identified that are directly involved in chromatin and transcription control. These observations suggest that these dual-function enzymes might act as sensors of metabolic state and provide a novel connection between metabolism and gene control (Fig. 1). Interestingly, gene regulation by metabolic enzymes involves a wide variety of molecular mechanisms, sometimes independent of enzymatic activity. Thus, the control of metabolism by transcription factors, which determine the expression of key metabolic enzymes, is balanced by metabolites used by chromatin-modulating enzymes or metabolic enzymes that function as transcriptional coregulators.
Changes in acetyl-CoA metabolism influence chromatin structure
Histone acetylation modulates chromatin structure by neutralizing the positive charge of the lysine residues, thus weakening the electrostatic interactions between DNA and histones and between adjacent nucleosomes (Shogren-Knaak et al. 2006). This creates a more open, accessible chromatin structure that is conducive to transcription. In addition, histone acetylation creates binding sites recognized by bromodomain-containing regulators, which typically promote gene activation (Filippakopoulos and Knapp 2014). The acetyl donor for histone acetylation, acetyl-CoA, is a central metabolite used in a plethora of cellular reactions (Fig. 2, 3A,B). It plays a key role in the TCA cycle, fueling oxidation for energy production in the mitochondria, but is also used in anabolic pathways for cellular growth. Cells contain two separate pools of acetyl-CoA: a mitochondrial pool and a combined nuclear and cytosolic pool, which is united by free diffusion of acetyl-CoA through the nuclear pores. Glycolysis and degradation of specific amino acids, such as alanine or serine, yield pyruvate, which can be oxidized into acetyl-CoA by the mitochondrial pyruvate dehydrogenase complex (PDC). In addition, β-oxidation of fatty acids and ketone bodies also contributes to the mitochondrial acetyl-CoA pool. Apart from oxidation in the TCA cycle, acetyl-CoA is also used for cellular processes outside the mitochondrion. These include the biosynthesis of fatty acids and sterols and also acetylation of proteins, including histones. The inner mitochondrial membrane does not have a transporter for acetyl-CoA; therefore, acetyl units are transported into the cytosol as citrate. Subsequently, ATP-citrate lyase (ACLY) will cleave citrate into acetyl-CoA and oxaloacetate at the expense of ATP and CoA. Alternatively, cytosolic acetyl-CoA can be produced from acetate by acyl-CoA synthetase short chain family member 2 (ACSS2). In older literature, ACSS2 is also known as acetyl-CoA synthetase 1 (AceCS1). Note that whereas acetate is a major biosynthetic substrate in yeast, it normally plays only a minor role in mammalian cells (Menzies et al. 2016).
Cellular acetyl-CoA levels fluctuate in response to a number of factors, which include nutrient availability, the circadian clock, development, and aging. Fasting or caloric restriction leads to a drop of acetyl-CoA levels in heart, muscle, and liver tissue (Hebert et al. 2013; Mariño et al. 2014). Acetyl-CoA levels have even been shown to vary during embryonic development and aging (Tsuchiya et al. 2014; Peleg et al. 2016). These observations raise the question of whether changes in acetyl-CoA levels may have an impact on chromatin acetylation and transcription. Indeed, reduction of acetyl-CoA production by siRNA-mediated knockdown of either ACLY or PDC results in hypoacetylation of histones in mammalian cells (Wellen et al. 2009; Sutendra et al. 2014). In contrast, knockdown of ACSS2 has no effect on global histone acetylation, reflecting that acetate is normally not a major biosynthetic substrate in mammalian cells. However, it should be kept in mind that, under certain conditions (e.g., in cancer cells), acetate can become an important source of acetyl-CoA.
Studies in yeast provided the first physiological evidence for the close interconnectivity between nutrient availability and histone acetylation. Yeast cells grown under limited glucose conditions oscillate through three metabolic phases—the so-called yeast metabolic cycle (YMC) (Tu et al. 2005). The level of acetyl-CoA oscillates with the same periodicity as the YMC and peaks in the oxidative phase, which is characterized by high oxygen consumption and the induction of genes involved in growth. The periodicity of acetyl-CoA levels is mirrored by the levels of genome-wide histone acetylation in a HAT-dependent manner (Cai et al. 2011). The higher level of chromatin acetylation is accompanied by the induction of ∼1000 growth-related genes. Moreover, increased glucose availability in stationary yeast cells leads to higher levels of acetyl-CoA synthesis and global histone acetylation (Friis et al. 2009). The observation that availability of acetyl-CoA determines the level of histone acetylation suggests that HATs are substrate-limited enzymes. A related connection between fluctuating acetyl-CoA levels and histone acetylation has been made in mammalian cells. In various cancer cell lines, high levels of glucose drive increasing amounts of acetyl-CoA, accompanied by a boost in histone acetylation (Lee et al. 2014). A key question is whether fluctuations in acetyl-CoA trigger a specific transcriptional response. The studies on the YMC suggest that fluctuations in acetyl-CoA can indeed cause specific effects on gene expression. Selectivity may result from the gene-specific recruitment of HATs that have a differential response to acetyl-CoA concentrations.
Nuclear synthesis of acetyl-CoA
Acetyl-CoA can diffuse freely through the nuclear pores; thus, at first glance, nuclear synthesis would not be needed. However, multiple enzymes involved in acetyl-CoA synthesis, including ACSS2 and ACLY, have been observed in the nucleus (Takahashi et al. 2006; Wellen et al. 2009; Ariyannur et al. 2010; Comerford et al. 2014). Moreover, it has been reported that a functional PDC can translocate from the mitochondria to the nucleus during S phase of the cell cycle in response to serum, epidermal growth factor, or mitochondrial stress (Sutendra et al. 2014). Unexpectedly, nuclear translocation of the PDC is required for normal acetylation of histone H3 during S phase (Sutendra et al. 2014). Although nuclear levels of acetyl-CoA were not determined, these observations suggest that histone acetylation may depend on locally produced acetyl-CoA by the PDC. Pyruvate, the end product of the glycolysis, fuels the PDC. However, there is no evidence for nuclear glycolysis, although many glycolytic enzymes have been observed in the nucleus (Boukouris et al. 2016). For some of those, like glyceraldehyde-3-phosphate dehydrogenase (GAPDH), it seems clear that they are not enzymatically active in the nucleus but perform moonlighting functions (see below). Pyruvate kinase (PK) has been reported in the nucleus and might produce pyruvate from phosphoenolpyruvate (PEP). Alternatively, pyruvate might diffuse into the nucleus from the cytosol and then serve as a substrate for the PDC. In summary, localized acetyl-CoA production by ACSS2, ACLY, and the PDC might occur at specific locations in the nucleus, possibly creating a hub of HAT activity.
Acetyl-CoA dynamics and chromatin acetylation in cancer cells
Cell differentiation or oncogenic transformation can have a major impact on intermediary metabolism. Typical differentiated cells have a low rate of glycolysis, the conversion of glucose into pyruvate. Pyruvate is then oxidized in the mitochondrial TCA cycle to generate ATP. Most cancer cells, however, are characterized by a high rate of glycolysis followed by lactic acid fermentation in the cytosol. In noncancerous cells, lactate is normally generated only under low-oxygen conditions. Therefore, the cellular production of lactate in the presence of oxygen is termed “aerobic glycolysis.” The shift in cancer cells from mitochondrial oxidative respiration to aerobic glycolysis is called the Warburg effect. Compared with oxidative respiration in mitochondria, aerobic glycolysis is a very inefficient route for ATP production. The conversion of glucose into lactate yields only two ATP molecules per glucose molecule, while the complete oxidation of glucose into CO2 and H2O yields ∼32 ATP molecules per molecule glucose. The advantage for cancer (and other fast-proliferating cells) is that the glycolysis intermediates provide the building blocks for anabolic biosynthesis to support cell growth and proliferation. Similar metabolic reprogramming occurs during animal development. For example, during the ∼4 d of Drosophila larval development, a switch to aerobic glycolysis supports an almost 200-fold increase in body mass (Tennessen et al. 2011, 2014). This change in metabolism is directed by the fly estrogen-related receptor, which functions as a transcriptional master regulator of development (Tennessen et al. 2011, 2014). Thus, developmental progression and metabolic reprogramming are tightly coupled. In summary, a metabolic switch to aerobic glycolysis can be a physiological response to enable growth but can also be part of oncogenic transformation.
In spite of the Warburg effect in cancer cells, under conditions of sufficient oxygen (normoxia), the majority of acetyl-CoA used for protein acetylation is still glucose derived (Evertts et al. 2013; Schug et al. 2015). A fraction of the pyruvate produced by glycolysis is shuttled into the mitochondrial TCA cycle and used for citrate production. In addition, tumor cells often activate ACLY via the Akt protein kinase, further stimulating acetyl-CoA production from glucose (Lee et al. 2014). However, the hypoxic conditions in solid tumors lead to an increased conversion of glucose to lactate as the mitochondria become oxygen-deprived. This switch is enhanced by the hypoxia-induced transcription factor 1 (HIF1), which activates glycolytic enzymes and induces pyruvate dehydrogenase kinase (PDK), which suppresses the TCA cycle and respiration (Kim et al. 2006; Papandreou et al. 2006). Under these conditions, cancer cells often use exogenous acetate as an alternate carbon source for acetyl-CoA production by ACSS2 (Comerford et al. 2014; Mashimo et al. 2014; Schug et al. 2015). Although acetate is a low-concentration serum metabolite, it has been suggested that the adaptation of a tumor cell toward a suboptimal carbon source might give it a competitive advantage over normal cells (Comerford et al. 2014).
The dynamics of histone PTMs, including acetylation, are typically analyzed in the context of gene regulation. However, bulk levels of chromatin PTMs can vary considerably between different tissues or developmental stages or in cancer cells. In particular, low levels of global histone acetylation or methylation are associated with more aggressive cancers and poor patient outcome (Kurdistani 2011, 2014; Greer and Shi 2012). These global changes are difficult to reconcile with gene-specific transcription programs. Given the high abundance of histones, however, chromatin acetylation may have effects beyond gene control. Acetylated histones might function as a storage site for acetate to be released by HDACs when the need arises (Kurdistani 2014). Acetate may then be used for acetyl-CoA production (Comerford et al. 2014). Kurdistani and coworkers (McBrian et al. 2013; Kurdistani 2014) made a compelling argument for histone acetylation as a regulator of intracellular pH. Lowering of the intracellular pH results in global deacetylation of histones with concomitant secretion of acetate anions and protons into the extracellular environment. Conversely, a higher pH results in increased histone acetylation and reduced coexport of acetate and protons. These observations suggest that chromatin function is not limited to the storage and expression of genetic information. Rather, chromatin may play an integral role in the control of cellular physiology by acting as rheostat of carbon flux and cellular pH. Finally, acetate consumption might be an adaptation of tumor cells to increased acetate secretion by surrounding stromal cells, which is a response to acidification due to lactate produced by cancer cells.
The role of acetyl-CoA in stem cell pluripotency
There is an increasing appreciation that metabolic state influences whether a stem cell will self-renew or undergo differentiation (Ito and Suda 2014; Ryall et al. 2015a). Thus, metabolic pathways may provide cues to gene expression programs that control cell fate. Pluripotent stem cells (PSCs) are characterized by an open chromatin structure, which is reflected in a low abundance of heterochromatin and enrichment of active chromatin modifications, such as histone H3 and H4 acetylation and H3K4me3 (Gaspar-Maia et al. 2011). To establish and maintain these histone modifications, PSCs have a metabolic profile that is distinct from more differentiated cells.
One of the characteristics of both human embryonic stem cells (hESCs) and mouse ESCs (mESCs) is an elevated level of acetyl-CoA, which drops upon differentiation (Wang et al. 2009; Moussaieff et al. 2015). However, there are important differences between the two species. mESCs, but not hESCs, are dependent on a threonine catabolism program driven by the enzyme threonine dehydrogenase. This leads to higher levels of acetyl-CoA and fuels the one-carbon cycle via the generation of glycine (Wang et al. 2009). Humans lack this enzyme, and hESCs acquire high levels of acetyl-CoA from aerobic glycolysis and low levels of oxidative phosphorylation (Moussaieff et al. 2015). Instead of being oxidized in the TCA cycle, mitochondrial acetyl-CoA is exported to the cytosol as citrate. This somewhat resembles the Warburg effect in cancer cells, but there is an intriguing distinction. Many cancer cells are killed by redirection of pyruvate from lactate to acetyl-CoA by inhibition of PDK, which is an inhibitor of the PDC (Bonnet et al. 2007). In contrast, inhibition of PDK in hESCs increases pluripotency without affecting viability (Moussaieff et al. 2015). This suggests that, in hESCs, aerobic glycolysis is required for maintenance of sufficient acetyl-CoA levels, while, in cancer cells, the primary function is generating anabolic building blocks to fuel proliferation. High levels of glycolysis-derived acetyl-CoA in ESCs may serve to ensure high levels of histone acetylation to maintain chromatin plasticity, enabling pluripotency (Moussaieff et al. 2015). However, cell differentiation does not always correlate with a decrease in acetyl-CoA and histone acetylation. For example, histone acetylation increases upon differentiation of preadipocytes into adipocytes, which requires the activity of ACLY (Wellen et al. 2009).
Histone acylation beyond acetylation
The mass spectrometry revolution of the last decade enabled the discovery of new histone PTMs, including a range of acylation reactions other than acetylation (e.g., see Tan et al. 2011; Hirschey and Zhao 2015). These include propionylation, butyrylation, β-hydroxybutyrylation, crotonylation, malonylation, and succinylation of lysine residues within histones (Fig. 3C). Similar to acetylation, the acyl groups are most likely donated by the corresponding acyl-CoA. Exciting recent studies suggest that these novel histone acylations can play a major role in metabolic regulation of gene expression.
Prolonged fasting, restricted intake of carbohydrates, or untreated diabetes mellitus type 1 induces the formation of ketone bodies in the liver, where fatty acids are broken down for energy production. Ketone bodies (acetoacetate, β-hydroxybutyrate [βOHB], and acetone) are secreted and serve as a source of energy in extrahepatic tissues, such as the heart, brain, or muscles. In these tissues, ketone bodies are converted into acetyl-CoA, which then is oxidized in the TCA cycle for ATP production. βOHB synthesis in the hepatic mitochondria starts with the condensation of acetoacetate out of two acetyl-CoA molecules originating from fatty acid or amino acid catabolism. Next, βOHB dehydrogenase reduces acetoacetate into βOHB, which is released into the bloodstream. During fasting, βOHB concentrations can range from 6–8 mM in healthy individuals to up to 25 mM during diabetic ketoacidosis (Laffel 1999). In addition to serving as a source of energy, βOHB may also leave its mark on chromatin (Shimazu et al. 2013; Xie et al. 2016).
βOHB, which is structurally related to the well-known HDAC inhibitor butyrate, can inhibit class I and IIa HDACs (Figs. 2, 3A; Shimazu et al. 2013). Both caloric restriction of mice and direct administration of βOHB resulted in enhanced global histone acetylation, consistent with decreased HDAC activity. Studies in cells provided additional evidence for the notion that βOHB can change gene expression through inhibition of HDAC1 and HDACII (Shimazu et al. 2013). The connection with the FOXO3a transcription factors suggests a molecular route to gene selectivity. An alternative scenario centers on the identification of lysine β-hydroxybutyrylation (Kbhb) as a novel histone PTM (Xie et al. 2016). Xie et al. (2016) observed that starvation of mice or treatment of tissue culture cells with βOHB resulted in a 10-fold to 40-fold increase of histone Kbhb but only marginal changes in histone acetylation. β-Hydroxybutyrylation occurs on 44 histone residues, including many that are also targets for acetylation or methylation, such as H3K9. Like H3K9ac, H3K9bhb was found to be associated with active gene transcription. Thus, histone Kbhb provides a chromatin mark directly connected to metabolic state, most likely via the synthesis of βOHB-CoA. A key question that now needs to be addressed is how this modification may direct adaptive gene transcription programs; e.g., through collaboration with specific transcription factors.
Butyrate is a major metabolite produced by bacterial fermentation of dietary fiber in the colon. Butyrate is an important food source for colonocytes, the epithelial cells that line the colon, which use it to fuel β-oxidation for energy production (Guilloteau et al. 2010). Excess butyrate is passed to the liver via the portal vein. However, concentrations in the peripheral circulation are very low, making a direct effect of butyrate via blood circulation unlikely (Guilloteau et al. 2010). Butyrate is of particular interest because it can inhibit the growth of cancerous, but not noncancerous, colonocytes (Lupton 2004). Butyrate has long been used as a cell-differentiating agent and is a well-established inhibitor of class I and class IIa HDACs (Figs. 2, 3A; Boffa et al. 1978, Sealy and Chalkley 1978). In colonocytes, butyrate can boost histone acetylation by inhibition of HDACs or by increasing acetyl-CoA levels to stimulate HAT activity (Donohoe et al. 2012). Interestingly, the metabolic state of the cell can determine which pathway is dominant. In cancerous colonocytes (which favor glycolysis over mitochondrial oxidation), only limited amounts of butyrate are metabolized, leading to its accumulation and HDAC inhibition. In noncancerous colonocytes, butyrate is metabolized into acetyl-CoA, which stimulates HAT activity. The inhibition of HDACs or stimulation of HATs may lead to different patterns of gene expression and physiological outcomes (Donohoe et al. 2012). These results suggest that metabolic state (i.e., the Warburg effect) can determine the effect of butyrate on chromatin acetylation and cell proliferation.
However, there is more to butyrate than its effects on histone acetylation. Histones have been found to be butyrylated on multiple lysines (Chen et al. 2007; Goudarzi et al. 2016). Both histone lysine butyrylation (Kbu) and lysine crotonylation (Kcro) are associated with active transcription (Tan et al. 2011). In vitro, both butyrylation and crotonylation can be catalyzed by the HATs p300 and CBP (Chen et al. 2007; Sabari et al. 2015; Goudarzi et al. 2016). Moreover, knockdown experiments support the notion that p300/CBP mediate crotonylation in cells (Sabari et al. 2015). Reducing the nucleocytosolic amount of acetyl-CoA by depletion of ACLY or PDC not only decreases H3K18ac but also increases H3K18cr. This indicates that acetyl-CoA and crotonyl-CoA compete with each other in p300/CBP-catalyzed reactions and suggests that the relative availability of short chain fatty acids may modulate chromatin acylation status.
This raises the following question: Do different acylation marks lead to different transcriptional outcomes? Present evidence indicates that all acylation marks are associated with active chromatin. Acetylation, butyrylation, β-hydroxybutyrylation, and crotonylation will all neutralize the positive charge of the ε-amino group of lysine and may thus create a more open chromatin structure. Alternatively, different forms of acylation may affect the histone binding of regulatory factors. Bromodomains act as an acetyl-lysine-binding module (Dhalluin et al. 1999; Sanchez and Zhou 2009). Due to the larger size of the butyryl group, bromodomains have a >10-fold lower affinity for butyrylated lysines than acetylated lysines (Goudarzi et al. 2016; Li et al. 2016). Recently, YEATS domains have been proposed as crotonylated lysine-recognizing modules, as they have a twofold to threefold lower dissociation constant (Kd) for Kcr than Kac (Li et al. 2016). It remains to be determined whether these differences in binding affinities for acylated histones are relevant for gene regulation in vivo.
NAD in chromatin regulation
NAD+ plays a crucial role in the intermediary metabolism of all living organism. As an enzymatic cofactor, NAD+ is a key electron carrier in a plethora of cellular redox reactions. As a cosubstrate, NAD+ is consumed in sirtuin-catalyzed deacetylation reactions, yielding NAM and O-acetyl-ADP-ribose (Figs. 2, 3A). Two additional classes of enzymes metabolize NAD+ into NAM. These are poly-ADP-ribose polymerases (PARPs) and cyclic ADP-ribose (cADPR) synthases. The relatively unknown cADPR synthases (CD38 and its relative, CD157) produce the secondary messenger cADPR, which is involved in Ca2+ signaling (Cantó et al. 2015).
Sirtuins are protein deacetylases (and deacylases) conserved from bacteria to humans (Bheda et al. 2016). Sirtuins have been implicated in the regulation of circadian rhythm, mitochondrial metabolism, aging, and cancer (Imai and Guarente 2014; Chalkiadaki and Guarente 2015). There are seven mammalian sirtuins, which are localized in the mitochondria (SIRT3, SIRT4, and SIRT5), the nucleus (SIRT1, SIRT6, and SIRT7), or both the cytoplasm and nucleus (SIRT2). All nuclear sirtuins can deacetylate histones, but numerous additional substrates have been identified, including transcriptional factors, DNA repair proteins, and metabolic enzymes (Chalkiadaki and Guarente 2015; Bheda et al. 2016). Some sirtuins can also remove acyl modifications from histones. However, the in vivo relevance of this activity remains to be determined. PARPs transfer ADP-ribose subunits from NAD+ to target proteins, including itself and histones (PARylation). The PARP family is composed of 17 members that are involved in processes such as DNA repair, gene expression, and RNA regulation (Gibson and Kraus 2012; Bock et al. 2015). PARylation can modulate protein functions in several ways, including inhibition of protein–protein interaction or protein–nucleic acid interaction. Targets for PARylation include sequence-specific transcription factors, elongation factors, and histone-modifying enzymes. Studies in Drosophila and mammalian cells indicate that chromatin-associated PARylation correlates with transcribed genes and promotes elongation (Tulin and Spradling 2003, Krishnakumar et al. 2008, Petesch and Lis 2012, Gibson et al. 2016).
Diet, NAD+ metabolism, and protein deacetylation by sirtuins
One reason sirtuins have been the focus of intense study is the notion that they are key mediators of life span regulation in response to dietary changes. A central aspect of this theory is that NAD+ (and NADH) levels change based on diet and aging. NAD+ can be synthesized de novo from diverse dietary sources or regenerated from NAM via the salvage pathway (Fig. 3D; Cantó et al. 2015; Verdin 2015). Dietary sources include tryptophan or precursor molecules such as NAM riboside (NR), nicotinic acid (NA), and NAM. NR and NAM are collectively known as vitamin B3, and their dietary deficiency causes pellagra. NAD+ synthesis from tryptophan is inefficient because the intermediate 2-amino-3-carboxymuconate-6-semialdehyde (ACMS) is shuttled into the glutarate pathway by the enzyme ACMS decarboxylase (ACMSD), which leads to its complete oxidation into CO2 and H2O in the TCA cycle. NAD+ can be formed from tryptophan only if the amount of ACMS exceeds the enzymatic capacity of ACMSD.
The first and rate-limiting step in the salvage pathway is the conversion of NAM into NAM mononucleotide (NMN) by NAM phosphoribosyltransferase (NAMPT). NMN is subsequently converted into NAD by NMN adenyltransferase (NMNAT). In humans, there are three different isoforms of NMNAT with distinct tissue and subcellular localization. Only NMNAT1 appears to be nuclear. Notably, both NAMPT and NMNAT1 perform additional functions, independent of their catalytic activity. Extracellular NAMPT acts as a cytokine (Garten et al. 2015). NMNAT1 stimulates the catalytic activity of PARP1, independent of NAD+ synthesis (Berger et al. 2007; Zhang et al. 2012). Moreover, Drosophila NMNAT exhibits chaperone activity (Zhai et al. 2008). Thus, both enzymes in the NAD+ salvage pathway perform additional functions.
NAD+ synthesis not only is dependent on the availability of dietary precursors but can also be determined by total caloric content. Caloric restriction leads to a switch from glycolysis to fatty acid oxidation. One might expect that a reduction in consumed calories leads to less oxidation of nutrients in cells and tissues and, consequently, a diminished demand for the electron acceptor function of NAD+ (Kaelin and McKnight 2013). However, it has been reported that caloric restriction leads to increased levels of NAD+ (Rodgers et al. 2005; Yang et al. 2007; Chen et al. 2008; Fulco et al. 2008). This is believed to be a consequence of AMPK activation, which up-regulates NAMPT, the rate-limiting enzyme of the NAD+ salvage pathway (Yang et al. 2007; Fulco et al. 2008; Cantó et al. 2009). Conversely, mice fed on high-fat diets show decreased NAMPT and NAD+ levels (Yoshino et al. 2011). Increased levels of NAD+ may activate sirtuins, leading to the deacetylation of various cellular substrates.
Potentially relevant targets of the sirtuins include transcription factors such as peroxisome proliferator-activated receptor-γ-coactivator 1α (PGC1α), FOXO1, and FOXO3a, all of which are linked to mitochondrial and fatty acid metabolism (Cantó et al. 2009, 2010). Moreover, SIRT1 deacetylates and inhibits the glycolytic enzyme phosphoglycerate mutase-1 (PGAM-1) (Hallows et al. 2012). SIRT3 deacetylates and activates mitochondrial enzymes involved in fatty acid oxidation, including long chain coenzyme A dehydrogenase (LCAD) (Hirschey et al. 2010; Hebert et al. 2013). Conversely, long chain fatty acids stimulate SIRT6 deacetylation in vitro (Feldman et al. 2013). Thus, following dietary restriction, sirtuins mediate a metabolic shift from cytosolic glycolysis toward mitochondrial fatty acid oxidation through deacetylation of transcription factors and metabolic enzymes (Guarente 2013). Loss of sirtuin function may also play a role in metabolic reprogramming during oncogenesis (Chalkiadaki and Guarente 2015).
In addition to diet, NAD+ levels can be modulated by circadian rhythms and aging. The circadian clock influences expression of NAMPT and, consequently, NAD+ levels (Nakahata et al. 2009; Ramsey et al. 2009; Berger and Sassone-Corsi 2015). Intriguingly, several studies reported that NAD+ levels decline during aging (Yoshino et al. 2011, Massudi et al. 2012, Gomes et al. 2013; Mouchiroud et al. 2013; Camacho-Pereira et al. 2016). Possible explanations include accumulated DNA damage leading to increased NAD+ consumption by PARP1, up-regulation of NAD+ consumer CD38, or reduced levels of NAMPT. Alternatively, decline of mitochondrial function may cause a metabolic shift toward processes that lower the NAD+/NADH ratio. Recently, changes in NAD+/NADH ratio have also been implicated in the transcriptional programming of skeletal muscle stem cells (Ryall et al. 2015b).
Sirtuins and PARPS as NAD+ sensors
The effects of fluctuations in NAD+ levels on sirtuin and PARP activity remain poorly understood. Generally, reported changes in cellular NAD+ levels are less than twofold. Therefore (assuming Michaelis-Menten kinetics), to function as NAD+ sensors, the KM of sirtuins for NAD+ should be close to its physiological concentration. Unfortunately, due to compartmentalization and its association with proteins, it is difficult to accurately determine free NAD+ concentrations in cells and tissues. The usual method to measure total NAD+ levels involves acid extraction, which will also release protein-bound NAD+. Indeed, NAD+ levels are often reported as amounts per milligram of protein rather than concentration. Two-photon excitation microscopy in mammalian cells, which can determine the concentration of NADH but not that of NAD+, suggested a nuclear NADH concentration of ∼110–130 nM (Zhang et al. 2002). Using a generally accepted NAD+/NADH ratio of ∼700 under normal conditions, this would correspond to a nuclear NAD+ concentration of 70 µM. A recently developed biosensor revealed NAD+ concentrations in the cytosol, nucleus, and mitochondria of 106, 109, and 230 µM, respectively (Cambronne et al. 2016). The latter value is remarkably close to the estimated mitochondrial concentration of 245 µM measured by conventional methods (Yang et al. 2007).
The reported KM values of nuclear sirtuins are 95 µM (SIRT1), 83 µM (SIRT2), and 26 µM (SIRT6), while reported values for PARP1 are between 50 and 100 µM (Cantó et al. 2015). Taken together, the consensus emerges that nuclear NAD+ concentrations are within the range of the KM values of PARP1 and SIRT1/2. Moreover, inhibitory molecules such as NAM may modulate the apparent in vivo KM values for NAD+. Thus, it indeed seems reasonable that relatively subtle changes in nuclear NAD+ levels can modulate the activity of SIRT1, SIRT2, and PARP1, while SIRT6 is probably unresponsive to NAD+ fluctuations. The KM values for NAD+ of PARP1, SIRT1, and SIRT2 are very close, implying that they might compete for the same NAD+ pool. Moreover, SIRT6 (26 µM) and CD38 (15–25 µM) have even lower KM values for NAD+ (Cantó et al. 2015).
PARP1 is strongly activated by DNA damage, resulting in massive PARylation at the site of DNA damage. The concomitant drop in NAD+ levels has been suggested to affect sirtuin activity (Verdin 2015). Interestingly, PARP1−/− mice show increased NAD+ levels in muscle and brown adipose tissue as well as increased SIRT1 activity (Bai et al. 2011). The metabolisms of these mice are substantially different from wild-type animals: They are lighter (despite increased food intake), consume more oxygen (suggesting increased energy expenditure), have a higher mitochondrial content, and are protected against diet-induced diabetes and obesity. Similar protective effects on diet-induced diseases have been observed in SIRT1-overexpressing mice (Herranz and Serrano 2010) and CD38−/− mice (Barbosa et al. 2007; Camacho-Pereira et al. 2016). The CD38−/− mice also show increased NAD+ levels and up-regulated mitochondrial SIRT3 activity. Taken together, these results suggest that increased NAD+ availability due to loss of PARP1 or CD38 function can lead to activation of sirtuins. Conversely, increased activity of CD38 and PARP1, causing reduced NAD+ levels affecting sirtuin activity, may contribute to mitochondrial dysfunction during aging.
Synthesis of the universal methyl donor SAM
SAM is the universal methyl donor for cellular methylation of proteins and DNA (Figs. 2, 4A). Methionine adenosyltransferase (MAT) synthesizes SAM from ATP and methionine. In this reaction, the nucleophilic sulfur atom of methionine attacks the 5′ carbon of the ribose moiety of ATP, resulting in the formation of SAM and triphosphate, which is subsequently cleaved on the enzyme into phosphate (Pi) and pyrophosphate (PPi). Donation of the methyl group to an acceptor molecule (protein or DNA) yields S-adenosylhomocysteine (SAH), which is subsequently hydrolyzed to homocysteine and adenosine by SAH-hydrolase (SAHH) (Locasale 2013). The methionine (or methyl) cycle is completed by the donation of a methyl group from N5-methyltetrahydrofolate (CH3-THF), generating methionine and tetrahydrofolate (THF). CH3-THF can be regenerated from THF in the folate cycle (Tibbets and Appling 2010; Locasale 2013). In the liver and kidney, betaine-homocysteine methyltransferase (BHMT) can use betaine as a methyl donor in the synthesis of methionine from homocysteine (Day and Kempson 2016).
The folate cycle plays a central role in one-carbon metabolism (Fig. 4B). In the folate cycle, THF serves as a scaffold for the binding of a one-carbon unit that is shuffled between the N5 and N10 atoms in the THF backbone. One-carbon donors of the folate cycle include serine and glycine. Many tumors up-regulate serine biosynthesis from glycolytic intermediates. The first committed step in this pathway is the conversion of 3-phosphoglycerate (3-PG) into 3-phosphopyruvate (3-P-PYR) by phosphoglycerate dehydrogenase (PHDG). PHDG expression is up-regulated in specific breast cancer subtypes, and genomic regions containing the PHDG gene are amplified in melanoma (Locasale et al. 2011). Serine fuels the folate cycle through the enzyme serine hydroxymethyl transferase (SHMT), which transfers a carbon from serine to THF, yielding glycine, N5N10-methylene-THF (CH2-THF), and water. This reaction can occur in either the mitochondria or the cytosol. Methylene-THF reductase converts cytosolic CH2-THF into CH3-THF. However, in most proliferating cultured cells, the mitochondrial pathway is used (Ducker et al. 2016). The one-carbon unit in mitochondrial CH2-THF can leave the mitochondrion as formate and enter the cytosolic folate cycle via N10-formyl-THF (10-fTHF) synthesis (Figs. 2, 4B). In addition to serine, glycine can also serve as a one-carbon donor. This requires the glycine cleavage system, which occurs in the mitochondria. The C2 of glycine is transferred to THF, which yields CH2-THF. The C1 of glycine is released as CO2 and the amino group as NH3.
Although most organisms can synthesize methionine, this does not suffice in humans, making it an essential amino acid that needs to be provided in the diet. Importantly, the one-carbon unit attached to THF not only is used for the synthesis of methionine but is also essential for de novo synthesis of purines and dTMP. In the case of purines, the one-carbon unit is donated from 10-fTHF. The one-carbon unit for the synthesis of dTMP originates from CH2-THF. THF itself is made in two steps from dietary folate (vitamin B9) by dihydrofolate reductase (DHFR). Reflecting the importance of the folate cycle for proliferation, DHFR is the target of the anti-tumor agent methotrexate (MTX). In summary, the folate cycle is fundamentally important for cellular methylation reactions through methionine synthesis and for cell proliferation by regulating the synthesis of purines and dTMP.
Chromatin methylation is modulated by nutrient availability
Although requirements differ between different cell types and organisms, multiple studies demonstrated effects of nutrient restriction on histone methylation. As discussed above, mESCs (but not hESCs) are dependent on the activity of mitochondrial threonine dehydrogenase that catabolizes threonine into glycine and acetyl-CoA (Wang et al. 2009). This metabolic route has consequences beyond acetylation because the glycine that is produced enters the glycine cleavage pathway. Tracing studies revealed that the one-carbon unit from threonine appears in CH3-THF and SAM (Shyh-Chang et al. 2013). Indeed, threonine restriction results in a drop in the SAM/SAH ratio, accompanied by a decrease in H3K4me2/3 and increased mESC differentiation. Threonine restriction does not affect other histone methylation marks, such as H3K9me3 and H3K27me3, suggesting differential sensitivity of KMTs for SAM levels. What remains unclear is whether the global reduction of H3K4me2/3 directly causes a gene expression program that promotes stem cell differentiation. In hESCs or human induced PSCs (iPSCs), methionine restriction results in reduced H3K4me3 levels, while there is no effect on H3K9me3, H3K27me3, and H3K36me3 levels (Shiraki et al. 2014). Thus, regardless of the nutrient source, maintenance of global H3K4me3 levels in stem cells requires high SAM levels, while the threshold for other histone methylation marks is lower.
These effects are not limited to stem cells. Methionine restriction in various human cell lines also results in decreased levels of H3K4me3 (Mentch et al. 2015). This was an unexpected observation because, in principle, methionine can be recycled from SAH through donation of a methyl group from CH3-THF. However, in these cancer cells, the folate and methionine cycles are uncoupled, preventing the conversion of SAH into SAM. This suggests that homocysteine is not converted into methionine but is used in other pathways, such as synthesis of cystathionine. Consequently, serine, which fuels the folate cycle with one-carbon units in cancer cells (Labuschagne et al. 2014), cannot compensate for methionine deprivation. This blockage can be circumvented by supplementation of the culture medium with homocysteine and vitamin B12 (Maddocks et al. 2016). Under these conditions, it was found that serine contributes to the production of SAM by providing one-carbon units for the synthesis of methionine from homocysteine and supporting de novo ATP synthesis (Maddocks et al. 2016). Serine starvation led to a drop in both ATP and AMP (hence, AMPK was not activated), thus distinguishing between de novo ATP synthesis and ATP turnover. In summary, serine metabolism supports methylation in cancer cells by two distinct pathways: first, through de novo ATP synthesis, which is required for the conversion of methionine into SAM; and second, through fueling the folate cycle with one-carbon units, which can then be used for synthesis of methionine from SAH via homocysteine. Note that if sufficient methionine is available, the latter does not occur.
The effects of SAM reduction on global H3K4 methylation levels are not restricted to vertebrates. In Saccharomyces cerevisiae, folate and methionine deficiency leads to reduced H3K4me2 and H3K4me3 levels (Sadhu et al. 2013). Knockout of the enzymes sam1 or sam2, which are the orthologs of MAT, also diminishes H3K4me3 levels (Li et al. 2015). Caenorhabditis elegans contains four MAT homologs, known as sam1–4. Knockdown of sam1 reduces H3K4me3 (Ding et al. 2015) However, simultaneous knockdown of sam3 and sam4 leads to a reduction in H3K9me3, H3K27me3, and H3K36me3 but does not affect H3K4me3 (Towbin et al. 2012). The underlying molecular mechanism is unclear but might reflect differences in local production of SAM. In this regard, the recruitment of MATIIα, one of the mammalian MAT isoforms, to specific chromatin sites by transcription factor MafK is suggestive (Katoh et al. 2011; Kera et al. 2013). As part of the S. cerevisiae SESAME (serine-responsive SAM-containing metabolic enzyme) complex, sam1 and sam2 are recruited to specific chromatin loci and interact with the H3K4 HMT Set1 (Li et al. 2015). Thus, local SAM production might stimulate specific HMTs.
Cofactors, cosubstrates, and inhibitors of chromatin demethylation
There are two major classes of KDMs, each of which depends on different cofactors (Fig. 4A; Kooistra and Helin 2012). Demethylation by LSD1 or LSD2 requires FAD, which is synthesized de novo from vitamin B2. Like NAD+, FAD acts as an electron acceptor and is used in a wide variety of cellular redox reactions. During the demethylation reaction, LSD1/2 catalyzes the oxidation of the methylamine group, coupled to FAD reduction to FADH2 (Walport et al. 2012). This step results in the formation of an imine bond (a carbon–nitrogen double bond, with the nitrogen attached to a hydrogen atom or an alkyl group). Next, FADH2 is oxidized by molecular oxygen, resulting in regeneration of FAD and formation of hydrogen peroxide. In the second step of the reaction, the imine bond is resolved through reaction with water, resulting in the formation of an N–H bond and formaldehyde. Note that the formation of an imine (double) bond as an intermediate step in the reaction is the reason that LSD-class demethylases cannot use trimethylated lysines as a substrate.
JMJC KDMs and TET DNA demethylases are αKG-dependent dioxygenases that use αKG (also known as 2-oxo-glutarate) as a cosubstrate (Figs. 2, 4A). The demethylation reaction requires Fe(II) and consumes αKG and O2, producing succinate, CO2, and formaldehyde. αKG is an intermediate of the TCA cycle and is synthesized in the mitochondria from isocitrate by isocitrate dehydrogenase 2 (IDH2) and IDH3. A third family member, IDH1, is localized in the cytosol and peroxisomes. While IDH1 and IDH2 use NAD phosphate (NADP+) as a cofactor, IDH3 uses NAD+. In the TCA cycle, αKG is oxidized into succinyl-CoA. In addition to protein and DNA demethylation, αKG-dependent dioxygenases include enzymes involved in oxygen sensing, fatty acid metabolism, and collagen biosynthesis. Importantly, several metabolites that are structurally related to αKG are inhibitors of αKG-dependent dioxygenases. These include succinate, fumarate, and 2-hydroxyglutarate (2HG). Succinate and fumarate are intermediates of the TCA cycle, but succinate is also produced as a product of αKG-dependent dioxygenases.
Finally, αKG also serves important functions in amino acid metabolism. Together with glutamate, αKG forms an amino and α-keto acid pair in transamination reactions by aminotransferases. In amino acid catabolism, αKG acts as an amino group acceptor, yielding glutamate. Vice versa, in amino acid biosynthesis, glutamate acts as an amino group donor, yielding αKG. If the nitrogen is not required for biosynthesis, glutamate can also be deaminated by glutamate dehydrogenase (GDH), which releases the amino group as ammonia, yielding αKG (DeBerardinis 2016). In proliferating cells, the activity of aminotransferases is up-regulated, coupling amino acid synthesis to αKG generation (Coloff et al. 2016). Conversely, quiescent cells display enhanced GDH levels and reduced levels of aminotransferases.
αKG modulates stem cell pluripotency and differentiation
mESCs depend on glucose and glutamine catabolism to maintain high levels of αKG, which promotes self-renewal over differentiation (Carey et al. 2015). Glutamine deprivation results in a drop in the αKG/succinate ratio, accompanied by increased global methylation of some histone residues, including H3K27me3. Likewise, DNA demethylation by the TET proteins is also affected by glutamine starvation, leading to hypermethylation. However, H3K4me3 and some other methylated histone residues remained unchanged. Thus, there appears to be a hierarchy in the sensitivity for changes in the αKG/succinate ratio among different methylated histone residues. The molecular basis for this selectivity remains unclear. Another important question is how a shift in chromatin methylation may affect the gene expression programs for either self-renewal or differentiation.
Recently, it was suggested that transcriptional regulation of αKG synthesis is an integral part of pluripotency control (Hwang et al. 2016). One of the enzymes that determine αKG levels in mESCs is phosphoserine aminotransferase 1 (Psat1), which is part of the serine biosynthetic pathway. Hwang et al. (2016) showed that Psat1 expression is controlled by the stem cell core transcription factors Oct4, Sox2, and Nanog. Psat1 is highly expressed in mESCs and is down-regulated upon differentiation. Psat1 catalyzes the conversion of 3-P-PYR into 3-phosphoserine (3-P-Ser) using glutamate as amino donor, yielding αKG (Fig. 2). Knockdown of Psat1 reduces the αKG/succinate ratio and leads to DNA hypermethylation and increased levels of H3K9me3 and H3K36me3, whereas no effect was observed on H3K27me3. Reduced αKG levels suppress mESC self-renewal and accelerate differentiation. These observations suggest that transcriptional control of metabolic enzyme Psat1 affects αKG levels, which in turn modulate the mESC pluripotency program.
Complicating matters, the precise stage of PSCs and the cellular context turns out to be a major factor in determining the effect of αKG on self-renewal. In primed human PSCs or mouse epiblast stem cells (EpiSCs), which are more mature than mESCs, αKG promotes differentiation instead of self-renewal (TeSlaa et al. 2016). As αKG stimulates bulk histone and DNA demethylation in both EpiESCs and ESCs, the effects of αKG on stem cell self-renewal or differentiation seem to depend on cellular maturity.
Oncometabolites that counteract αKG
Cancer-associated mutations in several genes encoding enzymes involved in the TCA cycle cause the accumulation of metabolites that are competitive inhibitors of αKG-dependent dioxygenase reactions (Fig. 4A). Loss-of-function mutations in mitochondrial enzymes succinate dehydrogenase (SDH) and fumarate hydratase (FH) have been identified in a subset of relatively rare human cancers. As a result of these mutations, succinate and fumarate accumulate, leading to inhibition of JMJC-class KDMs and TET DNA demethylases (Xiao et al. 2012; Killian et al. 2013; Letouzé et al. 2013). Loss of FH and accumulation of fumarate has been connected to the epithelial-to-mesenchymal transition (EMT). Inhibition of TET-mediated demethylation by fumarate affects expression of the anti-metastatic microRNA cluster mir-200ba429, resulting in the expression of EMT-related transcription factors (Sciacovelli et al. 2016). Gain-of-function mutations in IDH1 and IDH2, which occur in a subset of gliomas and acute myeloid leukemias (AMLs), generate neomorphic enzymes. Instead of αKG, cancer-associated IDH1/2 mutants produce the R-enantiomer of 2HG (R-2HG) (Dang et al. 2009; Gross et al. 2010; Ward et al. 2010). Strikingly, cancer cells harboring neomorphic IDH1/2 mutants have R-2HG levels that are >10-fold to 300-fold higher than normal (Losman and Kaelin 2013). R-2HG is a competitive inhibitor of JMJC-class KDMs and TET DNA demethylases, resulting in DNA and histone hypermethylation (Figueroa et al. 2010; Chowdhury et al. 2011; Xu et al. 2011; Koivunen et al. 2012; Lu et al. 2012; Turcan et al. 2012). Indeed, gliomas and AML cells harboring IDH1 mutations have a so-called CpG island methylator phenotype: aberrant methylation of CpG islands on a subset of genes (Toyota and Issa 1999). Affected genes include the crucial tumor suppressor p16INK4a, providing an attractive molecular explanation for how R-2HG may drive oncogenesis. However, direct proof for this notion remains elusive.
Although there is compelling evidence that R-2HG is a dominant oncogenic effector, it is less clear which cellular process is the crucial target for cellular transformation (Losman et al. 2013). Experiments using an inhibitor that is selective for the most common IDH1 mutant in gliomas suggested that reversal of oncogenic features is independent of chromatin methylation effects (Rohle et al. 2013). Moreover, the S-enantiomer of 2HG (S-2HG) is a more potent inhibitor of TET2 DNA demethylase than R-2HG but does not induce cellular transformation (Losman et al. 2013). Thus, it remains unresolved which of the >50 αKG-dependent dioxygenases are the relevant targets in oncogenesis. One possible candidate is the prolyl hydroxylase EgIN, which is inhibited by S-2HG but stimulated by R-2HG (Koivunen et al. 2012; Losman et al. 2013). EgIN controls the levels of the HIF transcription factors, which play important roles in cancer biology (Majmundar et al. 2010; Keith et al. 2011).
In summary, cancer-associated mutations in SDHs, FHs, and IDHs result in an increase of succinate, fumarate, or R-2HG, which inhibit JMJC domain-containing KDMs and TET DNA demethylases. However, whether the associated changes in chromatin are drivers of oncogenic transformation remains to be determined.
Metabolic enzymes that do double duty as regulators of chromatin and transcription
Thus far, we have discussed the rapidly expanding study of the influence of metabolites on gene expression. In addition, some metabolic enzymes turned out to play surprisingly direct roles in the regulation of chromatin and transcription. Below, we discuss examples of metabolic enzymes that do double duty as regulators of transcription. We note, however, that there are other routes through which metabolic enzymes may modulate gene expression. For example, screens for RNA-binding proteins turned up a large number of metabolic enzymes, suggesting that they may be involved in post-transcriptional control (for review, see Castello et al. 2015). Aminoacyl-tRNA synthetases (aaRSs) catalyze the coupling of specific amino acids to tRNAs for protein synthesis. Independent of their enzymatic function in translation, aaRSs engage in a plethora of additional cellular functions (Guo and Schimmel 2013). Here, we concentrate on chromatin and transcription control by metabolic enzymes. We discuss selected examples that highlight the diverse ways in which metabolic enzymes can modulate gene expression. These include functioning as sequence-specific transcription factors, as transcriptional coregulators, or by localized cofactor production. Notably, control of gene expression often does not involve the enzyme's catalytic activity. Finally, cytoplasmic–nuclear partitioning is used repeatedly as a regulatory mechanism to link metabolic state to transcriptional outcomes (Fig. 1).
Chromatin modulation by PK and SESAME
PK catalyzes the final step of glycolysis, which is the conversion of PEP and ADP into pyruvate and ATP. Like many other glycolytic enzymes, PK is frequently up-regulated in tumors. The mammalian enzyme comprises four isoforms encoded by two different genes (Israelsen and Vander Heiden 2015). PKM1 and PKM2 are encoded by the PKM gene and differ due to alternative splicing. PKM2 is the predominant isoform in cancer cells but is also expressed in normal proliferating cells (Altenberg and Greulich 2004; Mazurek et al. 2005). Strikingly, replacement of PKM2 by PKM1 leads to reversal of the Warburg effect, as judged by increased oxygen consumption and diminished lactate production (Christofk et al. 2008). Disappointingly, instead of the expected inhibition, deletion of the exon required for the PKM2 isoform accelerates mammary tumor formation in a Brca1-loss mouse model (Israelsen et al. 2013). Thus, the precise role of PKM2 in tumorigenesis remains confusing. PK shows the highest activity as a tetramer. PKM1 forms a constitutive tetramer, while the oligomeric state and activity of PKM2 is regulated by a multitude of different mechanisms, including PTMs and allosteric effectors. For example, PKM2 is allosterically activated by serine (Chaneton et al. 2012; Ye et al. 2012). When serine is abundant, PKM2 is fully active, resulting in maximal glycolytic flux. Serine deprivation results in reduced PKM2 activity, enabling the shuttling of glucose-derived carbon into the serine biosynthesis pathway. Another allosteric activator is succinyl-aminoimidazole-carboxamide-ribose-5-phosphate (SAICAR), which is an intermediate in the purine biosynthetic pathway. Glucose restriction in cancer cells results in accumulation of SAICAR, which activates PKM2, promoting lactate production and cell survival (Keller et al. 2012). Thus, PKM2 controls glycolysis and the synthesis of biomolecular building blocks in response to metabolic cues.
Apart from its canonical function as a glycolytic enzyme, PKM2 has also been implicated in chromatin regulation. PKM2 translocates to the nucleus in response to EGF signaling, interleukin-3, hypoxia, or SAICAR (Hoshino et al. 2007; Keller et al. 2012; Luo et al. 2011; Yang et al. 2011). Remarkably, in the nucleus, PKM2 acts as a protein kinase that uses PEP as a phosphate donor instead of ATP (Gao et al. 2012; Yang et al. 2012). One of the nuclear phosphorylation targets of PKM2 is H3T11 (Yang et al. 2012). H3T11 phosphorylation by PKM2 in promoter regions of target genes, including MYC and CCND1 (cyclin D1), results in HDAC3 dissociation and subsequent H3K9ac. However, the protein kinase function of PKM2 is controversial. It has been suggested that the observed activity is due to ATP containing PEP batches or ATP regeneration by PKM2, which is subsequently used by other protein kinases (Hosios et al. 2015). Nevertheless, a recent report suggests that H3T11 phosphorylation by PKM is conserved from yeast to humans (Li et al. 2015).
S. cerevisiae has two PK homologs: Pyk1 and Pyk2. H3T11 phosphorylation (H3pT11) is reduced in a temperature-sensitive strain of Pyk1 when grown at the nonpermissive temperature, while no effect on H3T11 phosphorylation was observed in a Pyk2 deletion strain (Li et al. 2015). Thus, mammalian PKM2 seems more similar to Pyk1 than to Pyk2. Surprisingly, Pyk1 is found in a complex with enzymes involved in serine, SAM, and acetyl-CoA synthesis, which was duly named SESAME (Li et al. 2015). SESAME phosphorylates H3T11 in a serine-responsive way, indicating that the allosteric activation by serine is evolutionary conserved. The presence of both serine and SAM biosynthetic enzymes in SESAME suggests a functional link between both pathways (Fig. 5A). As discussed above, serine biosynthesis and SAM biosynthesis are linked via the folate cycle, for which serine acts as a carbon donor. Deletion of either serine or SAM biosynthetic enzymes in SESAME reduces global H3K4me3 levels. Concurrently, H3pT11 phosphorylation is reduced, suggesting a dependence on H3K4me3. Indeed, deletion of various subunits of the Set1 complex (also known as COMPASS [complex of proteins associated with Set1]), which is responsible for H3K4 methylation in S. cerevisiae (Shilatifard 2012), reduces not only H3K4me1/2/3 but also H3pT11. These findings suggest that Set1-dependent H3K4 methylation facilitates H3T11 phosphorylation by SESAME. Conversely, biosynthesis of serine or SAM by SESAME may fuel H3K4me3 methylation. However, some key enzymes in the SAM and serine synthesis pathways are lacking in SESAME. Thus, for localized production on chromatin, these enzymes will need to be recruited as well. Set1 facilitates the binding of SESAME to target genes in response to changes in serine metabolism. Interestingly, these target genes include PYK1, which is repressed by SESAME. These results suggest that SESAME may convert changes in intermediary metabolism to chromatin structure, constituting a negative feedback loop to PYK1 expression.
Figure 5.
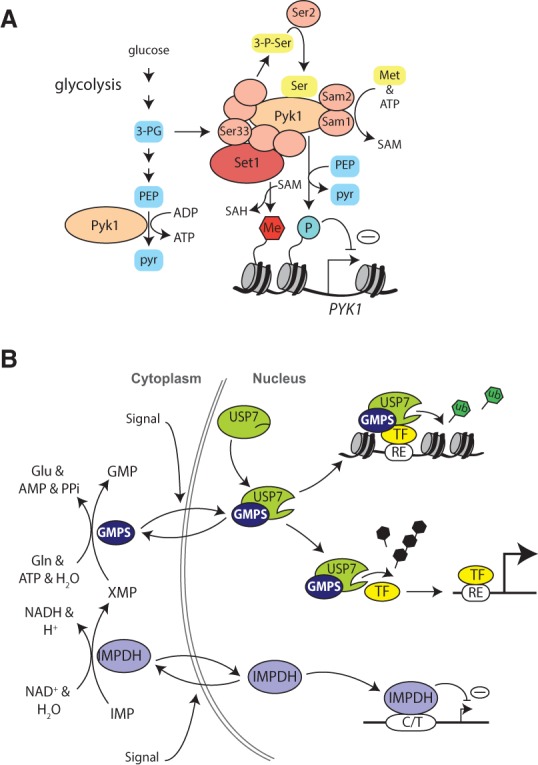
Metabolic enzymes as transcription factors. (A) The chromatin-associated SESAME complex harbors PK, a subset of serine metabolic enzymes, and SAM synthetases. The Set1 H3K4 methyltransferase complex promotes the recruitment of SESAME and H3T11 phosphorylation. SESAME provides a connection between H3K4me3, H3pT11, glycolysis, and serine metabolism. Forming a feedback loop, SESAME autoregulates PYK1 gene expression. (Met) Methionine; (pyr) pyruvate; (3-P-Ser) 3-phospho-serine. (B) Chromatin and transcription control by nucleotide biosynthetic enzymes. In the cytoplasm, inosine monophosphate (IMP) dehydrogenase (IMPDH) and guanosine 5′-monophosphate (GMP) synthase (GMPS) mediate the synthesis of GMP. In the nucleus, GMPS binds and activates the deubiquitylating enzyme ubiquitin-specific protease 7 (USP7). GMPS-USP7 can function as a transcriptional corepressor when it is recruited to specific regulatory elements (REs) by gene-selective transcription factors (TFs). Here, GMPS-USP7 can promote gene repression at least in part by removal of the active H2B ubiquitylation (H2Bub) mark (ub; green hexagons). GMPS-USP7 is recruited to Polycomb response elements and promotes silencing by the Polycomb system. USP7 can deubiquitylate selective Polycomb group (PcG) proteins, thereby promoting H2Aub. In addition to acting as a transcriptional corepressor, GMPS-USP7 can also modulate gene expression programs through deubiquitylation and stabilization of selective transcription factors, including the tumor suppressor p53 and the effector of hedgehog signaling, cubitus interruptis. Although the majority of GMPS is cytoplasmic, it continuously shuttles in and out of the nucleus. The nuclear accumulation of GMPS and hence its impact on gene expression are regulated by cellular state. IMPDH is the enzyme directly upstream of GMPS. In addition to its biosynthetic function, IMPDH is also a sequence-specific DNA-binding transcriptional repressor. IMPDH binds single-stranded CT-rich regulatory DNA elements (C/T). Cytoplasmic–nuclear partitioning is used to regulate IMPDH nuclear activity. Normally, most IMPDH is cytoplasmic, but it accumulates in the nucleus in response to oxidative or replicative stress.
Transcriptional repression by fructose-1,6-bisphosphatase (FBP1)
FBP1 is the rate-limiting enzyme in the gluconeogenesis pathway, which generates glucose from noncarbohydrate sources. Metabolic profiling of clear cell renal cell carcinomas (ccRCCs) revealed that gluconeogenesis was uniformly suppressed and that FBP1 is depleted (Li et al. 2014). FBP1 down-regulation is crucial for ccRCC cell proliferation, in particular in cells where HIF1α is stabilized. The vast majority of ccRCCs contains inactivating mutations in the von Hippel-Lindau (VHL) E3 ubiquitin ligase, which leads to HIF1α stabilization even under normoxia. The transcriptional activity of HIF1α in turn drives angiogenesis and metabolic reprogramming, benefitting tumor growth. Li et al. (2014) found that FBP1 bound to the HIF inhibitory domain and suppressed HIF1α transcriptional activity in ccRCC cells. FBP1 and HIF1α colocalize on hypoxia response DNA elements, suggesting that FBP1 acts as a transcriptional corepressor. Pertinently, transcriptional repression of HIF1α target genes was independent of FBP1 catalytic activity. This fascinating study suggests that FBP1 has a dual tumor-suppressive function in renal cancer. First, its metabolic activity in the cytoplasm may antagonize glycolytic flux and thereby the Warburg effect. Second, in the nucleus, it can function as a HIF1 transcriptional corepressor. Thus, FBP1 provides a direct coupling between metabolic and transcriptional adaptation.
The diverse functions GAPDH
GAPDH is probably best known among molecular biologists for its humble role as a loading or normalization control. However, GAPDH is an important glycolytic enzyme that catalyzes the conversion of glyceraldehyde-3-phosphate into 1,3-bisphosphoglycerate. The majority of GAPDH normally exists as a tetramer in the cytoplasm. Following distinct cellular stressors, however, GAPDH relocalizes to various organelles, including the nucleus, mitochondria, and subcellular structures such as microtubules. At these novel locations, GAPDH has been implicated in a stunning variety of activities (for review, see Tristan et al. 2011). Just in the nucleus, GAPDH functions in DNA repair, cell cycle-dependent transcription control, RNA export, telomere maintenance, induction of autophagy, and cell death. GAPDH was identified as an essential component of the transcriptional coactivator OCA-S, which drives the expression of the histone H2B gene at S phase (Zheng et al. 2003; Dai et al. 2008). The sequence-specific transcription factor OCT1 recruits GAPDH, which contains intrinsic transcriptional activation potential, to the H2B promoter. Within OCA-S, GAPDH appears to be monomeric, precluding its enzymatic activity, which depends on tetramerization. NAD+ activates, but NADH inhibits, binding to OCT1 and transcription activation. These findings suggest that GAPDH can confer redox control on transcription of selective genes. It will be interesting to see whether these initial observations can be expanded and whether the gene regulatory network of GAPDH can be determined.
Nuclear GAPDH plays a pivotal role in controlling the balance between apoptosis and autophagy. Diverse cytotoxic stresses induce S-nitrosylation of GAPDH (SNO-GAPDH), which blocks its catalytic activity and promotes binding to the E3 ubiquitin ligase SIAH1 and nuclear translocation (Sen et al. 2008). Nuclear SNO-GAPDH mediates apoptosis through stimulation of p300/CBP, which acetylates and activates p53 (Sen et al. 2008). Moreover, SNO-GAPDH can bind and transnitrosylate SIRT1 and HDAC1, leading to their inhibition (Kornberg et al. 2010). Under different conditions, however, GAPDH can function as an activator of SIRT1 (Chang 2015). Following glucose deprivation, but not amino acid starvation, GAPDH is phosphorylated by AMPK. This leads to GAPDH accumulation in the nucleus, where it activates SIRT1 by displacement of the repressor DBC1. The active SIRT1 deacetylase can now stimulate an anti-apoptotic cellular autophagy program (Chang et al 2015). In summary, depending on the cellular stress, GAPDH can be either S-nitrosylated or phosphorylated, which will promote nuclear protein acetylation or deacetylation, respectively. This in turn can trigger either apoptosis or cell survival via authophagy. Thus, GAPDH integrates and relays different cellular signals and, through its nuclear nonenzymatic activity, mediates opposing outcomes.
Chromatin and transcription control by nucleotide biosynthetic enzymes
Cell growth and proliferation depend on de novo nucleotide biosynthesis. To this end, cancer cells and normal rapidly dividing cells redirect glucose and glutamine toward nucleotide anabolic pathways and induce the expression of key nucleotide biosynthetic enzymes (Tong et al. 2009). Conversely, repression of nucleotide metabolism plays a key role in oncogene-induced cellular senescence (Aird et al. 2013). Thus, cells need to coordinate growth, differentiation, and tumor suppression with nucleotide biosynthesis. It is well established that transcription factors such as Myc and E2F control the transcription of genes encoding key nucleotide biosynthetic enzymes (Dang and Lewis 1997; Tong et al. 2009). However, the molecular nature of a potential feedback loop remained unclear. Recent research revealed a direct role for selective nucleotide biosynthetic enzymes in coupling cellular state to gene expression programs during development and in tumor suppression.
Guanosine 5′-monophosphate (GMP) synthase (GMPS) is a biosynthetic enzyme that mediates the final step of the de novo synthesis of guanine nucleotides, converting xanthosine 5′-monophosphate (XMP) into GMP. In this reaction, glutamine acts as an amido-N donor and is converted into glutamate. Studies in Drosophila and human cells found that GMPS associates with the nuclear ubiquitin-specific protease 7 (USP7) (van der Knaap et al. 2005, 2010; Sarkari et al. 2009; Reddy et al. 2014; Zhou et al. 2015). GMPS activates USP7 through an allosteric mechanism, which is independent of its GMP synthesis function (van der Knaap et al. 2005, 2010; Faesen et al. 2011). GMPS-USP7 modulates gene expression by targeting either chromatin or transcription factors (Fig. 5B). Biochemical and genetic evidence established that GMPS is required for histone H2B deubiquitylation by USP7 in Drosophila and mammalian cells (van der Knaap et al. 2005, 2010; Sarkari et al. 2009; Frappier and Verrijzer 2011). In Drosophila, GMPS-USP7 functions as a transcriptional corepressor that is recruited to target genes by the ecdysone nuclear receptor (van der Knaap et al. 2010).
GMPS and USP7 are genetic enhancers of Polycomb function in Drosophila. GMPS-USP7 is recruited to Polycomb response DNA elements and promotes silencing of homeotic genes by the Polycomb system (van der Knaap et al. 2005). Removal of the active H2B monoubiquitylation (H2Bub1) mark by GMPS–USP7 provides a straightforward explanation for its cooperation with Polycomb group (PcG) silencing. However, it is not clear whether this is the actual mechanism. Whereas USP7 has been implicated in Polycomb repression in human cells, the potential role of GMPS has not been examined yet. Research in mammalian cells revealed that USP7 associates with selective PcG proteins, thereby modulating their level and activity, including H2Aub (Maertens et al. 2010; Frappier and Verrijzer 2011; Lecona et al. 2015). Thus, USP7 can create a repressive chromatin environment by deubiquitylation of H2Bub (a mark of active chromatin) and stimulates H2Aub (a mark of repressed chromatin).
In addition to acting as a transcriptional corepressor, GMPS-USP7 can also modulate gene expression programs through deubiquitylation of selective transcription factors. Elegant developmental genetic experiments in Drosophila revealed that both GMPS and USP7 are required for hedgehog signaling (Zhou et al. 2015). The hedgehog signaling pathway plays crucial roles in normal development and tissue homeostasis in organisms ranging from invertebrates to mammals (Briscoe and Thérond 2013). The ultimate effector of hedgehog signaling is the sequence-specific transcription factor cubitus interruptis (Ci; named Gli in mammals). Ci is controlled by several ubiquitin E3 ligases followed by partial or complete proteasomal degradation. Depending on the strength of the hedgehog signal, Ci can either be degraded, form a truncated transcriptional repressor, or act as a full-length activator. Zhou et al. (2015) showed that GMPS-USP7 is a positive mediator of hedgehog signaling through deubiquitylation and stabilization of the active form of Ci.
Finally, GMPS-USP7 is a regulator of the p53 tumor suppressor pathway (Reddy et al. 2014). The sequence-specific transcription factor p53 is a crucial mediator of tumor suppression but also regulates metabolism and stem cell biology (Bieging et al. 2014). p53 levels are tightly controlled and involve multiple pathways, including ubiquitylation. Normally, p53 protein levels are kept low due to continuous ubiquitylation by the E3 ubiquitin ligase MDM2 followed by proteasomal degradation. (Hock and Vousden 2010). USP7 plays a dual role in p53 regulation and may deubiquitylate either p53 or its negative regulator, MDM2 (Cummins et al. 2004; Li et al. 2002, 2004). Interestingly, GMPS acts as a relay linking cellular state to p53 stabilization by USP7 (Reddy et al. 2014). Most GMPS is normally sequestered in the cytoplasm, whereas, in the nucleus, MDM2 binds and ubiquitylates p53, marking it for proteasomal degradation. USP7 counteracts autoubiquitylation of MDM2, thereby promoting p53 degradation. Genomic stress or nucleotide deprivation signals the nuclear accumulation of GMPS. Here, it stabilizes p53 by driving its transfer from MDM2 to a GMPS-USP7 deubiquitylation complex. Intriguingly, cytoplasmic retention of GMPS involves TRIM21, a ubiquitin ligase involved in immune regulation (Reddy et al. 2014).
In conclusion, GMPS can either enable or restrict cell proliferation. The biosynthetic function of GMPS provides the nucleotides needed for cellular growth and DNA replication. In the nucleus, GMPS can stabilize p53 through redirection and activation of USP7. These opposing activities of GMPS indicate a regulatory loop to restrict aberrant cell proliferation. Finally, the gene regulatory functions of GMPS in Polycomb silencing and ecdysone and hedgehog signaling suggest that it couples cell differentiation, growth, and proliferation during development.
Inosine monophosphate (IMP) dehydrogenase (IMPDH) is the enzyme directly upstream of GMPS in the GMP biosynthesis pathway (Hedstrom 2009). IMPDH catalyzes the oxidation of IMP to the GMPS substrate XMP, concurrently reducing NAD+ to NADH. In addition to its biosynthetic function, there is evidence that IMPDH is involved in gene expression control (Fig. 5B). IMPDH can bind RNA and polysomes and has been implicated in selective control of translation (Mortimer et al. 2008). Studies in Drosophila showed that IMPDH is also a sequence-specific DNA-binding transcriptional repressor that binds unwound CT-rich regulatory DNA elements (Fig. 5B; Kozhevnikova et al. 2012). Most IMPDH is normally cytoplasmatic but accumulates in the nucleus during the G2 phase of the cell cycle or in response to oxidative or replicative stress. Interestingly, IMPDH binds and represses the histone genes and E2f, the master controller of the G1/S transition. These observations suggest that, as biosynthetic enzymes, GMPS and IMPDH fuel cell growth and proliferation but, as regulators of transcription, restrain these processes. Such a coupling of activities may safeguard against aberrant cell proliferation.
Metabolism and epigenetic inheritance
Because chromatin-modifying enzymes depend on key metabolites, nutritional state can influence the structure of chromatin and gene expression. A topic of considerable current interest is to what extent nutritional history or environmental stress may modulate epigenetic inheritance. Much has been said about the meaning of the term “epigenetics” (Bird 2007; Ptashne 2007; Allis and Jenuwein 2016). One popular definition of epigenetics refers to effects on gene expression that are maintained through cell divisions in the absence of the initiating signal (and that do not involve mutations in the DNA sequence). A classic example of such a process is the establishment of homeotic gene expression in the fruit fly. During development of Drosophila, the expression domains of the homeotic genes are established early in development by the gap and pair rule sequence-specific transcription factors. However, these transcription factors are expressed only transiently and disappear later during development. The faithful inheritance of the previously established expression pattern of the homeotic genes now requires the activities of the PcG and trithorax group (trxG) proteins. PcG proteins maintain repression of homeotic genes outside their normal expression domains, whereas trxG proteins are needed to sustain transcription. Once established, silencing or activity is mitotically stable and maintained over many cell divisions. Pertinently, PcG and trxG proteins regulate transcription through modulation of chromatin structure. PcG silencing depends on methylation of histone H3K27 by PRC2. The H3K27R substitution mutation, which can no longer be methylated, reproduces the PcG mutant phenotype in Drosophila (Pengelly et al. 2013). Thus, specific chromatin modifications can be crucial for the cellular memory of transcriptional state during metazoan development. A broader definition of epigenetic events is “the structural adaptation of chromosomal regions so as to register, signal, or perpetuate altered activity states” (Bird 2007). Often, however, epigenetics is used to cover virtually all aspects of chromatin structure, histone PTMs, or DNA methylation. On the opposite end of the spectrum, epigenetics is used to describe transgenerational inheritance of a phenotype induced through interaction with the environment, such as the nutritional state of a parent (again, without alterations in the genome sequence). Problems arise when these meanings become intermingled, and chromatin modifications are implicitly assumed to mediate transgenerational inheritance.
As discussed above, nutritional state can modulate gene expression patterns involving changes in chromatin structure (including H3K27 methylation). Thus, these effects can be referred to as epigenetic. In our opinion, however, there is no compelling evidence for transgenerational inheritance of broad patterns of gene expression (e.g., conferring a metabolic ground state) in mammals. Transgenerational inheritance of acquired states is especially well established in plants and has also been observed in animals such as C. elegans. In these organisms, RNA is likely to play a major role in the stable inheritance of gene expression state. For two outstanding reviews on transgenerational epigenetics, see Daxinger and Whitelaw (2012) and Heard and Martienssen (2014). There are examples of stable epialleles in mammals, such as in the Agoutivy mice, but these tend to be special cases often involving transposable DNA elements. Similarly, parental imprinting affects only a small subset of genes. Conclusive evidence for chromatin-based inheritance in mammals is lacking. Frequently mentioned epidemiological studies—e.g., those on the effects of the Dutch hunger winter of 1945 on progeny (Schulz 2010)—remain phenomenology and do not provide a mechanistic basis. In addition, we are concerned whether it is possible to correct appropriately for confounding factors such as social influences. Finally, it is important to distinguish developmental defects from transgenerational epigenetic inheritance. Maternal stress during pregnancy could obviously affect development, with consequences for adult life. In addition, there might be an influence on the germ cells. Thus, a true transgenerational effect should be detectable in the third and possibly subsequent generations.
A recent study tested the effects of in utero exposure to endocrine-disrupting chemicals on gene transcription and DNA methylation in mice and found that these are not inherited across generations (Iqbal et al. 2015). Likewise, the offspring of human parents affected by thalidomide-induced embryopathy did not display an increased occurrence of related defects (Smithells 1998; Strömland et al. 2002). A number of studies on mice found that paternal environmental conditions, including diet, stress, and toxins, have an impact on the offspring's metabolic phenotypes (Rando and Simmons 2015). Suggestively, several of these studies observed changes in cytosine methylation that correlated with these phenotypes, raising the possibility that differential methylation of the sperm DNA might be a carrier of epigenetic inheritance. However, a detailed study of dietary effects on the methylome of mature sperm failed to uncover a correlation between diet and sperm DNA methylation (Shea et al. 2015). Rather, stochastic individual differences in DNA methylation (epivariation) turned out to be a much stronger contributor to the sperm methylome. These results argue against sperm DNA methylation as the mediator of an inherited effect of paternal diet on offspring metabolism. Epivariation was found to be profoundly influenced by genetic variation in DNA repeat elements, highlighting that inbred mice are not isogenic and that this can have major confounding effects on interpreting epigenetic observations (Shea et al. 2015). Moreover, population effects in sperm can further obscure interpretations. The issues of genotyping and cell purity have also been highlighted as potential problems with current epigenome-wide association (EWAS) studies (Birney et al. 2016). The difficulty in separating genetic and environmental influences is illustrated by the well-established epidemiological inverse correlation between birth weight and risk for adult metabolic diseases (Hales and Barker 2001). This relationship has long been attributed predominantly to the effects of poor maternal nutrition. Although the original studies emphasized developmental mechanisms, a connection with epigenetic inheritance is frequently suggested. Recently, however, genetic effects were found to play a significant role in the association between birth weight and adult disease (Horikoshi et al. 2016).
In summary, whereas epialleles have been described in mammals, they are extremely rare (Daxinger and Whitelaw 2012; Heard and Martienssen 2014). A fundamental aspect of development is the resetting of the genome, erasing marks of gene activity or repression and allowing the development of a new organism from a fertilized egg. This cleaning of the epigenetic slate takes place during gametogenesis and after fertilization and resets the genome to start development (with a few exceptions, such as imprinted genes). Given these considerations, we remain skeptical that the impact of dietary or other nonmutagenic environmental stresses on chromatin structure can mediate transgenerational effects in mammals. In particular, we see no evidence for the sometimes-made suggestion that diet-induced heritable epigenetic states are adaptive; e.g., by conferring a “thrifty” phenotype. Not only is there no molecular mechanism to explain such Lamarckian epigenetics, it is difficult to make evolutionary sense of overruling germline reprogramming to burden the next generation with parental epigenetic history.
Concluding remarks
There is accumulating evidence that central chromatin-modifying enzymes respond to changes in the level of cofactors and cosubstrates that are key metabolites. This provides a molecular connection between cellular state and environmental conditions, such as the availability of nutrients or oxygen. A pertinent outstanding question is whether metabolites have only global effects on chromatin or whether specific genes show a differential response to changes in the levels of particular cofactors. Although less studied, there are compelling examples of metabolic enzymes that directly regulate local chromatin structure and gene expression. Transcriptional control by these double-duty metabolic enzymes can be independent of their canonical catalytic activity but still closely linked to their metabolic role. These enzymes can act as transcriptional coregulators recruited by sequence-specific transcription factors, can themselves bind DNA, or may generate niches of cofactor production to fuel local chromatin modifications. Metabolic signaling to chromatin is an integral part of normal homeostasis, development, aging, and disease. It has also become clear that the control of metabolism and gene expression forms a closely integrated network, including a multitude of feedback and feed-forward loops rather than linear pathways. Although there are a number of examples in which the involvement of sequence-specific transcription factors explains gene selectivity, generally, this aspect remains poorly understood. Likewise, often it is not trivial to separate cause and effect from mere correlations or bystander effects. Finally, its shear abundance makes chromatin itself a potential modulator of cellular metabolism, which may affect the cellular flux of acetate, acetyl-CoA, or SAM. Given the well-established role of chromatin-modifying enzymes in diseases such as cancer, understanding how their activities are influenced by metabolic state might provide novel avenues for therapeutic intervention. We anticipate that future research will further reveal the reciprocal interconnectivity of metabolism, chromatin, and gene expression.
Acknowledgments
We apologize for publications not cited due to space restrictions or our oversight. We thank Ben Tilly and Jeroen Demmers for critical reading of the manuscript. This work was supported in part by a grant from the Netherlands Organization for Scientific Research (ECHO 711.014.001).
Footnotes
Article is online at http://www.genesdev.org/cgi/doi/10.1101/gad.289140.116.
Freely available online through the Genes & Development Open Access option.
References
- Aird KM, Zhang G, Li H, Tu Z, Bitler BG, Garipov A, Wu H, Wei Z, Wagner SN, Herlyn M, et al. 2013. Suppression of nucleotide metabolism underlies the establishment and maintenance of oncogene-induced senescence. Cell Rep 3: 1252–1265. [DOI] [PMC free article] [PubMed] [Google Scholar]
- Allis CD, Jenuwein T. 2016. The molecular hallmarks of epigenetic control. Nat Rev Genet 17: 487–500. [DOI] [PubMed] [Google Scholar]
- Altenberg B, Greulich KO. 2004. Genes of glycolysis are ubiquitously overexpressed in 24 cancer classes. Genomics 84: 1014–1020. [DOI] [PubMed] [Google Scholar]
- Ariyannur PS, Moffett JR, Madhavarao CN, Arun P, Vishnu N, Jacobowitz DM, Hallows WC, Denu JM, Namboodiri AM. 2010. Nuclear–cytoplasmic localization of acetyl coenzyme a synthetase-1 in the rat brain. J Comp Neurol 518: 2952–2977. [DOI] [PMC free article] [PubMed] [Google Scholar]
- Bai P, Cantó C, Oudart H, Brunyánszki A, Cen Y, Thomas C, Yamamoto H, Huber A, Kiss B, Houtkooper RH, et al. 2011. PARP-1 inhibition increases mitochondrial metabolism through SIRT1 activation. Cell Metab 13: 461–468. [DOI] [PMC free article] [PubMed] [Google Scholar]
- Barbosa MT, Soares SM, Novak CM, Sinclair D, Levine JA, Aksoy P, Chini EN. 2007. The enzyme CD38 (a NAD glycohydrolase, EC 3.2.2.5) is necessary for the development of diet-induced obesity. FASEB J 21: 3629–3639. [DOI] [PubMed] [Google Scholar]
- Berger SL, Sassone-Corsi P. 2015. Metabolic signaling to chromatin. Cold Spring Harb Perspect Biol 8: a019463. [DOI] [PMC free article] [PubMed] [Google Scholar]
- Berger F, Lau C, Ziegler M. 2007. Regulation of poly(ADP-ribose) polymerase 1 activity by the phosphorylation state of the nuclear NAD biosynthetic enzyme NMN adenylyl transferase 1. Proc Natl Acad Sci 104: 3765–3770. [DOI] [PMC free article] [PubMed] [Google Scholar]
- Bheda P, Jing H, Wolberger C, Lin H. 2016. The substrate specificity of sirtuins. Annu Rev Biochem 85: 405–429. [DOI] [PubMed] [Google Scholar]
- Bieging KT, Mello SS, Attardi LD. 2014. Unravelling mechanisms of p53-mediated tumour suppression. Nat Rev Cancer 14: 359–370. [DOI] [PMC free article] [PubMed] [Google Scholar]
- Bird A. 2007. Perceptions of epigenetics. Nature 447: 396–398. [DOI] [PubMed] [Google Scholar]
- Birney E, Smith GD, Greally JM. 2016. Epigenome-wide association studies and the interpretation of disease -Omics. PLoS Genet 12: e1006105. [DOI] [PMC free article] [PubMed] [Google Scholar]
- Bock FJ, Todorova TT, Chang P. 2015. RNA regulation by poly(ADP-ribose) polymerases. Mol Cell 58: 959–969. [DOI] [PMC free article] [PubMed] [Google Scholar]
- Boffa LC, Vidali G, Mann RS, Allfrey VG. 1978. Suppression of histone deacetylation in vivo and in vitro by sodium butyrate. J Biol Chem 253: 3364–3366. [PubMed] [Google Scholar]
- Bonnet S, Archer SL, Allalunis-Turner J, Haromy A, Beaulieu C, Thompson R, Lee CT, Lopaschuk GD, Puttagunta L, Bonnet S, et al. 2007. A mitochondria-K+ channel axis is suppressed in cancer and its normalization promotes apoptosis and inhibits cancer growth. Cancer Cell 11: 37–51. [DOI] [PubMed] [Google Scholar]
- Boukouris AE, Zervopoulos SD, Michelakis ED. 2016. Metabolic enzymes moonlighting in the nucleus: metabolic regulation of gene transcription. Trends Biochem Sci 41: 712–730. [DOI] [PubMed] [Google Scholar]
- Briscoe J, Thérond PP. 2013. The mechanisms of Hedgehog signalling and its roles in development and disease. Nat Rev Mol Cell Biol 14: 416–429. [DOI] [PubMed] [Google Scholar]
- Bungard D, Fuerth BJ, Zeng PY, Faubert B, Maas NL, Viollet B, Carling D, Thompson CB, Jones RG, Berger SL. 2010. Signaling kinase AMPK activates stress-promoted transcription via histone H2B phosphorylation. Science 329: 1201–1205. [DOI] [PMC free article] [PubMed] [Google Scholar]
- Burkewitz K, Zhang Y, Mair WB. 2014. AMPK at the nexus of energetics and aging. Cell Metab 20: 10–25. [DOI] [PMC free article] [PubMed] [Google Scholar]
- Cai L, Sutter BM, Li B, Tu BP. 2011. Acetyl-CoA induces cell growth and proliferation by promoting the acetylation of histones at growth genes. Mol Cell 42: 426–437. [DOI] [PMC free article] [PubMed] [Google Scholar]
- Camacho-Pereira J, Tarragó MG, Chini CC, Nin V, Escande C, Warner GM, Puranik AS, Schoon RA, Reid JM, Galina A, et al. 2016. CD38 dictates age-related NAD decline and mitochondrial dysfunction through an SIRT3-dependent mechanism. Cell Metab 23: 1127–1139. [DOI] [PMC free article] [PubMed] [Google Scholar]
- Cambronne XA, Stewart ML, Kim D, Jones-Brunette AM, Morgan RK, Farrens DL, Cohen MS, Goodman RH. 2016. Biosensor reveals multiple sources for mitochondrial NAD+. Science 352: 1474–1477. [DOI] [PMC free article] [PubMed] [Google Scholar]
- Campbell KJ, White RJ. 2014. MYC regulation of cell growth through control of transcription by RNA polymerases I and III. Cold Spring Harb Perspect Med 4: a018408. [DOI] [PMC free article] [PubMed] [Google Scholar]
- Cantó C, Gerhart-Hines Z, Feige JN, Lagouge M, Noriega L, Milne JC, Elliott PJ, Puigserver P, Auwerx J. 2009. AMPK regulates energy expenditure by modulating NAD+ metabolism and SIRT1 activity. Nature 458: 1056–1060. [DOI] [PMC free article] [PubMed] [Google Scholar]
- Cantó C, Jiang LQ, Deshmukh AS, Mataki C, Coste A, Lagouge M, Zierath JR, Auwerx J. 2010. Interdependence of AMPK and SIRT1 for metabolic adaptation to fasting and exercise in skeletal muscle. Cell Metab 11: 213–219. [DOI] [PMC free article] [PubMed] [Google Scholar]
- Cantó C, Menzies KJ, Auwerx J. 2015. NAD+ metabolism and the control of energy homeostasis: a balancing act between mitochondria and the nucleus. Cell Metab 22: 31–53. [DOI] [PMC free article] [PubMed] [Google Scholar]
- Carey BW, Finley LW, Cross JR, Allis CD, Thompson CB. 2015. Intracellular α-ketoglutarate maintains the pluripotency of embryonic stem cells. Nature 518: 413–416. [DOI] [PMC free article] [PubMed] [Google Scholar]
- Castello A, Hentze MW, Preiss T. 2015. Metabolic enzymes enjoying new partnerships as RNA-binding proteins. Trends Endocrinol Metab 26: 746–757. [DOI] [PMC free article] [PubMed] [Google Scholar]
- Chalkiadaki A, Guarente L. 2015. The multifaceted functions of sirtuins in cancer. Nat Rev Cancer 15: 608–624. [DOI] [PubMed] [Google Scholar]
- Chaneton B, Hillmann P, Zheng L, Martin AC, Maddocks OD, Chokkathukalam A, Coyle JE, Jankevics A, Holding FP, Vousden KH, et al. 2012. Serine is a natural ligand and allosteric activator of pyruvate kinase M2. Nature 491: 458–462. [DOI] [PMC free article] [PubMed] [Google Scholar]
- Chang C, Su H, Zhang D, Wang Y, Shen Q, Liu B, Huang R, Zhou T, Peng C, Wong CC, et al. 2015. AMPK-dependent phosphorylation of GAPDH triggers Sirt1 activation and is necessary for autophagy upon glucose starvation. Mol Cell 60: 930–940. [DOI] [PubMed] [Google Scholar]
- Chen Y, Sprung R, Tang Y, Ball H, Sangras B, Kim SC, Falck JR, Peng J, Gu W, Zhao Y. 2007. Lysine propionylation and butyrylation are novel post-translational modifications in histones. Mol Cell Proteomics 6: 812–819. [DOI] [PMC free article] [PubMed] [Google Scholar]
- Chen D, Bruno J, Easlon E, Lin SJ, Cheng HL, Alt FW, Guarente L. 2008. Tissue-specific regulation of SIRT1 by calorie restriction. Genes Dev 22: 1753–1757. [DOI] [PMC free article] [PubMed] [Google Scholar]
- Chowdhury R, Yeoh KK, Tian YM, Hillringhaus L, Bagg EA, Rose NR, Leung IK, Li XS, Woon EC, Yang M, et al. 2011. The oncometabolite 2-hydroxyglutarate inhibits histone lysine demethylases. EMBO Rep 12: 463–469. [DOI] [PMC free article] [PubMed] [Google Scholar]
- Christofk HR, Vander Heiden MG, Harris MH, Ramanathan A, Gerszten RE, Wei R, Fleming MD, Schreiber SL, Cantley LC. 2008. The M2 splice isoform of pyruvate kinase is important for cancer metabolism and tumour growth. Nature 452: 230–233. [DOI] [PubMed] [Google Scholar]
- Coloff JL, Murphy JP, Braun CR, Harris IS, Shelton LM, Kami K, Gygi SP, Selfors LM, Brugge JS. 2016. Differential glutamate metabolism in proliferating and quiescent mammary epithelial cells. Cell Metab 23: 867–880. [DOI] [PubMed] [Google Scholar]
- Comerford SA, Huang Z, Du X, Wang Y, Cai L, Witkiewicz AK, Walters H, Tantawy MN, Fu A, Manning HC, et al. 2014. Acetate dependence of tumors. Cell 159: 1591–1602. [DOI] [PMC free article] [PubMed] [Google Scholar]
- Cummins JM, Rago C, Kohli M, Kinzler KW, Lengauer C, Vogelstein B. 2004. Tumour suppression: disruption of HAUSP gene stabilizes p53. Nature 428: 486. [DOI] [PubMed] [Google Scholar]
- Dai RP, Yu FX, Goh SR, Chng HW, Tan YL, Fu JL, Zheng L, Luo Y. 2008. Histone 2B (H2B) expression is confined to a proper NAD+/NADH redox status. J Biol Chem 283: 26894–26901. [DOI] [PubMed] [Google Scholar]
- Dang CV, Lewis BC. 1997. Role of oncogenic transcription factor c-Myc in cell cycle regulation, apoptosis and metabolism. J Biomed Sci 4: 269–278. [DOI] [PubMed] [Google Scholar]
- Dang L, White DW, Gross S, Bennett BD, Bittinger MA, Driggers EM, Fantin VR, Jang HG, Jin S, Keenan MC, et al. 2009. Cancer-associated IDH1 mutations produce 2-hydroxyglutarate. Nature 462: 739–744. [DOI] [PMC free article] [PubMed] [Google Scholar]
- Daxinger L, Whitelaw E. 2012. Understanding transgenerational epigenetic inheritance via the gametes in mammals. Nat Rev Genet 13: 153–162. [DOI] [PubMed] [Google Scholar]
- Day CR, Kempson SA. 2016. Betaine chemistry, roles, and potential use in liver disease. Biochim Biophys Acta 1860: 1098–1106. [DOI] [PubMed] [Google Scholar]
- DeBerardinis RJ. 2016. Proliferating cells conserve nitrogen to support growth. Cell Metab 23: 957–958. [DOI] [PubMed] [Google Scholar]
- Dhalluin C, Carlson JE, Zeng L, He C, Aggarwal AK, Zhou MM. 1999. Structure and ligand of a histone acetyltransferase bromodomain. Nature 399: 491–496. [DOI] [PubMed] [Google Scholar]
- Ding W, Smulan LJ, Hou NS, Taubert S, Watts JL, Walker AK. 2015. S-Adenosylmethionine levels govern innate immunity through distinct methylation-dependent pathways. Cell Metab 22: 633–645. [DOI] [PMC free article] [PubMed] [Google Scholar]
- Donohoe DR, Collins LB, Wali A, Bigler R, Sun W, Bultman SJ. 2012. The Warburg effect dictates the mechanism of butyrate-mediated histone acetylation and cell proliferation. Mol Cell 48: 612–626. [DOI] [PMC free article] [PubMed] [Google Scholar]
- Ducker GS, Chen L, Morscher RJ, Ghergurovich JM, Esposito M, Teng X, Kang Y, Rabinowitz JD. 2016. Reversal of cytosolic one-carbon flux compensates for loss of the mitochondrial folate pathway. Cell Metab 23: 1140–1153. [DOI] [PMC free article] [PubMed] [Google Scholar]
- Evans RM, Mangelsdorf DJ. 2014. Nuclear receptors, RXR, and the big bang. Cell 157: 255–266. [DOI] [PMC free article] [PubMed] [Google Scholar]
- Evertts AG, Zee BM, Dimaggio PA, Gonzales-Cope M, Coller HA, Garcia BA. 2013. Quantitative dynamics of the link between cellular metabolism and histone acetylation. J Biol Chem 288: 12142–12151. [DOI] [PMC free article] [PubMed] [Google Scholar]
- Faesen AC, Dirac AM, Shanmugham A, Ovaa H, Perrakis A, Sixma TK. 2011. Mechanism of USP7/HAUSP activation by its C-terminal ubiquitin-like domain and allosteric regulation by GMP-synthetase. Mol Cell 44: 147–159. [DOI] [PubMed] [Google Scholar]
- Feldman JL, Baeza J, Denu JM. 2013. Activation of the protein deacetylase SIRT6 by long-chain fatty acids and widespread deacylation by mammalian sirtuins. J Biol Chem 288: 31350–31356. [DOI] [PMC free article] [PubMed] [Google Scholar]
- Figueroa ME, Abdel-Wahab O, Lu C, Ward PS, Patel J, Shih A, Li Y, Bhagwat N, Vasanthakumar A, Fernandez HF, et al. 2010. Leukemic IDH1 and IDH2 mutations result in a hypermethylation phenotype, disrupt TET2 function, and impair hematopoietic differentiation. Cancer Cell 18: 553–567. [DOI] [PMC free article] [PubMed] [Google Scholar]
- Filippakopoulos P, Knapp S. 2014. Targeting bromodomains: epigenetic readers of lysine acetylation. Nat Rev Drug Discov 13: 337–356. [DOI] [PubMed] [Google Scholar]
- Frappier L, Verrijzer CP. 2011. Gene expression control by protein deubiquitinases. Curr Opin Genet Dev 21: 207–213. [DOI] [PubMed] [Google Scholar]
- Friis RM, Wu BP, Reinke SN, Hockman DJ, Sykes BD, Schultz MC. 2009. A glycolytic burst drives glucose induction of global histone acetylation by picNuA4 and SAGA. Nucleic Acids Res 37: 3969–3980. [DOI] [PMC free article] [PubMed] [Google Scholar]
- Fulco M, Cen Y, Zhao P, Hoffman EP, McBurney MW, Sauve AA, Sartorelli V. 2008. Glucose restriction inhibits skeletal myoblast differentiation by activating SIRT1 through AMPK-mediated regulation of Nampt. Dev Cell 14: 661–673. [DOI] [PMC free article] [PubMed] [Google Scholar]
- Gao X, Wang H, Yang JJ, Liu X, Liu ZR. 2012. Pyruvate kinase M2 regulates gene transcription by acting as a protein kinase. Mol Cell 45: 598–609. [DOI] [PMC free article] [PubMed] [Google Scholar]
- Garten A, Schuster S, Penke M, Gorski T, de Giorgis T, Kiess W. 2015. Physiological and pathophysiological roles of NAMPT and NAD metabolism. Nat Rev Endocrinol 11: 535–546. [DOI] [PubMed] [Google Scholar]
- Gaspar-Maia A, Alajem A, Meshorer E, Ramalho-Santos M. 2011. Open chromatin in pluripotency and reprogramming. Nat Rev Mol Cell Biol 12: 36–47. [DOI] [PMC free article] [PubMed] [Google Scholar]
- Gibson BA, Kraus WL. 2012. New insights into the molecular and cellular functions of poly(ADP-ribose) and PARPs. Nat Rev Mol Cell Biol 13: 411–424. [DOI] [PubMed] [Google Scholar]
- Gibson BA, Zhang Y, Jiang H, Hussey KM, Shrimp JH, Lin H, Schwede F, Yu Y, Kraus WL. 2016. Chemical genetic discovery of PARP targets reveals a role for PARP-1 in transcription elongation. Science 353: 45–50. [DOI] [PMC free article] [PubMed] [Google Scholar]
- Gomes AP, Price NL, Ling AJ, Moslehi JJ, Montgomery MK, Rajman L, White JP, Teodoro JS, Wrann CD, Hubbard BP, et al. 2013. Declining NAD+ induces a pseudohypoxic state disrupting nuclear-mitochondrial communication during aging. Cell 155: 1624–1638. [DOI] [PMC free article] [PubMed] [Google Scholar]
- Goudarzi A, Zhang D, Huang H, Barral S, Kwon OK, Qi S, Tang Z, Buchou T, Vitte AL, He T, et al. 2016. Dynamic competing histone H4 K5K8 acetylation and butyrylation are hallmarks of highly active gene promoters. Mol Cell 62: 169–180. [DOI] [PMC free article] [PubMed] [Google Scholar]
- Greer EL, Shi Y. 2012. Histone methylation: a dynamic mark in health, disease and inheritance. Nat Rev Genet 13: 343–357. [DOI] [PMC free article] [PubMed] [Google Scholar]
- Gross S, Cairns RA, Minden MD, Driggers EM, Bittinger MA, Jang HG, Sasaki M, Jin S, Schenkein DP, Su SM, et al. 2010. Cancer-associated metabolite 2-hydroxyglutarate accumulates in acute myelogenous leukemia with isocitrate dehydrogenase 1 and 2 mutations. J Exp Med 207: 339–344. [DOI] [PMC free article] [PubMed] [Google Scholar]
- Guarente L. 2013. Calorie restriction and sirtuins revisited. Genes Dev 27: 2072–2085. [DOI] [PMC free article] [PubMed] [Google Scholar]
- Guilloteau P, Martin L, Eeckhaut V, Ducatelle R, Zabielski R, Van Immerseel F. 2010. From the gut to the peripheral tissues: the multiple effects of butyrate. Nutr Res Rev 23: 366–384. [DOI] [PubMed] [Google Scholar]
- Guo M, Schimmel P. 2013. Essential nontranslational functions of tRNA synthetases. Nat Chem Biol 9: 145–153. [DOI] [PMC free article] [PubMed] [Google Scholar]
- Hales CN, Barker DJ. 2001. The thrifty phenotype hypothesis. Br Med Bull 60: 5–20. [DOI] [PubMed] [Google Scholar]
- Hallows WC, Yu W, Denu JM. 2012. Regulation of glycolytic enzyme phosphoglycerate mutase-1 by Sirt1 protein-mediated deacetylation. J Biol Chem 287: 3850–3858. [DOI] [PMC free article] [PubMed] [Google Scholar]
- Heard E, Martienssen RA. 2014. Transgenerational epigenetic inheritance: myths and mechanisms. Cell 157: 95–109. [DOI] [PMC free article] [PubMed] [Google Scholar]
- Hebert AS, Dittenhafer-Reed KE, Yu W, Bailey DJ, Selen ES, Boersma MD, Carson JJ, Tonelli M, Balloon AJ, Higbee AJ, et al. 2013. Calorie restriction and SIRT3 trigger global reprogramming of the mitochondrial protein acetylome. Mol Cell 49: 186–199. [DOI] [PMC free article] [PubMed] [Google Scholar]
- Hedstrom L. 2009. IMP dehydrogenase: structure, mechanism, and inhibition. Chem Rev 109: 2903–2928. [DOI] [PMC free article] [PubMed] [Google Scholar]
- Herranz D, Serrano M. 2010. SIRT1: recent lessons from mouse models. Nat Rev Cancer 10: 819–823. [DOI] [PMC free article] [PubMed] [Google Scholar]
- Hirschey MD, Zhao Y. 2015. Metabolic regulation by lysine malonylation, succinylation, and glutarylation. Mol Cell Proteomics 14: 2308–2315. [DOI] [PMC free article] [PubMed] [Google Scholar]
- Hirschey MD, Shimazu T, Goetzman E, Jing E, Schwer B, Lombard DB, Grueter CA, Harris C, Biddinger S, Ilkayeva OR, et al. 2010. SIRT3 regulates mitochondrial fatty-acid oxidation by reversible enzyme deacetylation. Nature 464: 121–125. [DOI] [PMC free article] [PubMed] [Google Scholar]
- Hock A, Vousden KH. 2010. Regulation of the p53 pathway by ubiquitin and related proteins. Int J Biochem Cell Biol 42: 1618–1621. [DOI] [PubMed] [Google Scholar]
- Horikoshi M, Beaumont RN, Day FR, Warrington NM, Kooijman MN, Fernandez-Tajes J, Feenstra B, van Zuydam NR, Gaulton KJ, Grarup N, et al. 2016. Genome-wide associations for birth weight and correlations with adult disease. Nature 538: 248–252. [DOI] [PMC free article] [PubMed] [Google Scholar]
- Hoshino A, Hirst JA, Fujii H. 2007. Regulation of cell proliferation by interleukin-3-induced nuclear translocation of pyruvate kinase. J Biol Chem 282: 17706–17711. [DOI] [PubMed] [Google Scholar]
- Hosios AM, Fiske BP, Gui DY, Vander Heiden MG. 2015. Lack of evidence for PKM2 protein kinase activity. Mol Cell 59: 850–857. [DOI] [PMC free article] [PubMed] [Google Scholar]
- Hwang IY, Kwak S, Lee S, Kim H, Lee SE, Kim JH, Kim YA, Jeon YK, Chung DH, Jin X, et al. 2016. Psat1-dependent fluctuations in α-ketoglutarate affect the timing of ESC differentiation. Cell Metab 24: 494–501. [DOI] [PubMed] [Google Scholar]
- Imai S, Guarente L. 2014. NAD+ and sirtuins in aging and disease. Trends Cell Biol 24: 464–471. [DOI] [PMC free article] [PubMed] [Google Scholar]
- Iqbal K, Tran DA, Li AX, Warden C, Bai AY, Singh P, Wu X, Pfeifer GP, Szabó PE. 2015. Deleterious effects of endocrine disruptors are corrected in the mammalian germline by epigenome reprogramming. Genome Biol 16: 59. [DOI] [PMC free article] [PubMed] [Google Scholar]
- Israelsen WJ, Vander Heiden MG. 2015. Pyruvate kinase: function, regulation and role in cancer. Semin Cell Dev Biol 43: 43–51. [DOI] [PMC free article] [PubMed] [Google Scholar]
- Israelsen WJ, Dayton TL, Davidson SM, Fiske BP, Hosios AM, Bellinger G, Li J, Yu Y, Sasaki M, Horner JW, et al. 2013. PKM2 isoform-specific deletion reveals a differential requirement for pyruvate kinase in tumor cells. Cell 155: 397–409. [DOI] [PMC free article] [PubMed] [Google Scholar]
- Ito K, Suda T. 2014. Metabolic requirements for the maintenance of self-renewing stem cells. Nat Rev Mol Cell Biol 15: 243–256. [DOI] [PMC free article] [PubMed] [Google Scholar]
- Kaelin WG Jr, McKnight SL. 2013. Influence of metabolism on epigenetics and disease. Cell 153: 56–69. [DOI] [PMC free article] [PubMed] [Google Scholar]
- Katoh Y, Ikura T, Hoshikawa Y, Tashiro S, Ito T, Ohta M, Kera Y, Noda T, Igarashi K. 2011. Methionine adenosyltransferase II serves as a transcriptional corepressor of Maf oncoprotein. Mol Cell 41: 554–566. [DOI] [PubMed] [Google Scholar]
- Keith B, Johnson RS, Simon MC. 2011. HIF1α and HIF2α: sibling rivalry in hypoxic tumour growth and progression. Nat Rev Cancer 12: 9–22. [DOI] [PMC free article] [PubMed] [Google Scholar]
- Keller KE, Tan IS, Lee YS. 2012. SAICAR stimulates pyruvate kinase isoform M2 and promotes cancer cell survival in glucose-limited conditions. Science 338: 1069–1072. [DOI] [PMC free article] [PubMed] [Google Scholar]
- Kennedy BK, Lamming DW. 2016. The mechanistic target of rapamycin: the grand conducTOR of metabolism and aging. Cell Metab 23: 990–1003. [DOI] [PMC free article] [PubMed] [Google Scholar]
- Kera Y, Katoh Y, Ohta M, Matsumoto M, Takano-Yamamoto T, Igarashi K. 2013. Methionine adenosyltransferase II-dependent histone H3K9 methylation at the COX-2 gene locus. J Biol Chem 288: 13592–13601. [DOI] [PMC free article] [PubMed] [Google Scholar]
- Killian JK, Kim SY, Miettinen M, Smith C, Merino M, Tsokos M, Quezado M, Smith WI Jr, Jahromi MS, Xekouki P, et al. 2013. Succinate dehydrogenase mutation underlies global epigenomic divergence in gastrointestinal stromal tumor. Cancer Discov 3: 648–657. [DOI] [PMC free article] [PubMed] [Google Scholar]
- Kim JW, Tchernyshyov I, Semenza GL, Dang CV. 2006. HIF-1-mediated expression of pyruvate dehydrogenase kinase: a metabolic switch required for cellular adaptation to hypoxia. Cell Metab 3: 177–185. [DOI] [PubMed] [Google Scholar]
- Koivunen P, Lee S, Duncan CG, Lopez G, Lu G, Ramkissoon S, Losman JA, Joensuu P, Bergmann U, Gross S, et al. 2012. Transformation by the (R)-enantiomer of 2-hydroxyglutarate linked to EGLN activation. Nature 483: 484–488. [DOI] [PMC free article] [PubMed] [Google Scholar]
- Kooistra SM, Helin K. 2012. Molecular mechanisms and potential functions of histone demethylases. Nat Rev Mol Cell Biol 13: 297–311. [DOI] [PubMed] [Google Scholar]
- Kornberg MD, Sen N, Hara MR, Juluri KR, Nguyen JV, Snowman AM, Law L, Hester LD, Snyder SH. 2010. GAPDH mediates nitrosylation of nuclear proteins. Nat Cell Biol 12: 1094–1100. [DOI] [PMC free article] [PubMed] [Google Scholar]
- Koster MJ, Snel B, Timmers HT. 2015. Genesis of chromatin and transcription dynamics in the origin of species. Cell 161: 724–736. [DOI] [PubMed] [Google Scholar]
- Kozhevnikova EN, van der Knaap JA, Pindyurin AV, Ozgur Z, van Ijcken WF, Moshkin YM, Verrijzer CP. 2012. Metabolic enzyme IMPDH is also a transcription factor regulated by cellular state. Mol Cell 47: 133–139. [DOI] [PubMed] [Google Scholar]
- Krishnakumar R, Gamble MJ, Frizzell KM, Berrocal JG, Kininis M, Kraus WL. 2008. Reciprocal binding of PARP-1 and histone H1 at promoters specifies transcriptional outcomes. Science 319: 819–821. [DOI] [PubMed] [Google Scholar]
- Kurdistani SK. 2011. Histone modifications in cancer biology and prognosis. Prog Drug Res 67: 91–106. [DOI] [PubMed] [Google Scholar]
- Kurdistani SK. 2014. Chromatin: a capacitor of acetate for integrated regulation of gene expression and cell physiology. Curr Opin Genet Dev 26: 53–58. [DOI] [PMC free article] [PubMed] [Google Scholar]
- Labuschagne CF, van den Broek NJ, Mackay GM, Vousden KH, Maddocks OD. 2014. Serine, but not glycine, supports one-carbon metabolism and proliferation of cancer cells. Cell Rep 7: 1248–1258. [DOI] [PubMed] [Google Scholar]
- Laffel L. 1999. Ketone bodies: a review of physiology, pathophysiology and application of monitoring to diabetes. Diabetes Metab Res Rev 15: 412–426. [DOI] [PubMed] [Google Scholar]
- Laugesen A, Helin K. 2014. Chromatin repressive complexes in stem cells, development, and cancer. Cell Stem Cell 14: 735–751. [DOI] [PubMed] [Google Scholar]
- Lecona E, Narendra V, Reinberg D. 2015. USP7 cooperates with SCML2 to regulate the activity of PRC1. Mol Cell Biol 35: 1157–1168. [DOI] [PMC free article] [PubMed] [Google Scholar]
- Lee JV, Carrer A, Shah S, Snyder NW, Wei S, Venneti S, Worth AJ, Yuan ZF, Lim HW, Liu S, et al. 2014. Akt-dependent metabolic reprogramming regulates tumor cell histone acetylation. Cell Metab 20: 306–319. [DOI] [PMC free article] [PubMed] [Google Scholar]
- Letouzé E, Martinelli C, Loriot C, Burnichon N, Abermil N, Ottolenghi C, Janin M, Menara M, Nguyen AT, Benit P, et al. 2013. SDH mutations establish a hypermethylator phenotype in paraganglioma. Cancer Cell 23: 739–752. [DOI] [PubMed] [Google Scholar]
- Levine M, Cattoglio C, Tjian R. 2014. Looping back to leap forward: transcription enters a new era. Cell 157: 13–25. [DOI] [PMC free article] [PubMed] [Google Scholar]
- Li M, Chen D, Shiloh A, Luo J, Nikolaev AY, Qin J, Gu W. 2002. Deubiquitination of p53 by HAUSP is an important pathway for p53 stabilization. Nature 416: 648–653. [DOI] [PubMed] [Google Scholar]
- Li M, Brooks CL, Kon N, Gu W. 2004. A dynamic role of HAUSP in the p53–Mdm2 pathway. Mol Cell 13: 879–886. [DOI] [PubMed] [Google Scholar]
- Li B, Qiu B, Lee DS, Walton ZE, Ochocki JD, Mathew LK, Mancuso A, Gade TP, Keith B, Nissim I, et al. 2014. Fructose-1,6-bisphosphatase opposes renal carcinoma progression. Nature 513: 251–255. [DOI] [PMC free article] [PubMed] [Google Scholar]
- Li S, Swanson SK, Gogol M, Florens L, Washburn MP, Workman JL, Suganuma T. 2015. Serine and SAM responsive complex SESAME regulates histone modification crosstalk by sensing cellular metabolism. Mol Cell 60: 408–421. [DOI] [PubMed] [Google Scholar]
- Li Y, Sabari BR, Panchenko T, Wen H, Zhao D, Guan H, Wan L, Huang H, Tang Z, Zhao Y, et al. 2016. Molecular coupling of histone crotonylation and active transcription by AF9 YEATS domain. Mol Cell 62: 181–193. [DOI] [PMC free article] [PubMed] [Google Scholar]
- Locasale JW. 2013. Serine, glycine and one-carbon units: cancer metabolism in full circle. Nat Rev Cancer 13: 572–583. [DOI] [PMC free article] [PubMed] [Google Scholar]
- Locasale JW, Grassian AR, Melman T, Lyssiotis CA, Mattaini KR, Bass AJ, Heffron G, Metallo CM, Muranen T, Sharfi H, et al. 2011. Phosphoglycerate dehydrogenase diverts glycolytic flux and contributes to oncogenesis. Nat Genet 43: 869–874. [DOI] [PMC free article] [PubMed] [Google Scholar]
- Losman JA, Kaelin WG Jr. 2013. What a difference a hydroxyl makes: mutant IDH, (R)-2-hydroxyglutarate, and cancer. Genes Dev 27: 836–852. [DOI] [PMC free article] [PubMed] [Google Scholar]
- Losman JA, Looper RE, Koivunen P, Lee S, Schneider RK, McMahon C, Cowley GS, Root DE, Ebert BL, Kaelin WG Jr. 2013. (R)-2-hydroxyglutarate is sufficient to promote leukemogenesis and its effects are reversible. Science 339: 1621–1625. [DOI] [PMC free article] [PubMed] [Google Scholar]
- Lu C, Ward PS, Kapoor GS, Rohle D, Turcan S, Abdel-Wahab O, Edwards CR, Khanin R, Figueroa ME, Melnick A, et al. 2012. IDH mutation impairs histone demethylation and results in a block to cell differentiation. Nature 483: 474–478. [DOI] [PMC free article] [PubMed] [Google Scholar]
- Luger K, Mäder AW, Richmond RK, Sargent DF, Richmond TJ. 1997. Crystal structure of the nucleosome core particle at 2.8 Å resolution. Nature 389: 251–260. [DOI] [PubMed] [Google Scholar]
- Luo W, Hu H, Chang R, Zhong J, Knabel M, O'Meally R, Cole RN, Pandey A, Semenza GL. 2011. Pyruvate kinase M2 is a PHD3-stimulated coactivator for hypoxia-inducible factor 1. Cell 145: 732–744. [DOI] [PMC free article] [PubMed] [Google Scholar]
- Lupton JR. 2004. Microbial degradation products influence colon cancer risk: the butyrate controversy. J Nutr 134: 479–482. [DOI] [PubMed] [Google Scholar]
- Maddocks OD, Labuschagne CF, Adams PD, Vousden KH. 2016. Serine metabolism supports the methionine cycle and DNA/RNA methylation through de novo ATP synthesis in cancer cells. Mol Cell 61: 210–221. [DOI] [PMC free article] [PubMed] [Google Scholar]
- Maertens GN, El Messaoudi-Aubert S, Elderkin S, Hiom K, Peters G. 2010. Ubiquitin-specific proteases 7 and 11 modulate Polycomb regulation of the INK4a tumour suppressor. EMBO J. 29: 2553–2565. [DOI] [PMC free article] [PubMed] [Google Scholar]
- Majmundar AJ, Wong WJ, Simon MC. 2010. Hypoxia-inducible factors and the response to hypoxic stress. Mol Cell 40: 294–309. [DOI] [PMC free article] [PubMed] [Google Scholar]
- Mariño G, Pietrocola F, Eisenberg T, Kong Y, Malik SA, Andryushkova A, Schroeder S, Pendl T, Harger A, Niso-Santano M, et al. 2014. Regulation of autophagy by cytosolic acetyl-coenzyme A. Mol Cell 53: 710–725. [DOI] [PubMed] [Google Scholar]
- Mashimo T, Pichumani K, Vemireddy V, Hatanpaa KJ, Singh DK, Sirasanagandla S, Nannepaga S, Piccirillo SG, Kovacs Z, Foong C, et al. 2014. Acetate is a bioenergetic substrate for human glioblastoma and brain metastases. Cell 159: 1603–1614. [DOI] [PMC free article] [PubMed] [Google Scholar]
- Masliah-Planchon J, Bièche I, Guinebretière JM, Bourdeaut F, Delattre O. 2015. SWI/SNF chromatin remodeling and human malignancies. Annu Rev Pathol 10: 145–171. [DOI] [PubMed] [Google Scholar]
- Massudi H, Grant R, Braidy N, Guest J, Farnsworth B, Guillemin GJ. 2012. Age-associated changes in oxidative stress and NAD+ metabolism in human tissue. PLoS One 7: e42357. [DOI] [PMC free article] [PubMed] [Google Scholar]
- Mazurek S, Boschek CB, Hugo F, Eigenbrodt E. 2005. Pyruvate kinase type M2 and its role in tumor growth and spreading. Semin Cancer Biol 15: 300–308. [DOI] [PubMed] [Google Scholar]
- McBrian MA, Behbahan IS, Ferrari R, Su T, Huang TW, Li K, Hong CS, Christofk HR, Vogelauer M, Seligson DB, et al. 2013. Histone acetylation regulates intracellular pH. Mol Cell 49: 310–321. [DOI] [PMC free article] [PubMed] [Google Scholar]
- Mentch SJ, Mehrmohamadi M, Huang L, Liu X, Gupta D, Mattocks D, Gómez Padilla P, Ables G, Bamman MM, Thalacker-Mercer AE, et al. 2015. Histone methylation dynamics and gene regulation occur through the sensing of one-carbon metabolism. Cell Metab 22: 861–873. [DOI] [PMC free article] [PubMed] [Google Scholar]
- Menzies KJ, Zhang H, Katsyuba E, Auwerx J. 2016. Protein acetylation in metabolism—metabolites and cofactors. Nat Rev Endocrinol 12: 43–60. [DOI] [PubMed] [Google Scholar]
- Morgan MA, Shilatifard A. 2015. Chromatin signatures of cancer. Genes Dev 29: 238–249. [DOI] [PMC free article] [PubMed] [Google Scholar]
- Mortimer SE, Xu D, McGrew D, Hamaguchi N, Lim HC, Bowne SJ, Daiger SP, Hedstrom L. 2008. IMP dehydrogenase type 1 associates with polyribosomes translating rhodopsin mRNA. J Biol Chem 283: 36354–36360. [DOI] [PMC free article] [PubMed] [Google Scholar]
- Mouchiroud L, Houtkooper RH, Moullan N, Katsyuba E, Ryu D, Cantó C, Mottis A, Jo YS, Viswanathan M, Schoonjans K, et al. 2013. The NAD+/sirtuin pathway modulates longevity through activation of mitochondrial UPR and FOXO signaling. Cell 154: 430–441. [DOI] [PMC free article] [PubMed] [Google Scholar]
- Moussaieff A, Rouleau M, Kitsberg D, Cohen M, Levy G, Barasch D, Nemirovski A, Shen-Orr S, Laevsky I, Amit M, et al. 2015. Glycolysis-mediated changes in acetyl-CoA and histone acetylation control the early differentiation of embryonic stem cells. Cell Metab 21: 392–402. [DOI] [PubMed] [Google Scholar]
- Nakahata Y, Sahar S, Astarita G, Kaluzova M, Sassone-Corsi P. 2009. Circadian control of the NAD+ salvage pathway by CLOCK–SIRT1. Science 324: 654–657. [DOI] [PMC free article] [PubMed] [Google Scholar]
- Papandreou I, Cairns RA, Fontana L, Lim AL, Denko NC. 2006. HIF-1 mediates adaptation to hypoxia by actively downregulating mitochondrial oxygen consumption. Cell Metab 3: 187–197. [DOI] [PubMed] [Google Scholar]
- Patel DJ, Wang Z. 2013. Readout of epigenetic modifications. Annu Rev Biochem 82: 81–118. [DOI] [PMC free article] [PubMed] [Google Scholar]
- Peleg S, Feller C, Forne I, Schiller E, Sévin DC, Schauer T, Regnard C, Straub T, Prestel M, Klima C, et al. 2016. Life span extension by targeting a link between metabolism and histone acetylation in Drosophila. EMBO Rep 17: 455–469. [DOI] [PMC free article] [PubMed] [Google Scholar]
- Pengelly AR, Copur Ö, Jäckle H, Herzig A, Müller J. 2013. A histone mutant reproduces the phenotype caused by loss of histone-modifying factor Polycomb. Science 339: 698–699. [DOI] [PubMed] [Google Scholar]
- Petesch SJ, Lis JT. 2012. Activator-induced spread of poly(ADP-ribose) polymerase promotes nucleosome loss at Hsp70. Mol Cell 45: 64–74. [DOI] [PMC free article] [PubMed] [Google Scholar]
- Ptashne M. 2007. On the use of the word ‘epigenetic’. Curr Biol 17: R233–R236. [DOI] [PubMed] [Google Scholar]
- Raghow R, Yellaturu C, Deng X, Park EA, Elam MB. 2008. SREBPs: the crossroads of physiological and pathological lipid homeostasis. Trends Endocrinol Metab 19: 65–73. [DOI] [PubMed] [Google Scholar]
- Ramsey KM, Yoshino J, Brace CS, Abrassart D, Kobayashi Y, Marcheva B, Hong HK, Chong JL, Buhr ED, Lee C, et al. 2009. Circadian clock feedback cycle through NAMPT-mediated NAD+ biosynthesis. Science 324: 651–654. [DOI] [PMC free article] [PubMed] [Google Scholar]
- Rando OJ, Simmons RA. 2015. I'm eating for two: parental dietary effects on offspring metabolism. Cell 161: 93–105. [DOI] [PMC free article] [PubMed] [Google Scholar]
- Rasmussen KD, Helin K. 2016. Role of TET enzymes in DNA methylation, development, and cancer. Genes Dev 30: 733–750. [DOI] [PMC free article] [PubMed] [Google Scholar]
- Reddy BA, van der Knaap JA, Bot AG, Mohd-Sarip A, Dekkers DH, Timmermans MA, Martens JW, Demmers JA, Verrijzer CP. 2014. Nucleotide biosynthetic enzyme GMP synthase is a TRIM21-controlled relay of p53 stabilization. Mol Cell 53: 458–470. [DOI] [PubMed] [Google Scholar]
- Rodgers JT, Lerin C, Haas W, Gygi SP, Spiegelman BM, Puigserver P. 2005. Nutrient control of glucose homeostasis through a complex of PGC-1α and SIRT1. Nature 434: 113–118. [DOI] [PubMed] [Google Scholar]
- Rohle D, Popovici-Muller J, Palaskas N, Turcan S, Grommes C, Campos C, Tsoi J, Clark O, Oldrini B, Komisopoulou E, et al. 2013. An inhibitor of mutant IDH1 delays growth and promotes differentiation of glioma cells. Science 340: 626–630. [DOI] [PMC free article] [PubMed] [Google Scholar]
- Ryall JG, Cliff T, Dalton S, Sartorelli V. 2015a. Metabolic reprogramming of stem cell epigenetics. Cell Stem Cell 17: 651–662. [DOI] [PMC free article] [PubMed] [Google Scholar]
- Ryall JG, Dell'Orso S, Derfoul A, Juan A, Zare H, Feng X, Clermont D, Koulnis M, Gutierrez-Cruz G, Fulco M, et al. 2015b. The NAD+-dependent SIRT1 deacetylase translates a metabolic switch into regulatory epigenetics in skeletal muscle stem cells. Cell Stem Cell 16: 171–183. [DOI] [PMC free article] [PubMed] [Google Scholar]
- Sabari BR, Tang Z, Huang H, Yong-Gonzalez V, Molina H, Kong HE, Dai L, Shimada M, Cross JR, Zhao Y, et al. 2015. Intracellular crotonyl-CoA stimulates transcription through p300 catalyzed histone crotonylation. Mol Cell 58: 203–215. [DOI] [PMC free article] [PubMed] [Google Scholar]
- Sadhu MJ, Guan Q, Li F, Sales-Lee J, Iavarone AT, Hammond MC, Cande WZ, Rine J. 2013. Nutritional control of epigenetic processes in yeast and human cells. Genetics 195: 831–844. [DOI] [PMC free article] [PubMed] [Google Scholar]
- Sainsbury S, Bernecky C, Cramer P. 2015. Structural basis of transcription initiation by RNA polymerase II. Nat Rev Mol Cell Biol 16: 129–143. [DOI] [PubMed] [Google Scholar]
- Sanchez R, Zhou MM. 2009. The role of human bromodomains in chromatin biology and gene transcription. Curr Opin Drug Discov Devel 12: 659–665. [PMC free article] [PubMed] [Google Scholar]
- Sarkari F, Sanchez-Alcaraz T, Wang S, Holowaty MN, Sheng Y, Frappier L. 2009. EBNA1-mediated recruitment of a histone H2B deubiquitylating complex to the Epstein-Barr virus latent origin of DNA replication. PLoS Pathog 5: e1000624. [DOI] [PMC free article] [PubMed] [Google Scholar]
- Schübeler D. 2015. Function and information content of DNA methylation. Nature 517: 321–326. [DOI] [PubMed] [Google Scholar]
- Schug ZT, Peck B, Jones DT, Zhang Q, Grosskurth S, Alam IS, Goodwin LM, Smethurst E, Mason S, Blyth K, et al. 2015. Acetyl-CoA synthetase 2 promotes acetate utilization and maintains cancer cell growth under metabolic stress. Cancer Cell 27: 57–71. [DOI] [PMC free article] [PubMed] [Google Scholar]
- Schulz LC. 2010. The Dutch Hunger Winter and the developmental origins of health and disease. Proc Natl Acad Sci 107: 16757–16758. [DOI] [PMC free article] [PubMed] [Google Scholar]
- Sciacovelli M, Gonçalves E, Johnson TI, Zecchini VR, da Costa AS, Gaude E, Drubbel AV, Theobald SJ, Abbo SR, Tran MG, et al. 2016. Fumarate is an epigenetic modifier that elicits epithelial-to-mesenchymal transition. Nature 537: 544–547. [DOI] [PMC free article] [PubMed] [Google Scholar]
- Sealy L, Chalkley R. 1978. The effect of sodium butyrate on histone modification. Cell 14: 115–121. [DOI] [PubMed] [Google Scholar]
- Sen N, Hara MR, Kornberg MD, Cascio MB, Bae BI, Shahani N, Thomas B, Dawson TM, Dawson VL, Snyder SH, et al. 2008. Nitric oxide-induced nuclear GAPDH activates p300/CBP and mediates apoptosis. Nat Cell Biol 10: 866–873. [DOI] [PMC free article] [PubMed] [Google Scholar]
- Shea JM, Serra RW, Carone BR, Shulha HP, Kucukural A, Ziller MJ, Vallaster MP, Gu H, Tapper AR, Gardner PD, et al. 2015. Genetic and epigenetic variation, but not diet, shape the sperm methylome. Dev Cell. 35: 750–758. [DOI] [PMC free article] [PubMed] [Google Scholar]
- Shi Y, Lan F, Matson C, Mulligan P, Whetstine JR, Cole PA, Casero RA, Shi Y. 2004. Histone demethylation mediated by the nuclear amine oxidase homolog LSD1. Cell 119: 941–953. [DOI] [PubMed] [Google Scholar]
- Shilatifard A. 2012. The COMPASS family of histone H3K4 methylases: mechanisms of regulation in development and disease pathogenesis. Annu Rev Biochem 81: 65–95. [DOI] [PMC free article] [PubMed] [Google Scholar]
- Shimazu T, Hirschey MD, Newman J, He W, Shirakawa K, Le Moan N, Grueter CA, Lim H, Saunders LR, Stevens RD, et al. 2013. Suppression of oxidative stress by β-hydroxybutyrate, an endogenous histone deacetylase inhibitor. Science 339: 211–214. [DOI] [PMC free article] [PubMed] [Google Scholar]
- Shiraki N, Shiraki Y, Tsuyama T, Obata F, Miura M, Nagae G, Aburatani H, Kume K, Endo F, Kume S. 2014. Methionine metabolism regulates maintenance and differentiation of human pluripotent stem cells. Cell Metab 19: 780–794. [DOI] [PubMed] [Google Scholar]
- Shogren-Knaak M, Ishii H, Sun JM, Pazin MJ, Davie JR, Peterson CL. 2006. Histone H4–K16 acetylation controls chromatin structure and protein interactions. Science 311: 844–847. [DOI] [PubMed] [Google Scholar]
- Shyh-Chang N, Locasale JW, Lyssiotis CA, Zheng Y, Teo RY, Ratanasirintrawoot S, Zhang J, Onder T, Unternaehrer JJ, Zhu H, et al. 2013. Influence of threonine metabolism on S-adenosylmethionine and histone methylation. Science 339: 222–226. [DOI] [PMC free article] [PubMed] [Google Scholar]
- Smithells D. 1998. Does thalidomide cause second generation birth defects? Drug Safety 19: 339–341. [DOI] [PubMed] [Google Scholar]
- Strömland K, Philipson E, Andersson Grönlund M. 2002. Offspring of male and female parents with thalidomide embryopathy: birth defects and functional anomalies. Teratology 66: 115–121. [DOI] [PubMed] [Google Scholar]
- Sutendra G, Kinnaird A, Dromparis P, Paulin R, Stenson TH, Haromy A, Hashimoto K, Zhang N, Flaim E, Michelakis ED. 2014. A nuclear pyruvate dehydrogenase complex is important for the generation of acetyl-CoA and histone acetylation. Cell 158: 84–97. [DOI] [PubMed] [Google Scholar]
- Swygert SG, Peterson CL. 2014. Chromatin dynamics: interplay between remodeling enzymes and histone modifications. Biochim Biophys Acta 1839: 728–736. [DOI] [PMC free article] [PubMed] [Google Scholar]
- Takahashi H, McCaffery JM, Irizarry RA, Boeke JD. 2006. Nucleocytosolic acetyl-coenzyme a synthetase is required for histone acetylation and global transcription. Mol Cell 23: 207–217. [DOI] [PubMed] [Google Scholar]
- Tan M, Luo H, Lee S, Jin F, Yang JS, Montellier E, Buchou T, Cheng Z, Rousseaux S, Rajagopal N, et al. 2011. Identification of 67 histone marks and histone lysine crotonylation as a new type of histone modification. Cell 146: 1016–1028. [DOI] [PMC free article] [PubMed] [Google Scholar]
- Tennessen JM, Baker KD, Lam G, Evans J, Thummel CS. 2011. The Drosophila estrogen-related receptor directs a metabolic switch that supports developmental growth. Cell Metab 13: 139–148. [DOI] [PMC free article] [PubMed] [Google Scholar]
- Tennessen JM, Bertagnolli NM, Evans J, Sieber MH, Cox J, Thummel CS. 2014. Coordinated metabolic transitions during Drosophila embryogenesis and the onset of aerobic glycolysis. G3 (Bethesda) 4: 839–850. [DOI] [PMC free article] [PubMed] [Google Scholar]
- TeSlaa T, Chaikovsky AC, Lipchina I, Escobar SL, Hochedlinger K, Huang J, Graeber TG, Braas D, Teitell MA. 2016. α-Ketoglutarate accelerates the initial differentiation of primed human pluripotent stem cells. Cell Metab 24: 485–493. [DOI] [PMC free article] [PubMed] [Google Scholar]
- Tibbetts AS, Appling DR. 2010. Compartmentalization of mammalian folate-mediated one-carbon metabolism. Annu Rev Nutr 30: 57–81. [DOI] [PubMed] [Google Scholar]
- Tong X, Zhao F, Thompson CB. 2009. The molecular determinants of de novo nucleotide biosynthesis in cancer cells. Curr Opin Genet Dev 19: 32–37. [DOI] [PMC free article] [PubMed] [Google Scholar]
- Towbin BD, González-Aguilera C, Sack R, Gaidatzis D, Kalck V, Meister P, Askjaer P, Gasser SM. 2012. Step-wise methylation of histone H3K9 positions heterochromatin at the nuclear periphery. Cell 150: 934–947. [DOI] [PubMed] [Google Scholar]
- Toyota M, Issa JP. 1999. CpG island methylator phenotypes in aging and cancer. Semin Cancer Biol 9: 349–357. [DOI] [PubMed] [Google Scholar]
- Tristan C, Shahani N, Sedlak TW, Sawa A. 2011. The diverse functions of GAPDH: views from different subcellular compartments. Cell Signal 23: 317–323. [DOI] [PMC free article] [PubMed] [Google Scholar]
- Tsuchiya Y, Pham U, Hu W, Ohnuma S, Gout I. 2014. Changes in acetyl CoA levels during the early embryonic development of Xenopus laevis. PLoS One 9: e97693. [DOI] [PMC free article] [PubMed] [Google Scholar]
- Tu BP, Kudlicki A, Rowicka M, McKnight SL. 2005. Logic of the yeast metabolic cycle: temporal compartmentalization of cellular processes. Science 310: 1152–1158. [DOI] [PubMed] [Google Scholar]
- Tulin A, Spradling A. 2003. Chromatin loosening by poly(ADP)-ribose polymerase (PARP) at Drosophila puff loci. Science 299: 560–562. [DOI] [PubMed] [Google Scholar]
- Turcan S, Rohle D, Goenka A, Walsh LA, Fang F, Yilmaz E, Campos C, Fabius AW, Lu C, Ward PS, et al. 2012. IDH1 mutation is sufficient to establish the glioma hypermethylator phenotype. Nature 483: 479–483. [DOI] [PMC free article] [PubMed] [Google Scholar]
- van der Knaap JA, Kumar BR, Moshkin YM, Langenberg K, Krijgsveld J, Heck AJ, Karch F, Verrijzer CP. 2005. GMP synthetase stimulates histone H2B deubiquitylation by the epigenetic silencer USP7. Mol Cell 17: 695–707. [DOI] [PubMed] [Google Scholar]
- van der Knaap JA, Kozhevnikova E, Langenberg K, Moshkin YM, Verrijzer CP. 2010. Biosynthetic enzyme GMP synthetase cooperates with ubiquitin-specific protease 7 in transcriptional regulation of ecdysteroid target genes. Mol Cell Biol 30: 736–744. [DOI] [PMC free article] [PubMed] [Google Scholar]
- Venkatesh S, Workman JL. 2015. Histone exchange, chromatin structure and the regulation of transcription. Nat Rev Mol Cell Biol 16: 178–189. [DOI] [PubMed] [Google Scholar]
- Verdin E. 2015. NAD+ in aging, metabolism, and neurodegeneration. Science 350: 1208–1213. [DOI] [PubMed] [Google Scholar]
- Walport LJ, Hopkinson RJ, Schofield CJ. 2012. Mechanisms of human histone and nucleic acid demethylases. Curr Opin Chem Biol 16: 525–534. [DOI] [PubMed] [Google Scholar]
- Wang J, Alexander P, Wu L, Hammer R, Cleaver O, McKnight SL. 2009. Dependence of mouse embryonic stem cells on threonine catabolism. Science 325: 435–439. [DOI] [PMC free article] [PubMed] [Google Scholar]
- Ward PS, Patel J, Wise DR, Abdel-Wahab O, Bennett BD, Coller HA, Cross JR, Fantin VR, Hedvat CV, Perl AE, et al. 2010. The common feature of leukemia-associated IDH1 and IDH2 mutations is a neomorphic enzyme activity converting α-ketoglutarate to 2-hydroxyglutarate. Cancer Cell 17: 225–234. [DOI] [PMC free article] [PubMed] [Google Scholar]
- Wellen KE, Hatzivassiliou G, Sachdeva UM, Bui TV, Cross JR, Thompson CB. 2009. ATP-citrate lyase links cellular metabolism to histone acetylation. Science 324: 1076–1080. [DOI] [PMC free article] [PubMed] [Google Scholar]
- Xiao M, Yang H, Xu W, Ma S, Lin H, Zhu H, Liu L, Liu Y, Yang C, Xu Y, et al. 2012. Inhibition of α-KG-dependent histone and DNA demethylases by fumarate and succinate that are accumulated in mutations of FH and SDH tumor suppressors. Genes Dev 26: 1326–1338. [DOI] [PMC free article] [PubMed] [Google Scholar]
- Xie Z, Zhang D, Chung D, Tang Z, Huang H, Dai L, Qi S, Li J, Colak G, Chen Y, et al. 2016. Metabolic regulation of gene expression by histone lysine β-hydroxybutyrylation. Mol Cell 62: 194–206. [DOI] [PMC free article] [PubMed] [Google Scholar]
- Xu W, Yang H, Liu Y, Yang Y, Wang P, Kim SH, Ito S, Yang C, Wang P, Xiao MT, et al. 2011. Oncometabolite 2-hydroxyglutarate is a competitive inhibitor of α-ketoglutarate-dependent dioxygenases. Cancer Cell 19: 17–30. [DOI] [PMC free article] [PubMed] [Google Scholar]
- Yang H, Yang T, Baur JA, Perez E, Matsui T, Carmona JJ, Lamming DW, Souza-Pinto NC, Bohr VA, Rosenzweig A, et al. 2007. Nutrient-sensitive mitochondrial NAD+ levels dictate cell survival. Cell 130: 1095–1107. [DOI] [PMC free article] [PubMed] [Google Scholar]
- Yang W, Xia Y, Ji H, Zheng Y, Liang J, Huang W, Gao X, Aldape K, Lu Z. 2011. Nuclear PKM2 regulates β-catenin transactivation upon EGFR activation. Nature 480: 118–122. [DOI] [PMC free article] [PubMed] [Google Scholar]
- Yang W, Xia Y, Hawke D, Li X, Liang J, Xing D, Aldape K, Hunter T, Alfred Yung WK, Lu Z. 2012. PKM2 phosphorylates histone H3 and promotes gene transcription and tumorigenesis. Cell 150: 685–696. [DOI] [PMC free article] [PubMed] [Google Scholar]
- Ye J, Mancuso A, Tong X, Ward PS, Fan J, Rabinowitz JD, Thompson CB. 2012. Pyruvate kinase M2 promotes de novo serine synthesis to sustain mTORC1 activity and cell proliferation. Proc Natl Acad Sci 109: 6904–6909. [DOI] [PMC free article] [PubMed] [Google Scholar]
- Yoshino J, Mills KF, Yoon MJ, Imai S. 2011. Nicotinamide mononucleotide, a key NAD+ intermediate, treats the pathophysiology of diet- and age-induced diabetes in mice. Cell Metab 14: 528–536. [DOI] [PMC free article] [PubMed] [Google Scholar]
- Zentner GE, Henikoff S. 2013. Regulation of nucleosome dynamics by histone modifications. Nat Struct Mol Biol 20: 259–266. [DOI] [PubMed] [Google Scholar]
- Zhai RG, Zhang F, Hiesinger PR, Cao Y, Haueter CM, Bellen HJ. 2008. NAD synthase NMNAT acts as a chaperone to protect against neurodegeneration. Nature 452: 887–891. [DOI] [PMC free article] [PubMed] [Google Scholar]
- Zhang Q, Piston DW, Goodman RH. 2002. Regulation of corepressor function by nuclear NADH. Science 295: 1895–1897. [DOI] [PubMed] [Google Scholar]
- Zhang T, Berrocal JG, Yao J, DuMond ME, Krishnakumar R, Ruhl DD, Ryu KW, Gamble MJ, Kraus WL. 2012. Regulation of poly(ADP-ribose) polymerase-1-dependent gene expression through promoter-directed recruitment of a nuclear NAD+ synthase. J Biol Chem 287: 12405–12416. [DOI] [PMC free article] [PubMed] [Google Scholar]
- Zheng L, Roeder RG, Luo Y. 2003. S phase activation of the histone H2B promoter by OCA-S, a coactivator complex that contains GAPDH as a key component. Cell 114: 255–266. [DOI] [PubMed] [Google Scholar]
- Zhou Z, Yao X, Li S, Xiong Y, Dong X, Zhao Y, Jiang J, Zhang Q. 2015. Deubiquitination of Ci/Gli by Usp7/HAUSP regulates hedgehog signaling. Dev Cell 34: 58–72. [DOI] [PMC free article] [PubMed] [Google Scholar]