NIHPA Author Manuscripts logoLink to NIHPA Author Manuscripts
. Author manuscript; available in PMC: 2016 Dec 1.
Published in final edited form as: Mol Psychiatry. 2015 Feb;20(1):1. doi: 10.1038/mp.2014.168

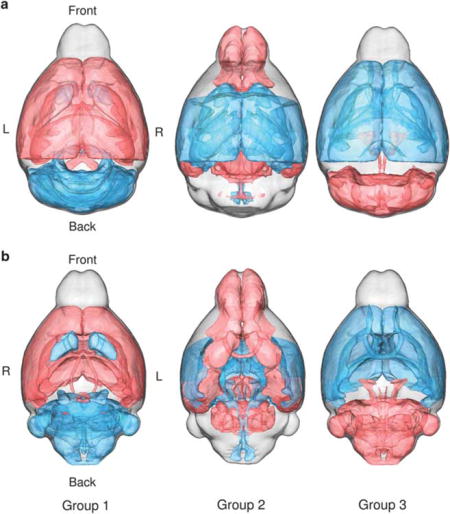
3D visualization of the regional differences

J Ellegood 1, E Anagnostou 2, BA Babineau 3, JN Crawley 3,4, L Lin 5, M Genestine 5, E DiCicco-Bloom 5, JKY Lai 6, JA Foster 6, O Peñagarikano 7, DH Geschwind 7, LK Pacey 8, DR Hampson 8, CL Laliberté 1, AA Mills 9, E Tam 10, LR Osborne 10, M Kouser 11, F Espinosa-Becerra 11, Z Xuan 11, CM Powell 11, A Raznahan 12, DM Robins 13, N Nakai 14, J Nakatani 14, T Takumi 14, MC van Eede 1, TM Kerr 15, C Muller 15, RD Blakely 15, J Veenstra-VanderWeele 15, RM Henkelman 1,16, JP Lerch 1,16
PMCID: PMC5131793  NIHMSID: NIHMS826931  PMID: 25648202

graphic file with name nihms826931u1.jpg

We examined 26 different mouse models related to autism and identified three groups that shared similar neuroanatomical phenotypes. These three groups and their regional differences are shown here. Anything highlighted in red was determined to be larger in that group (median effect size for group >0.5) and anything highlighted in blue was determined to be smaller in that group (median effect size for group < − 0.5). These differences are shown in 3D in an axial representation either looking from above (a) or below (b) the mouse brain. For more information on this topic, please refer to the article by Ellegood et al on pages 118–125.

RESOURCES