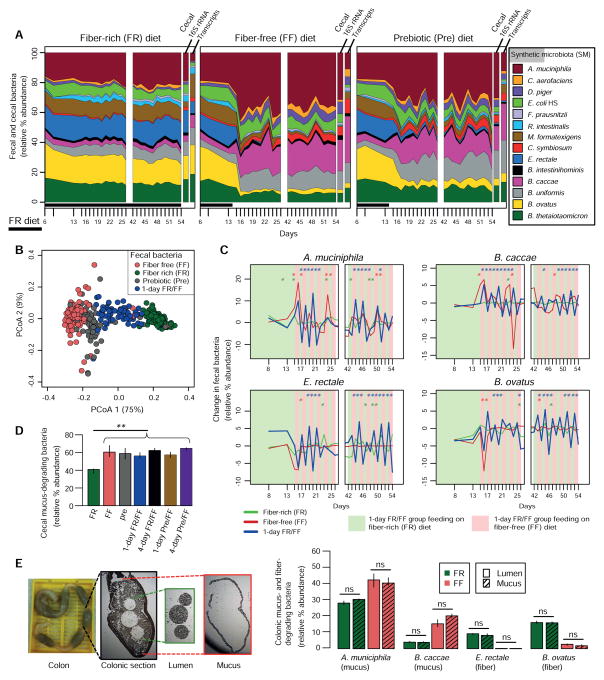
Figure 2. Complex dietary fiber deficiency leads to proliferation of mucus-degrading bacteria.
(A) Stream plots exhibiting fecal (over time, Fig. 1B) and cecal (end point) microbial community dynamics and average abundance of total species-specific transcripts from cecal RNA-Seq transcriptome mapping at the endpoint; for transcript abundance n = 3 mice/group.
(B) Principal coordinate analysis (PCoA) based on bacterial community similarity.
(C) Changes in relative bacterial abundance over time in mice oscillated for 1-day increments between FR and FF feeding. Changes in FR and FF control groups are shown for comparison. Asterisks (colored according to the dietary group) indicate a statistically significant difference in the change of relative abundance from the previous day within each group. Student’s t-test.
(D) Additive relative abundances of four mucus-degrading bacteria (Fig. 1A).
(E) Relative bacterial abundances in laser capture microdissected colonic lumen and mucus samples (images displayed on left). n = 3 mice/group.
Microbial community abundance data are based on Illumina sequencing of 16S rRNA genes (V4 region) and median values at each time point are shown. Unless specified, significance was determined using Kruskal–Wallis test and n = 4 for FR and FF groups, n = 3 for all other groups. All data in Fig. 2A–E is from Experiment 1.

