

Abstract
Genetic variants that disrupt protein-coding DNA are ubiquitous in the human population, with about 100 such loss-of-function variants per individual. While most loss-of-function variants are rare, a subset have risen to high frequency and occur in a homozygous state in healthy individuals. It is unknown why these common variants are well tolerated, even though some affect essential genes implicated in Mendelian disease. Here, we combine genomic, proteomic, and biochemical data to demonstrate that many common nonsense variants do not ablate protein production from their host genes. We provide computational and experimental evidence for diverse mechanisms of gene rescue, including alternative splicing, stop codon readthrough, alternative translation initiation, and C-terminal truncation. Our results suggest a molecular explanation for the mild fitness costs of many common nonsense variants and indicate that translational plasticity plays a prominent role in shaping human genetic diversity.
The discovery of pervasive genetic variation that is predicted to disrupt protein-coding DNA sequences is a surprising finding of recent human genetics studies. This loss-of-function genetic variation can arise from many sources, including single-nucleotide variants (SNVs) that introduce stop codons, insertions or deletions that disrupt the reading frame, disruption of splice sites, or large structural variation. While loss-of-function variants are generally found at low allelic frequencies relative to synonymous variants (Fig. 1A), many have risen to sufficiently high frequency to be present in a homozygous state. A careful study of these variants estimated that typical individuals carry approximately 100 loss-of-function variants, of which about 20 are present in a homozygous state (MacArthur et al. 2012).
Figure 1.

Putatively disabled genes exhibit normal levels of the encoded proteins. (A) Histogram of alternate allele frequencies for synonymous and nonsense variants identified by the 1000 Genomes Project (1000 Genomes Project Consortium 2012). (B) Genome-wide measurements of mRNA abundance (Lappalainen et al. 2013), mRNA:ribosome association (Battle et al. 2015), and protein abundance (Battle et al. 2015) in lymphoblastoid cell lines (LCLs) that we analyzed here. These data were available for 462, 72, and 62 individuals, respectively; however, we restricted our analyses to the 421, 62, and 50 individuals that were genotyped by sequencing. The represented populations are British in England and Scotland, Finnish in Finland, Toscani in Italy, Utah residents with Northern and Western European ancestry, and Yoruba in Ibadan, Nigeria. (SILAC) Stable isotope labeling by amino acids in cell culture (Ong et al. 2002). (C) Median RNA levels of CDSs containing nonsense variants, averaged across samples that are homozygous for the reference (0/0) or alternate (1/1) alleles. Error bars, first and fourth quartiles of expression across all 0/0 or 1/1 samples. Units are fragments per kilobase per million mapped reads (FPKM) of the CDS containing each variant. (N) Number of analyzed variants. Analysis based on the 194 nonsense variants stated in B but restricted to variants within Ensembl coding genes that were present as both 0/0 and 1/1 in samples with RNA-seq data. (D) As in C but illustrates mRNA:ribosome association as measured by ribosome profiling. Units are FPKM of the CDS containing each variant. Analysis based on the 118 nonsense variants stated in B but restricted to variants within Ensembl coding genes that were present as both 0/0 and 1/1 in samples with ribosome profiling data. (E) As in C but illustrates relative levels of proteins encoded by CDSs containing nonsense variants as measured by SILAC mass spectrometry. Units are protein levels relative to the sample standard (e.g., 20 indicates no change in protein levels relative to the standard), whose genotype for each variant is indicated by the point color. Protein levels were taken directly from Battle et al. (2015), who estimated protein levels as the median sample:standard ratio across all peptides arising from a single parent gene in each sample. Analysis based on the 106 nonsense variants stated in B but restricted to variants within Ensembl coding genes that were present as both 0/0 and 1/1 in samples with SILAC data. Fewer variants can be analyzed here than in C,D due to the low coverage of mass spectrometry data relative to RNA-seq or ribosome profiling. (F) Possible mechanisms to enable protein production from genes containing nonsense variants. Nonsense variants may be isoform specific, may result in N- or C-terminal truncation of the encoded protein, or may be subject to readthrough during translation.
While deleterious genetic variants can rise to high frequencies in specific populations due to demographic effects such as population bottlenecks (Lim et al. 2014), the high allele frequencies of some loss-of-function variants within diverse and large human populations suggest that these variants are subject to relatively weak purifying selection. In some cases, gene inactivation may confer a fitness benefit for individuals or the species, as has been posited for CASP12 (Xue et al. 2006), ACTN3 (MacArthur et al. 2007), and ERAP2 (Andrés et al. 2010), and positive or balancing selection may drive the inactive allele to high frequency. However, the rarity of most loss-of-function variants relative to synonymous variants suggests that beneficial loss-of-function variants are exceptions rather than the norm.
Consistent with the apparently mild purifying selection acting on common loss-of-function variants, a recent study of five European populations reported that no homozygous loss-of-function variants within these populations were associated with detectable phenotypic deviance (Kaiser et al. 2015). This report is consistent with expectations based on a gene disruption screen in zebrafish, which found that only 6% of randomly induced nonsense or splice site mutations yielded an embryonic phenotype (Kettleborough et al. 2013). Knockout studies in mouse models yielded much higher estimates of mouse embryonic lethality (Ayadi et al. 2012; de Angelis et al. 2015). However, it is difficult to directly compare these studies, particularly because gene inactivation in the murine models was frequently achieved by unambiguously disrupting the coding DNA via insertion of a polyadenylation site within the gene body (vs. the more modest genetic changes induced by N-ethyl-N-nitrosourea [ENU] mutagenesis in the zebrafish models).
The apparently mild fitness consequences of common loss-of-function variants can be explained in two different ways, depending upon whether these variants affect nonessential or essential genes. First, genetic redundancy may render particular genes dispensable, such that they can be inactivated without significant fitness costs. Loss-of-function variants are enriched in genes with more paralogs than other genes, most notably the olfactory receptors, as well as genes that are relatively poorly conserved (Gilad et al. 2003; MacArthur et al. 2012). Second, loss-of-function variants may disrupt coding DNA yet not completely disable their (essential) host genes’ functions. Consistent with this hypothesis, previous studies noted that many loss-of-function variants do not affect all isoforms of their parent genes and, furthermore, that loss-of-function variants are enriched near the 3′ ends of coding sequences (CDSs) (MacArthur et al. 2012; Kaiser et al. 2015; Liu and Lin 2015). These observations suggest that some loss-of-function variants may not completely destroy the coding potential of their host genes, potentially explaining why those variants are well tolerated. However, this hypothesis—that many loss-of-function variants do not ablate their host genes’ functions—has not been experimentally tested.
Here, we systematically determined the consequences of common nonsense variants for mRNA translation and protein production using a combination of genome-wide data and directed biochemical experiments.
Results
Many common nonsense variants do not disrupt protein production
We set out to test the hypothesis that many common loss-of-function variants do not ablate protein production from their host genes, thereby explaining the apparently mild phenotypic consequences of these variants even when found in a homozygous state. To test this hypothesis, we took advantage of several recently published data sets representing successive stages of gene expression. These data sets consist of genome-wide measurements of mRNA levels by RNA-seq (Lappalainen et al. 2013), mRNA:ribosome association by ribosome profiling (Battle et al. 2015), and protein abundance by quantitative mass spectrometry (Battle et al. 2015) in lymphoblastoid cell lines (LCLs) that were established by the HapMap and 1000 Genomes Projects (International HapMap 3 Consortium 2010; 1000 Genomes Project Consortium 2012). For each data set, we used published sample genotypes to identify SNVs that induced synonymous or nonsense codon changes with respect to the reference genome in one or more RefSeq coding transcripts.
We specifically focused our analysis on common nonsense variants that were present in a homozygous state and thereby predicted to induce complete gene knockouts. We focused on nonsense variants rather than the broader spectrum of loss-of-function variation because nonsense variants can be identified in a straightforward manner from both DNA and RNA sequencing, their impact upon the mRNA is unambiguous, they are relevant to many Mendelian diseases, and their allelic expression can be reliably quantified from RNA-seq data. Of all nonsense variants that we identified, a total of 194 (RNA-seq), 118 (ribosome profiling), and 106 (mass spectrometry) nonsense variants were present in a homozygous state in the genome of at least one assayed sample in each respective data set (Fig. 1B).
By studying individuals with either two (genotype 0/0; 0 = reference allele) or zero (genotype 1/1; 1 = alternate allele) intact gene copies, we were able to unambiguously determine how each nonsense variant affected protein production. Restricting to those variants, we found that levels of the parent mRNAs containing each nonsense variant were similar in 0/0 and 1/1 individuals (Fig. 1C). The similarity of mRNA levels in 0/0 and 1/1 individuals suggested that many of the mRNAs containing the nonsense variants studied here escaped from nonsense-mediated decay (NMD). To determine the effect of NMD on these variants, we quantified allele-specific expression (ASE) of the alternate alleles illustrated in Figure 1C in heterozygous (genotype 0/1) individuals. We restricted our analysis to nonsense variants covered by at least 20 RNA-seq reads in at least one heterozygous sample (so that we could accurately measure ASE) and computed the median ASE across all such heterozygous samples for each variant. The 36 nonsense variants meeting this coverage requirement exhibited a median ASE of 45%, only modestly lower than the 50% expected if both alleles were equally transcribed and not affected by NMD. Seven of the 36 variants exhibited a median ASE < 10%, consistent with relatively efficient degradation by NMD (Supplemental Fig. S1A). To test whether the coverage threshold of 20 reads biased our conclusions, we repeated the analysis using thresholds of five, 10, 20, and 50 reads. Those thresholds yielded median ASE estimates of 40%, 41%, 45%, and 45% for nonsense variants (N = 59, 52, 36, and 25 variants analyzed), indicating that our results are robust with respect to the specific read threshold used.
We next tested whether nonsense variants that efficiently triggered NMD were predicted to do so. Stop codons that lie ≥50 nt upstream of exon–exon junctions are canonically predicted to trigger NMD (Popp and Maquat 2013; Lykke-Andersen and Jensen 2015). Eighty-six percent of the seven variants with ASE<10% were predicted NMD substrates by the “50-nt” rule, while 62% of the 29 variants with ASE ≥10% were predicted NMD substrates. We conclude that the majority of mRNAs containing the nonsense variants studied here escape NMD, although a subset is efficiently degraded, consistent with previous reports (MacArthur et al. 2012; Kukurba et al. 2014; Rivas et al. 2015).
The observed similarity in levels of 0/0 and 1/1 mRNAs extended to mRNA translation as well. Association between the parent mRNAs and ribosomes, as well as levels of the encoded proteins, was similar between 0/0 and 1/1 individuals (Fig. 1D,E). (The much lower coverage of both ribosome profiling and mass spectrometry data relative to RNA-seq data rendered the analysis of ASE in 0/1 individuals infeasible for these assays of mRNA translation.) We observed no cases where homozygous nonsense variants completely abolished mRNA expression, mRNA:ribosome association, or protein expression, with the caveat that these measurements were necessarily restricted to variants within genes that were detectably expressed in LCLs by RNA-seq, ribosome profiling, or mass spectrometry.
Genotyping errors could potentially explain why we observed normal protein levels from genes containing homozygous nonsense variants. We therefore used RNA-seq to identify and remove incorrectly called genotypes. For each nonsense variant, we restricted our analyses to samples for which the variant was covered by at least 10 reads, and removed samples that were annotated as 0/0 or 1/1 but exhibited expression of the alternate or reference alleles, respectively. While we did identify and remove a small number of such variant-sample pairs whose genotypes were inconsistent with the observed allelic expression, removing those inconsistent data points did not affect our conclusion that neither mRNA expression, mRNA:ribosome association, nor protein expression was abolished by the analyzed homozygous nonsense variants (Supplemental Fig. S1B–D). Therefore, genotyping errors do not explain why these nonsense variants do not abolish protein production.
Permissive RNA processing may enable protein production from genes containing nonsense variants
The extensive regulation that occurs between the initiation of gene transcription and the completion of mRNA translation offers ample opportunities for protein production from genes containing nonsense variants (although gene function may or may not be preserved). Protein can be produced from genes containing nonsense variants by one of two means (Fig. 1F). First, a nonsense variant may be isoform specific, such that at least one coding isoform of the parent gene does not contain the variant. In this case, the nonsense variant may prevent translation of one or more, but not all, isoforms. Second, the stop codon introduced by a nonsense variant may not be sufficient to abolish productive translation. This can occur if the ribosome can initiate translation downstream from the stop codon, if the stop codon is subject to readthrough, or if the nonsense variant is near the normal stop codon.
Sequence analyses reported in previous studies suggest that both alternative splicing and protein truncation may contribute to the robust protein production from genes containing nonsense variants that we observed (Fig. 1C–E). Approximately one-third of previously studied nonsense variants are isoform specific (MacArthur et al. 2012; Kaiser et al. 2015); minor coding isoforms are enriched for nonsense variants relative to major isoforms (Liu and Lin 2015); and nonsense variants preferentially occur at the 3′ ends of their host CDSs (MacArthur et al. 2012; Sulem et al. 2015). We therefore set out to systematically identify molecular mechanisms that enabled protein production from genes containing nonsense variants. Our general strategy was to combine RNA-seq, ribosome profiling, and SILAC data to identify the mechanisms that enabled protein production from genes containing the common nonsense variants studied in Figure 1, and then computationally predict the likely relevance of each mechanism to lower-frequency nonsense variants using sequence analysis of the approximately 10,000 nonsense variants identified by the 1000 Genomes Project.
Nonsense variants are frequently isoform specific and removed by alternative splicing
We first tested whether nonsense variants are more frequently isoform specific than their synonymous counterparts. For each nonsense variant within a multiexon gene, we determined whether the gene contained at least one RefSeq coding transcript for which the alternate allele did not introduce an in-frame stop codon or whether the nonsense variant was contained within alternatively spliced sequence of the mRNA. We similarly measured isoform specificity for synonymous variants, restricted to the subset of synonymous variants lying within genes that contain nonsense variants in order to control for the fact that nonsense variants preferentially occur in specific gene classes (MacArthur et al. 2012; Sulem et al. 2015). We eliminated variants lying within genes encoding olfactory receptors from this and subsequent analyses, as this large gene family has been subject to frequent and likely largely neutral gene inactivation during human evolution (Gilad et al. 2003).
Approximately 28% of synonymous variants in multiexon genes are isoform specific. In order to test for a relationship between isoform specificity and the prevalence of variants, we classified each variant as rare, low frequency, or common, corresponding to allele frequencies of ≤0.5%, 0.5%–5%, and ≥5% in the 1000 Genomes data. We observed no relationship between isoform specificity of synonymous variants and their frequency in the human population, consistent with our expectation that most synonymous codon substitutions are functionally neutral. In contrast, ∼31% of rare nonsense variants are isoform specific, rising to 39% and 43% of low-frequency and common nonsense variants, suggesting that isoform-specific nonsense variants are subject to relaxed purifying selection (Fig. 2A). When we considered all synonymous variants rather than restricting to those within genes containing nonsense variants, we observed slightly greater disparities between the isoform specificity of synonymous versus nonsense variants (Supplemental Fig. S2A). Our estimates of isoform specificity for nonsense variants are consistent with a previous estimate of 32.3% based on a smaller cohort of 185 individuals (MacArthur et al. 2012).
Figure 2.

Alternative splicing, promoter usage, and polyadenylation remove nonsense genetic variants from mature mRNA. (A) Percentages of variants that are isoform specific. Isoform-specific variants are defined as those that do not induce the indicated coding change within at least one RefSeq CDS of the parent gene or that lie within known alternatively spliced mRNA sequence. Plot restricted to variants that lie within genes containing nonsense variants. (N) Number of analyzed variants. Error bars, 95% confidence intervals as estimated by the binomial proportion test. (B) Median inclusion of variants lying within known alternatively spliced mRNA sequence across 16 human tissues. An inclusion level of 75% indicates that 75% of mRNAs transcribed from the parent gene contain the variant, while 25% do not. Inclusion was computed using the Body Map 2.0 data. (Notches) Approximate 95% confidence interval for the median. Plot restricted to variants that lie within genes containing nonsense variants. (C) Histogram of observed versus expected coverage of variants by ribosome footprints. Observed coverage was computed as the number of footprints overlapping each variant; expected coverage was computed as the total number of footprints overlapping each variant's host CDS, normalized such that the median of the ratio observed:expected over all variants was equal to one. All footprint coverage calculations were restricted to 0/0 samples to avoid potentially confounding effects of nonsense variants, and the plotted values indicate medians over those samples. (Black line) Best-fit normal distribution estimated from synonymous variants. Plot restricted to variants that lie within genes containing nonsense variants and that are present in samples for which ribosome profiling data were available. RNA-seq (D) and ribosome profiling (E) read coverage of a nonsense variant lying within a cassette exon of LGALS8, stratified by sample genotype. Coverage was normalized per sample to control for sequencing depth and then averaged over all samples with the indicated genotypes. Units are reads per million. (Red triangle) Location of nonsense variant. (F) LGALS8 protein levels relative to a sample standard with genotype 0/1. RNA-seq (G) and ribosome profiling (H) read coverage of a nonsense variant lying within an alternate 5′ exon of MOB3C. (I) MOB3C protein levels relative to a sample standard with genotype 0/1.
The functional consequences of an isoform-specific variant depend upon the frequency with which those isoforms are produced as mature mRNAs. To test whether nonsense variants preferentially fall within isoforms that are used infrequently, we quantified the inclusion of alternatively spliced sequence containing synonymous or nonsense variants across 16 human tissues. Isoform-specific synonymous variants exhibited a median inclusion of ∼90% irrespective of allele frequency, while low-frequency and common isoform-specific nonsense variants exhibited median inclusions of 64% and 53% (Fig. 2B; Supplemental Fig. S2B). We conclude that even among the isoform-specific nonsense variants, those variants that are most frequently spliced out of mature mRNA are subject to further relaxed selection.
We next measured the empirical isoform specificity of the specific set of homozygous nonsense variants that we analyzed in LCLs (Fig. 1C–E). For each SNV within an expressed gene, we quantified the expected versus observed number of ribosome footprints overlapping the SNV as a simple empirical measure of isoform specificity (e.g., an isoform-specific SNV is expected to exhibit an observed:expected ratio of less than one). We estimated the expected footprint coverage from the total number of footprints aligned to the parent transcript of each SNV and averaged this footprint coverage over all samples with a 0/0 genotype for that SNV. (We restricted the coverage analysis to 0/0 samples in order to measure position-specific mRNA:ribosome association in the absence of premature stop codons.) The resulting distributions were similar for most synonymous and nonsense variants, consistent with our genome-wide prediction that the majority of variants are not isoform specific. Nonetheless, a subset of nonsense variants was strongly depleted for ribosome footprint coverage beyond the background distribution estimated from synonymous variants, indicating that they are frequently excluded from mature mRNAs engaged with ribosomes in LCLs (Fig. 2C). Low-frequency and common nonsense variants exhibited greater depletion for footprint coverage relative to rare nonsense variants, again consistent with relaxed purifying selection (Fig. 2C).
Each of the mechanisms proposed in Figure 1F contributed to the isoform specificity of nonsense variants. Specific examples include nonsense variants within a frame-preserving cassette exon of LGALS8, an alternate promoter of MOB3C, and an alternatively spliced sequence of TMEM218 that is either coding or noncoding, depending upon which start codon is used (Fig. 2D–I; Supplemental Fig. S2D–G). SILAC data were available for LGALS8 and MOB3C, allowing us to confirm that protein levels were sustained in LCLs with homozygous copies of the corresponding nonsense variants. In both cases, protein levels were higher for 0/1 and 1/1 samples relative to 0/0 samples, perhaps due to compensatory translational up-regulation in individuals carrying the alternate alleles or differential stability of the relevant protein isoforms (Fig. 2F,I).
As alternative splicing is frequently tissue specific (Wang et al. 2008), the degree to which isoform specificity mitigates the consequences of a nonsense variant may differ substantially between different cell types. For example, the LGALS8 cassette exon is highly tissue specific, with inclusion ranging from 5% in colon to 87% in testes of individuals with genotype 0/0 (inclusion is ∼55% in LCLs with genotype 0/0) (Supplemental Fig. S2E). Therefore, both the levels of LGALS8 protein in 1/1 individuals and the consequences of specifically ablating the inclusion isoform may differ between cell types.
Nonsense variants may be subject to stop codon readthrough
Genes containing nonsense variants within constitutively included sequence cannot produce mRNAs lacking the variants but could potentially produce protein nonetheless through permissive mRNA translation (Fig. 1F). We therefore searched for read coverage patterns indicative of potential stop codon readthrough, wherein the translating ribosome does not efficiently terminate at the stop codon but rather decodes the stop codon as a sense codon and continues elongating. A nonsense variant that is subject to readthrough might suppress levels of the encoded protein due to imperfectly efficient readthrough but would induce only a single amino acid change at the nonsense variant.
To identify potential examples of readthrough, we compared ribosome footprint coverage of genes containing nonsense variants in samples with genotypes 0/0 or 1/1 for the variants. Of the 118 nonsense variants present as 1/1 in at least one sample within the Yoruba cohort (Fig. 1B), 15 variants had both 0/0 and 1/1 samples available and lay within genes with sufficient footprint coverage in LCLs to identify potential readthrough (median coverage of relevant transcripts of about one footprint per million mapped reads). Of those 15, two nonsense variants within PVRIG and SLFN13 exhibited similar patterns of mRNA:ribosome association in 0/0, 0/1, and 1/1 samples, including in the immediately vicinity of the premature termination codon (Fig. 3; Supplemental Fig. S3). This pattern of ribosome footprints is consistent with stop codon readthrough, in the sense that there is similar quantitative read coverage before and after the nonsense variant. However, it is important to note that this pattern of read coverage could potentially arise from ribosome scanning and translation initiation downstream from the nonsense variant as well.
Figure 3.
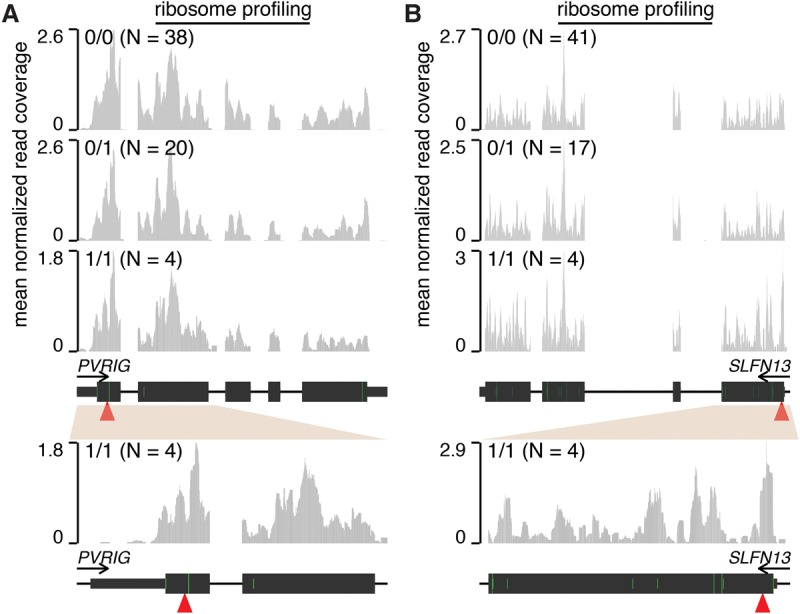
Stop codon readthrough likely enables translation of nonsense variant–containing mRNAs. Ribosome profiling read coverage of nonsense variants lying within PVRIG (A) and SLFN13 (B). Units and data normalization are as in Figure 2. Bottom plots are zoomed-in versions of the top plots. (Green bars) ATG start codons. (Full/half-height green bars) ATG codons that are/are not within a Kozak consensus context, defined as RnnATGG (R = A/G).
We tested whether our analysis of PVRIG and SLFN13 was confounded by mismapping of ribosome footprints from homologous transcribed genomic loci. The first two coding exons of PVRIG, which contain the nonsense variant, have 96.8% homology to the transcribed pseudogene PVRIG2P. However, as the density of mismatches between PVRIG and PVRIG2P is high enough to uniquely map ribosome profiling reads and as PVRIG2P exhibits no ribosome footprint coverage, we conclude that the ribosome association illustrated in Figure 3A likely arises from the PVRIG mRNA and not a homologous locus. Similarly, while the first coding exon of SLFN13, which contains the nonsense variant, has 82.9% homology to the first coding exon of the expressed gene SLFN11, the density of mismatches is sufficient to uniquely map ribosome footprints. Finally, both RNA-seq and ribosome profiling reads mapping to the PVRIG and SLFN13 nonsense variants supported 100% expression of the alternate allele in the 1/1 samples, indicating that genotyping errors are unlikely.
We conclude that stop codon readthrough may enable translation of some mRNAs containing nonsense variants. However, we were unable to estimate the fraction of nonsense variants that might be so rescued given the infeasibility of predicting readthrough from mRNA sequence alone.
Nonsense variants frequently induce N- or C-terminal protein truncation
In addition to stop codon readthrough, stable expression of a truncated protein might enable protein production from a nonsense variant–containing mRNA. Protein truncation can occur at the N or C terminus through different mechanisms. An N-terminally truncated protein results from translation initiation at a start site downstream from the nonsense variant. In contrast, C-terminal truncation results if the nonsense variant is sufficiently close to the normal stop codon and the host transcript is not efficiently degraded via NMD.
We took a sequence-based approach to identify nonsense variants that might induce N- or C-terminal truncation. Simply plotting the relative positions of nonsense variants within their host CDSs revealed that these variants are enriched at the 3′ ends of their host CDSs and are otherwise uniformly distributed, while synonymous variants exhibited no peak at the 3′ end (Fig. 4A; Supplemental Fig. S4A). This pattern is consistent with previous studies of different cohorts (MacArthur et al. 2012; Sulem et al. 2015) and suggests that C-terminal truncation occurs frequently. We did not observe any enrichment for nonsense variants at the 5′ ends of their host CDSs, suggesting that start codon misannotation—which can cause a variant within a 5′ untranslated region (UTR) to be incorrectly labeled as a nonsense variant (MacArthur and Tyler-Smith 2010; Sulem et al. 2015)—is not a frequent confounding factor in our analyses.
Figure 4.
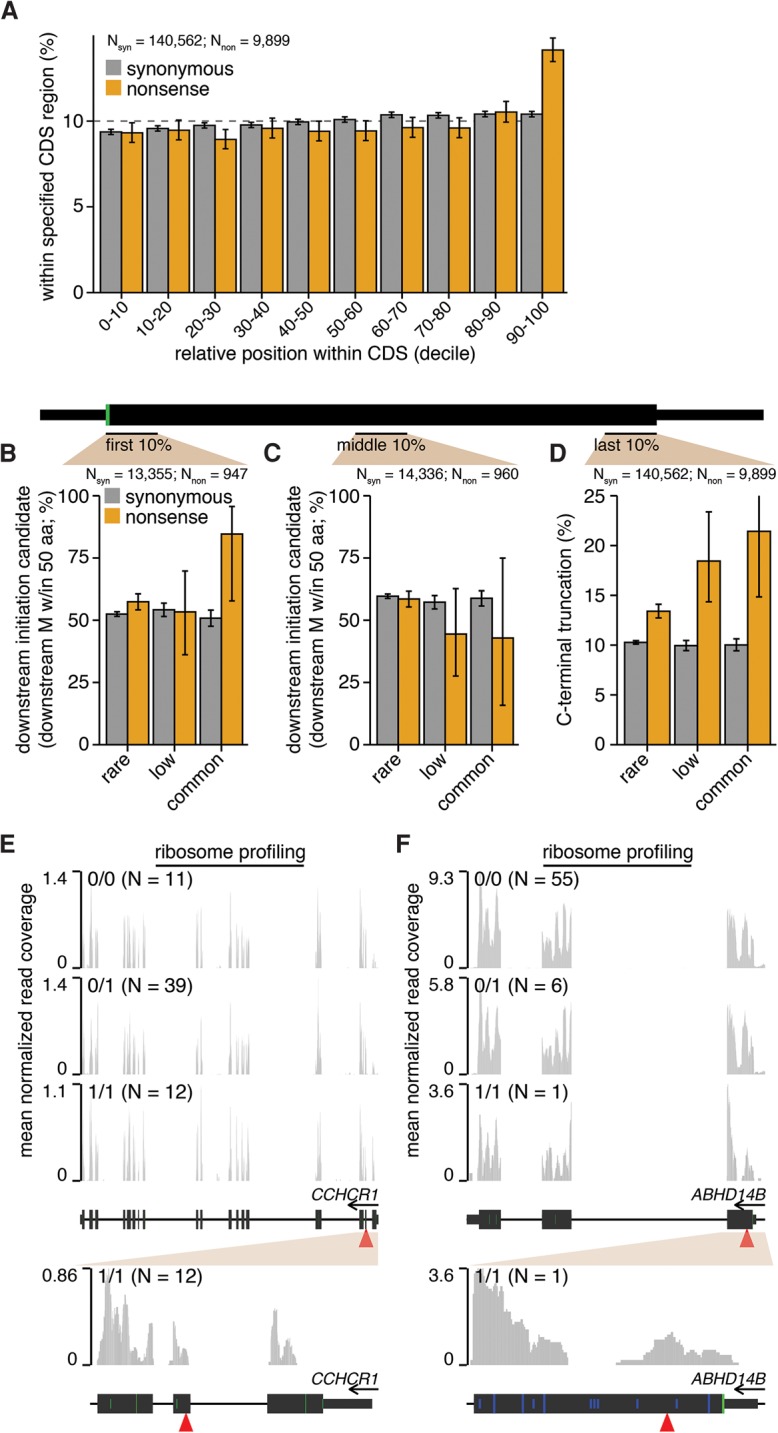
N- and C-terminal protein truncation enable translation of nonsense variant–containing mRNAs. (A) Positional distribution of variants within their host transcripts. Plot indicates the percentages of variants lying within the indicated deciles of their host CDSs’ lengths. Error bars, 95% confidence intervals as estimated by the binomial proportion test. Percentages of variants lying within the first 10% (B) or middle 10% (C) of their host CDS's length that have a downstream methionine (M) within 50 amino acids. Plot restricted to variants that lie within genes containing nonsense variants. Error bars, 95% confidence intervals as estimated by the binomial proportion test. (D) Percentages of variants lying within the last 10% of their host CDS's length. Plot restricted to variants that lie within genes containing nonsense variants. Ribosome profiling read coverage of nonsense variants lying within CCHCR1 (E) and ABHD14B (F). Units, data normalization, and notation are as in Figure 3. (Blue bars) CTG or GTG noncanonical start codons (no downstream ATG codons are present within the plot region). (Full/half-height blue bars) CTG or GTG codons that are/are not within a Kozak consensus context, defined as RnnSTGG (R = A/G, S = C/G).
To test whether N-terminal truncation via translation initiation at downstream start sites might also occur, we restricted to SNVs lying within the first 10% of their host CDSs and tested whether those variants were followed by an in-frame methionine within 50 amino acids downstream from the SNV. Approximately 52% of such synonymous variants had a downstream methionine within this distance. In contrast, both rare and common nonsense variants exhibited statistically significant enrichment for downstream methionines, with 57% and 85% of such variants categorized as potential candidates for downstream initiation (Fig. 4B). We next performed two controls to confirm that methionines were specifically enriched downstream from nonsense variants that were downstream translation initiation candidates. First, we measured the occurrence of out-of-frame methionines downstream from SNVs and found no enrichment for out-of-frame methionines downstream from nonsense variants relative to synonymous variants (Supplemental Fig. S4B–D). Second, we searched for in-frame methionines downstream from SNVs but restricted to variants within the middle of the CDS, where downstream translation initiation would produce a severely truncated protein. We observed no statistically significant differences in occurrence of downstream methionines for synonymous versus nonsense variants (Fig. 4C). We conclude that in-frame methionines are specifically enriched downstream from nonsense variants that lie near the 5′ ends of CDSs.
Finally, we tested whether nonsense variants that induced C-terminal truncation might be subject to relaxed selection. Approximately 10% of synonymous variants fell within the last 10% of their host CDSs, independent of allele frequency. In contrast, 13% of rare nonsense variants fell within this region, increasing to 21% for common nonsense variants (Fig. 4D). Therefore, we conclude that the positional distribution of nonsense variants within CDSs is consistent with frequent induction of relatively small N- or C-terminal truncations of the encoded protein.
Ribosome profiling data similarly indicated that downstream translation initiation contributes to translation of mRNAs containing nonsense variants. We observed likely translation initiation downstream from nonsense variants at both canonical (ATG; CCHCR1) and noncanonical (CTG or GTG; ABHD14B) start codons (Fig. 4E,F; Supplemental Fig. S4E,F). Translation initiation at noncanonical start codons has been previously observed in mammalian genomes, although it is uncommon relative to initiation at canonical start codons (Ingolia et al. 2011). We confirmed that there are no regions in the reference human genome assembly with high homology to the exon containing the ABHD14B nonsense variant and also observed 100% expression of the alternate allele in the 1/1 sample, indicating that genotyping errors are unlikely. Together, our data provide both sequence-based and direct evidence of translation initiation at canonical and noncanonical start codons downstream from common nonsense variants.
Truncated proteins encoded by nonsense variant–containing mRNAs are produced in a heterologous system
Of the nonsense variants highlighted above (within LGALS8, MOB3C, TMEM218, PVRIG, SLFN13, CCHCR1, and ABHD14B), we could only confirm LGALS8 and MOB3C protein levels due to mass spectrometry's incomplete coverage of the proteome. SILAC data were not available for proteins affected by the other highlighted nonsense variants. We therefore used a reporter system to experimentally confirm the conclusions of our genomic analyses, as well as test whether translation of nonsense variant–containing mRNAs could be recapitulated in a heterologous system (vs. the endogenous context in which the genomic assays were performed). We focused on nonsense variants that we predicted to be subject to stop codon readthrough or to induce N- or C-terminal protein truncation, as those involve incompletely understood biochemical mechanisms or the production of novel proteins not present in cells lacking the nonsense variant.
We designed a series of reporter constructs containing the reference (sense codon) or variant (nonsense codon) alleles of 10 nonsense variants (Table 1). We chose to test variants within ABHD14B, CCHCR1, PVRIG, and SLFN13 (Figs. 3, 4), as well as a blindly chosen set of nonsense variants that were present as 1/1 in the 1000 Genomes cohort but for which we did not have ribosome profiling data available for 1/1 samples. Each construct carried an N-terminal FLAG tag and a C-terminal HA tag (Fig. 5A), permitting us to specifically identify the encoded protein and distinguish stop codon readthrough from N- or C-terminal truncation as follows. Upon translation, the reference allele is expected to produce a full-length protein product with both the N- and C-terminal tags. If the variant allele is subject to stop codon readthrough, then we expect to similarly observe a full-length product carrying both tags. In the case of N- or C-terminal truncation, however, only a partial protein product carrying a HA or FLAG tag, respectively, is expected (Fig. 5B).
Table 1.
Characteristics of nonsense variants selected for reporter assays
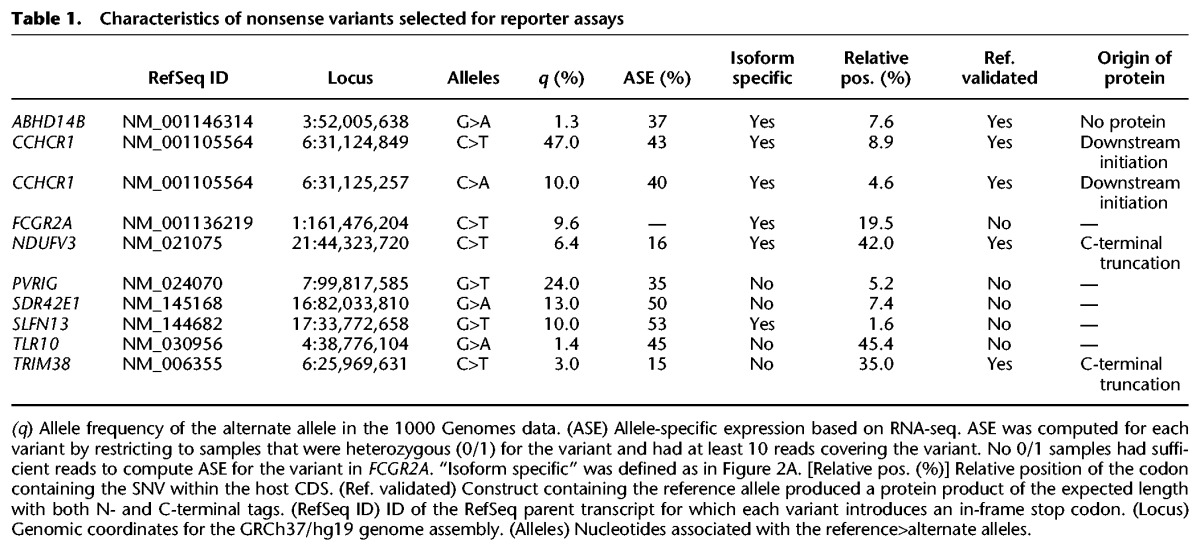
Figure 5.

A reporter system recapitulates translation of N- and C-terminally truncated proteins from mRNAs containing nonsense variants. (A) Design of reporter constructs carrying the reference (sense) or alternate (nonsense) alleles of selected genes. (B) Cartoon depicting how permissive translation may enable productive translation of mRNAs containing nonsense variants, as well as the expected protein products from our reporter constructs for each mechanism of permissive translation. (C) Western blot of total protein from HEK293 cells transfected with constructs containing the reference alleles of all candidate genes. The FLAG and HA tags are illustrated in green and red. (White arrows) Constructs that produced the expected protein with both FLAG and HA tags. (D) As in C, but for constructs containing either the reference (Ref) or alternate (Alt) alleles of the genes marked with white arrows in C. For CCHCR1, the “Alt1” and “Alt2” variants correspond to SNVs at genomic positions 31,124,849 and 31,125,257 on Chromosome 6.
We introduced each construct containing the reference or variant allele of each candidate gene individually into HEK293 cells via transient transfection and assayed their protein products 48 h post-transfection by detecting the FLAG and HA tags. Constructs containing the reference alleles of CCHCR1, ABHD14B, NDUFV3, and TRIM38 all produced a protein product of the expected size carrying both N- and C-terminal tags (Fig. 5C; Supplemental Fig. S5A). The other reference constructs produced either no protein or protein products that were not of the expected size and so were excluded from further analysis. We additionally tested constructs for PVRIG and SLFN13 that contained their endogenous 5′ and 3′ UTRs, but found that those constructs also did not produce the expected protein products (data not shown). The absence of detectable protein from some constructs may be due a requirement for cell-type–specific translational machinery that is absent from HEK293 cells, problems caused by our introduction of N- and/or C-terminal tags, or possibly incorrect coding sequence annotations. The encoded proteins might also be unstable in HEK293 cells.
Constructs containing either of the two nonsense variants of CCHR1 produced an N-terminally truncated protein fragment indicative of initiation downstream from the premature termination codon (Fig. 5D; Supplemental Fig. S5B). This fragment was produced from the construct containing the reference allele as well, suggesting that CCHCR1 is subject to alternative translation initiation even in the absence of a nonsense genetic variant. The construct containing the nonsense variant of ABHD14B did not make a detectable protein in HEK293 cells, despite our expectation given uninterrupted ribosome footprints throughout the open reading frame in LCLs, suggesting that an N-terminally truncated protein is likely translated but unstable. Constructs containing the NDUFV3 and TRIM38 nonsense variants produced C-terminally truncated protein fragments that were abundant despite their small size relative to the full-length proteins. These variants in NDUFV3 and TRIM38 were expressed in RNA-seq from 0/1 samples at allelic levels of 16% and 15% (Table 1), indicative of incomplete degradation by NMD that could potentially enable these short proteins to be similarly produced from their endogenous loci. In total, we detected stable expression of N- and C-terminally truncated protein products from constructs encoding four of five unambiguously tested nonsense variants.
Stop codon readthrough rescues protein production from an endogenous gene containing a nonsense variant
As technical limitations of our heterologous reporter system prevented us from experimentally confirming that readthrough occurs for PVRIG and SLFN13 mRNAs, as predicted from ribosome profiling data, we turned to measurements of endogenous protein levels. We identified LCLs that were homozygous for either the reference (0/0) or nonsense (1/1) variants in PVRIG and SLFN13 and obtained five such cell lines from the Coriell Biorepository (Fig. 6A). We used an enrichment strategy to detect endogenous protein, wherein we immunoprecipitated using antibodies directed against PVRIG or SLFN13 and then probed the immunoprecipitate using the same antibodies (Fig. 6B). We detected PVRIG protein at the expected molecular weight in LCLs that were homozygous for either the reference (0/0) or nonsense (1/1) variants, supporting our computational prediction that stop codon readthrough rescues protein production from the nonsense variant–containing allele of PVRIG. PVRIG protein was detectable in the LCLs after enrichment of the endogenous protein using two distinct antibodies, as well as in a positive control consisting of lysate from PVRIG-overexpressing cells, confirming the specificity of our assay (Fig. 6C,D). SLFN13 was not detectable in any LCL, suggesting either that the two tested antibodies against SLFN13 are not effective probes for immunoblotting or that SLFN13 is an unstable protein. Together with data from our heterologous reporter system, these measurements of endogenous protein levels support our hypothesis that diverse mechanisms of permissive translation enable protein production from genes containing nonsense variants.
Figure 6.

Stop codon readthrough enables protein production from a gene containing a nonsense variant. (A) LCLs used in this study and their genotype for PVRIG and SLFN13. (B) Cartoon depicting the experimental setup for immunoprecipitation and subsequent Western blotting for PVRIG and SLFN13 to measure endogenous protein in the LCLs listed in A. (C) Western blots for PVRIG and SLFN13 on immunoprecipitates that were enriched for the corresponding proteins from the illustrated LCLs. Two distinct antibodies were separately used for protein enrichment, and the antibodies were used together for Western blot detection. (*) Expected molecular weight for PVRIG (detected by both antibodies) and SLFN13 (detected by neither antibody). (M) Marker lane containing the ladder. (+) Positive control for PVRIG (PVRIG overexpression lysate). (+) High exposure, lane for the positive control (green box) shown in a higher exposure to illustrate specificity of the assay. Note that even though nondenaturing elution limits the bulk release of the Protein G–bound antibodies that were used to enrich for the antigen, some antibody release is unavoidable and is visible as heavy and light chains, which migrate at 50 and 25 kDa. Those bands do not interfere with the detection of PVRIG and SLFN13, which are expected to migrate at 32 and 102 kDa, respectively. (D) Higher exposure of the relevant portion (red box) of the PVRIG blot in C. PVRIG was detected by both antibodies at the expected molecular weight in all cell lysates.
Discussion
Our data demonstrate that many common nonsense variants have only modest impacts upon the levels of total protein produced from their seemingly disabled parent genes. Translation of mRNAs transcribed from genes containing nonsense variants arises from diverse mechanisms during the gene expression process, including transcription start and stop site choice, alternative splicing, translation start site choice, downstream translation initiation, and stop codon readthrough. Given the severe fitness costs of many complete gene knockouts in murine models (Ayadi et al. 2012; de Angelis et al. 2015), our data therefore suggest that permissive RNA processing and translation in human cells facilitates the accumulation of otherwise deleterious genetic variation in the human population.
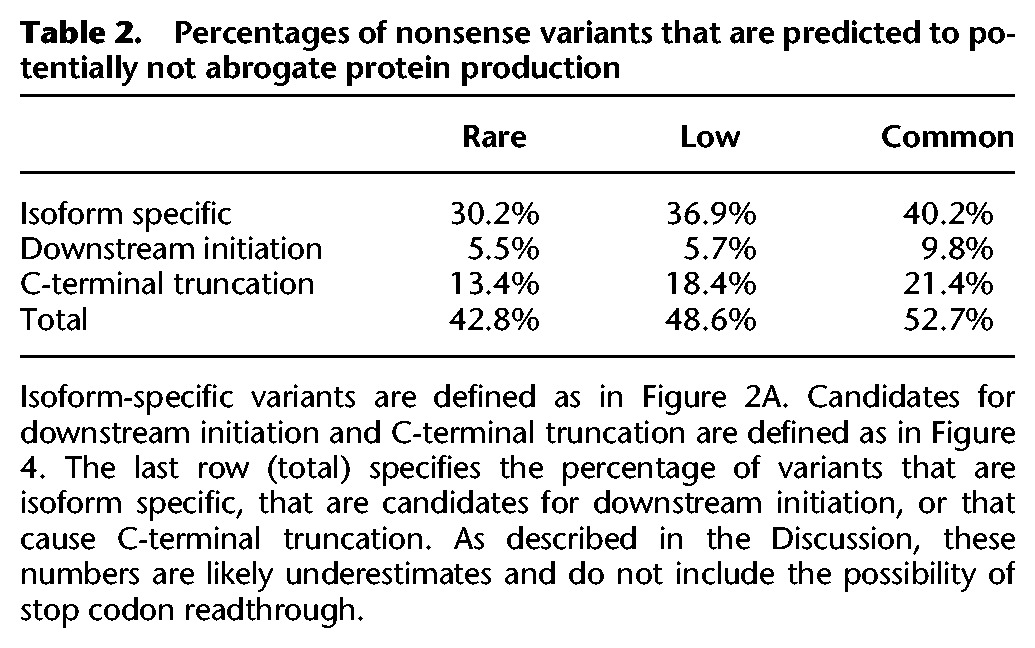
What fraction of nonsense variants disable gene function? We were able to directly answer this question for common variants by relying on individuals that are homozygous for the variants of interest. However, a direct answer is inaccessible for rare variants, which almost never occur in a homozygous state. (The low coverage of ribosome profiling and SILAC data prevents reliable analysis of allele-specific translation or protein levels in heterozygotes.) We therefore used sequence analyses to estimate that 43%–49% of rare and low-frequency variants identified by the 1000 Genomes Project are isoform specific or may induce N- or C-terminal truncation (Table 2). These predictions do not take into account the incompleteness of current isoform annotations, the possibility of initiation at noncanonical start codons, or the possibility of stop codon readthrough and so may be underestimates. We therefore speculate that permissive RNA processing frequently rescues protein production from genes containing rare nonsense variants, although at lower rates than their common counterparts.
Table 2.
Percentages of nonsense variants that are predicted to potentially not abrogate protein production
It is important to note that maintenance of protein production may not be equivalent to rescue of gene function in many cases. Different isoforms of a gene may encode proteins with distinct or even opposing functions, so that an isoform-specific nonsense variant may have unpredictable consequences. Even modest N- or C-terminal truncation could alter or abolish protein function by removing peptide signals that direct subcellular localization, prenylation, or other activities or modifications, or induce unexpected gain of function by placing a normally internal peptide signal at the N or C terminus. For example, a recent study identified a novel C-terminal truncating variant in CD164 that segregated with nonsyndromic hearing impairment in an affected family. Only the last six amino acids of CD164 were removed, but without the encoded canonical sorting motif, the truncated protein was trapped on the cell membrane (Nyegaard et al. 2015).
The most unexpected finding of our study was the prominent role played by mRNA translational plasticity in enabling protein production from genes containing nonpathogenic nonsense variants. The regulation of mRNA translation initiation and termination is incompletely understood, yet relevant for interpreting genetic data. Our data indicate that downstream translation initiation is associated with relaxed purifying selection and gives rise to N-terminally truncated proteins for some nonsense variants. Our data also show that stop codon readthrough enables translation of at least one mRNA containing a common nonsense variant. Stop codon readthrough is thought to be relatively rare in mammals, with only a few known examples (Eswarappa et al. 2014; Loughran et al. 2014; Schueren et al. 2014; Stiebler et al. 2014). Nonetheless, efficient readthrough of an otherwise fatal nonsense variant has been observed clinically (Pacho et al. 2011), highlighting the importance of translational plasticity when interpreting genetic data.
Together, our data demonstrate that permissive RNA processing has the potential to convert loss-of-function variants from genetic nulls into hypomorphic, silent, or even neomorphic alleles. Our results may therefore help to explain recent observations that some apparently healthy individuals carry homozygous putative loss-of-function variants within genes implicated in Mendelian disease (Kaiser et al. 2015). An improved mechanistic understanding of RNA processing and translation is essential for ongoing attempts to predict the pathogenicity of genetic variation (Kircher et al. 2014; MacArthur et al. 2014).
Methods
Genotypes
Genotypes from the phase 3 variant set called by the 1000 Genomes Project (1000 Genomes Project Consortium 2012) were downloaded from ftp://ftp-trace.ncbi.nih.gov/1000genomes/ftp/release/20130502.
We restricted our analysis of ribosome profiling data from Battle et al. (2015) to the 62 samples with genotypes called in this variant set, and used the 1000 Genomes genotyping for all analyses. For the RNA-seq data from Lappalainen et al. (2013), we used the genotyping information from the original study, available at http://www.ebi.ac.uk/arrayexpress/files/E-GEUV-1/genotypes/ and restricted to the 421 samples that were genotyped by sequencing. For global SNV analyses based on the 1000 Genomes variant set, we restricted to SNVs for which the alternate allele was present in a subsampled fraction of the 1000 Genomes data, wherein we restricted each of the 26 populations to no more than 90 samples to help to even the genotyping coverage among the available populations. For all data sets, we restricted genotyping calls to SNVs.
SNV functional annotation
We used SnpEff (Cingolani et al. 2012) to identify variants that affected coding DNA sequences and annotate their functional effects. We ran snpEff v4_1c with the options “-v -lof -no-downstream -no-intergenic -no-intron -no-upstream -no-utr --formatEff --download hg19” and then restricted to SNVs with predicted effects of “synonymous_variant” or “stop_gained” for at least one RefSeq transcript. For all transcript-level analyses, such as computing the amino acid affected by a SNV, we relied upon the AnnotationHub and BSgenome packages within Bioconductor (Huber et al. 2015).
Genome annotations
A merged genome annotation was created by combining the UCSC knownGene annotations (Meyer et al. 2013), Ensembl 71 (Flicek et al. 2013), and isoform annotations from MISO v2.0 (Katz et al. 2010) as previously described (Dvinge et al. 2014). A file of all possible splice junctions, consisting of all splice junctions present in the merged genome annotation as well as all possible combinations of 5′ and 3′ splice sites within each parent gene, was created for subsequent read mapping.
RNA-seq and ribosome profiling read mapping
FASTQ files were downloaded for RNA-seq data from LCLs from EBI's ArrayExpress under accession number E-GEUV-1 (Lappalainen et al. 2013) for ribosome profiling data from LCLs from the NCBI Gene Expression Omnibus under accession number GSE61742 (Battle et al. 2015) and for the Illumina Body Map 2.0 data set from ArrayExpress under accession number E-MTAB-513. RNA-seq and ribosome profiling reads were mapped to the UCSC hg19 (NCBI GRCh37) genome assembly as previously described (Dvinge et al. 2014). (Because our analyses consisted of comparisons between the relative expression of the reference versus alternate alleles, which are unaffected by the specific genome assembly, using the NCBI GRCh38 genome assembly instead of GRCh37 would not significantly affect our conclusions.) Briefly, RSEM (Li and Dewey 2011) was used to map reads to annotated transcripts, and the resulting unaligned reads were then aligned to the genome and the set of all possible splice junctions using TopHat v2.0.8b (Trapnell et al. 2009). We required that reads map with a maximum of three mismatches for the RNA-seq data, which consisted of 2×75 bp reads, and one mismatch for the ribosome profiling data, which consisted of shorter mixed-lengths reads. Reads mapped by RSEM and TopHat were then merged to create final BAM files of aligned reads.
SILAC mass spectrometry data
Gene-level quantification of relative protein abundance based on SILAC was taken from Supplemental Data Table 4 of the work by Battle et al. (2015).
Transcript expression, ASE, and isoform ratio measurements
Transcript expression (e.g., as illustrated in Fig. 1C,D) was quantified for RNA-seq or ribosome profiling data in units of fragments per kilobase per million mapped reads (FPKM) as follows. For each coding gene annotated in Ensembl 71, we counted the numbers of reads (or fragments, in the case of paired-end reads) that aligned to the longest CDS of that gene based on the RefSeq transcript set and then divided by the CDS length in kilobases. We then normalized these counts by dividing by a sample-specific normalization factor, defined as (106 × total number of reads mapping to any Ensembl coding gene as specified above). This computation relied upon the GenomicAlignments, GenomicFeatures, and GenomicRanges packages within Bioconductor (Lawrence et al. 2013; Huber et al. 2015) and resulted in expression measurements in units of FPKM.
ASE was measured by counting the numbers of RNA-seq reads containing the reference or alternate alleles. Isoform ratios were quantified genome-wide using MISO (Katz et al. 2010) as previously described (Dvinge et al. 2014).
Read coverage plots
Ribosome profiling read coverage plots were generated from BAM files of mapped reads as follows. For each sample, all reads aligned to the genomic locus of interest were extracted and trimmed to 25 bp by removing equal lengths of sequence as necessary from the 5′ and 3′ ends to control for the differing footprint read lengths. At each genomic position, the normalized coverage was computed as the total number of reads aligned to that position divided by a sample-specific normalization factor, defined as (106 × total number of reads mapping to any Ensembl coding gene). Samples were then classified according to their genotype, and the average coverage was computed for each genotype by averaging over the normalized coverage values for each sample. RNA-seq read coverage plots were generated via an identical procedure, but the reads were not trimmed (as all reads were of equal length). These plots relied upon the AnnotationHub and BSgenome packages within Bioconductor (Huber et al. 2015).
Plotting and graphics
All plots and figures were generated with the dplyr (http://CRAN.R-project.org/package=dplyr) and ggplot2 packages (Wickham 2009).
Reporter constructs
The reporter constructs for reference alleles were obtained as full-length cDNAs in the pcDNA3.1 backbone carrying FLAG and HA tags at the N and C termini, respectively (GenScript). Point mutations were introduced into constructs containing the reference alleles to generate the variants (GenScript).
Immunoprecipitation of PVRIG and SLFN13 from lymphoblastoid cell lysates
LCLs were obtained from the Coriell Biorepository and cultured under recommended conditions in RPMI with 15% FBS. Twenty-five million cells were pelleted and lysed in NP-40 lysis buffer (50 mM Tris at pH 8.0, 150 mM NaCl, 1% NP-40) containing EDTA-free protease inhibitor mini tablets (Pierce; catalog no. 88666). The lysate was incubated overnight at 4°C with 25 µL of protein G Dynabeads (Invitrogen) prebound to 10–50 µg of antibody (PVRIG: ab168153 [Abcam], NBP2-13832 [Novus Biologicals]; SLFN13: ab173951 [Abcam], NBP1-93879 [Novus Biologicals]). The beads were washed thrice with the Dynabead wash buffer and the bound proteins eluted in the nondenaturing elution buffer. The eluate was then subjected to Western blotting as described below using the same antibodies used for the immunoprecipitation. A transient overexpression lysate of PVRIG (LY411386; Origene Technologies) served as a positive control to determine the specificity of the antibodies used for Western blotting.
Western blotting
HEK293 cells were grown in DMEM containing 10% FBS and transfected with the reporter constructs using Lipofectamine 3000 transfection reagent (Invitrogen). After 48 h, the cells were lysed in TRIzol reagent (Invitrogen). Total protein was extracted following the manufacturer's instructions, and the protein pellet resuspended in sample buffer containing 5% SDS and 0.5 M unbuffered Tris base to ensure efficient solubilization, aided by gentle sonication in an ultrasonic water bath. Protein concentrations were determined using the BCA protein assay (ThermoScientific), 5 µg of total protein was resolved on 4%–12% NuPAGE Bis-Tris acrylamide gels (Novex), and Western blotting was performed using the LICOR system. The primary antibodies used were mouse monoclonal anti-FLAG M2 antibody (Sigma-Aldrich; catalog no. F1804) and rabbit monoclonal anti-HA antibody (EMD Millipore; catalog no. 05-902R). IRDye-conjugated secondary antibodies (LICOR) were used for quantitative detection of the tags. Rough estimates of the protein molecular weights were made by comparison with the Precision Plus Protein Kaleidoscope standards (Bio-Rad).
Supplementary Material
Acknowledgments
We thank Jesse Bloom and Guo-Liang Chew for comments on the manuscript. This research was supported by the Ellison Medical Foundation AG-NS-1030-13 (R.K.B.) and the FSH Society FSHS-22014-01 (S.J.).
Author contributions: S.J. and R.K.B. performed the experiments, analyzed the data, and wrote the paper.
Footnotes
[Supplemental material is available for this article.]
Article published online before print. Article, supplemental material, and publication date are at http://www.genome.org/cgi/doi/10.1101/gr.205070.116.
Freely available online through the Genome Research Open Access option.
References
- 1000 Genomes Project Consortium. 2012. An integrated map of genetic variation from 1,092 human genomes. Nature 491: 56–65. [DOI] [PMC free article] [PubMed] [Google Scholar]
- Andrés AM, Dennis MY, Kretzschmar WW, Cannons JL, Lee-Lin S-Q, Hurle B; NISC Comparative Sequencing Program, Schwartzberg PL, Williamson SH, Bustamante CD, et al. 2010. Balancing selection maintains a form of ERAP2 that undergoes nonsense-mediated decay and affects antigen presentation. PLoS Genet 6: e1001157. [DOI] [PMC free article] [PubMed] [Google Scholar]
- Ayadi A, Birling M-C, Bottomley J, Bussell J, Fuchs H, Fray M, Gailus-Durner V, Greenaway S, Houghton R, Karp N, et al. 2012. Mouse large-scale phenotyping initiatives: overview of the European Mouse Disease Clinic (EUMODIC) and of the Wellcome Trust Sanger Institute Mouse Genetics Project. Mamm Genome 23: 600–610. [DOI] [PMC free article] [PubMed] [Google Scholar]
- Battle A, Khan Z, Wang SH, Mitrano A, Ford MJ, Pritchard JK, Gilad Y. 2015. Genomic variation. Impact of regulatory variation from RNA to protein. Science 347: 664–667. [DOI] [PMC free article] [PubMed] [Google Scholar]
- Cingolani P, Platts A, Wang LL, Coon M, Nguyen T, Wang L, Land SJ, Lu X, Ruden DM. 2012. A program for annotating and predicting the effects of single nucleotide polymorphisms, SnpEff: SNPs in the genome of Drosophila melanogaster strain w1118; iso-2; iso-3. Fly (Austin) 6: 80–92. [DOI] [PMC free article] [PubMed] [Google Scholar]
- de Angelis MH, Nicholson G, Selloum M, White JK, Morgan H, Ramirez-Solis R, Sorg T, Wells S, Fuchs H, Fray M, et al. 2015. Analysis of mammalian gene function through broad-based phenotypic screens across a consortium of mouse clinics. Nat Genet 47: 969–978. [DOI] [PMC free article] [PubMed] [Google Scholar]
- Dvinge H, Ries RE, Ilagan JO, Stirewalt DL, Meshinchi S, Bradley RK. 2014. Sample processing obscures cancer-specific alterations in leukemic transcriptomes. Proc Natl Acad Sci 111: 16802–16807. [DOI] [PMC free article] [PubMed] [Google Scholar]
- Eswarappa SM, Potdar AA, Koch WJ, Fan Y, Vasu K, Lindner D, Willard B, Graham LM, DiCorleto PE, Fox PL. 2014. Programmed translational readthrough generates antiangiogenic VEGF-Ax. Cell 157: 1605–1618. [DOI] [PMC free article] [PubMed] [Google Scholar]
- Flicek P, Ahmed I, Amode MR, Barrell D, Beal K, Brent S, Carvalho-Silva D, Clapham P, Coates G, Fairley S, et al. 2013. Ensembl 2013. Nucleic Acids Res 41: D48–55. [DOI] [PMC free article] [PubMed] [Google Scholar]
- Gilad Y, Man O, Pääbo S, Lancet D. 2003. Human specific loss of olfactory receptor genes. Proc Natl Acad Sci 100: 3324–3327. [DOI] [PMC free article] [PubMed] [Google Scholar]
- Huber W, Carey VJ, Gentleman R, Anders S, Carlson M, Carvalho BS, Bravo HC, Davis S, Gatto L, Girke T, et al. 2015. Orchestrating high-throughput genomic analysis with Bioconductor. Nat Methods 12: 115–121. [DOI] [PMC free article] [PubMed] [Google Scholar]
- Ingolia NT, Lareau LF, Weissman JS. 2011. Ribosome profiling of mouse embryonic stem cells reveals the complexity and dynamics of mammalian proteomes. Cell 147: 789–802. [DOI] [PMC free article] [PubMed] [Google Scholar]
- International HapMap 3 Consortium. 2010. Integrating common and rare genetic variation in diverse human populations. Nature 467: 52–58. [DOI] [PMC free article] [PubMed] [Google Scholar]
- Kaiser VB, Svinti V, Prendergast JG, Chau Y-Y, Campbell A, Patarcic I, Barroso I, Joshi PK, Hastie ND, Miljkovic A, et al. 2015. Homozygous loss-of-function variants in European cosmopolitan and isolate populations. Hum Mol Genet 24: 5464–5474. [DOI] [PMC free article] [PubMed] [Google Scholar]
- Katz Y, Wang ET, Airoldi EM, Burge CB. 2010. Analysis and design of RNA sequencing experiments for identifying isoform regulation. Nat Methods 7: 1009–1015. [DOI] [PMC free article] [PubMed] [Google Scholar]
- Kettleborough RNW, Busch-Nentwich EM, Harvey SA, Dooley CM, de Bruijn E, van Eeden F, Sealy I, White RJ, Herd C, Nijman IJ, et al. 2013. A systematic genome-wide analysis of zebrafish protein-coding gene function. Nature 496: 494–497. [DOI] [PMC free article] [PubMed] [Google Scholar]
- Kircher M, Witten DM, Jain P, O'Roak BJ, Cooper GM, Shendure J. 2014. A general framework for estimating the relative pathogenicity of human genetic variants. Nat Genet 46: 310–315. [DOI] [PMC free article] [PubMed] [Google Scholar]
- Kukurba KR, Zhang R, Li X, Smith KS, Knowles DA, How Tan M, Piskol R, Lek M, Snyder M, MacArthur DG, et al. 2014. Allelic expression of deleterious protein-coding variants across human tissues. PLoS Genet 10: e1004304. [DOI] [PMC free article] [PubMed] [Google Scholar]
- Lappalainen T, Sammeth M, Friedländer MR, ‘t Hoen PAC, Monlong J, Rivas MA, Gonzalez-Porta M, Kurbatova N, Griebel T, Ferreira PG, et al. 2013. Transcriptome and genome sequencing uncovers functional variation in humans. Nature 501: 506–511. [DOI] [PMC free article] [PubMed] [Google Scholar]
- Lawrence M, Huber W, Pagès H, Aboyoun P, Carlson M, Gentleman R, Morgan MT, Carey VJ. 2013. Software for computing and annotating genomic ranges. PLoS Comput Biol 9: e1003118. [DOI] [PMC free article] [PubMed] [Google Scholar]
- Li B, Dewey CN. 2011. RSEM: accurate transcript quantification from RNA-Seq data with or without a reference genome. BMC Bioinformatics 12: 323. [DOI] [PMC free article] [PubMed] [Google Scholar]
- Lim ET, Würtz P, Havulinna AS, Palta P, Tukiainen T, Rehnström K, Esko T, Mägi R, Inouye M, Lappalainen T, et al. 2014. Distribution and medical impact of loss-of-function variants in the Finnish founder population. PLoS Genet 10: e1004494. [DOI] [PMC free article] [PubMed] [Google Scholar]
- Liu T, Lin K. 2015. The distribution pattern of genetic variation in the transcript isoforms of the alternatively spliced protein-coding genes in the human genome. Mol Biosyst 11: 1378–1388. [DOI] [PubMed] [Google Scholar]
- Loughran G, Chou M-Y, Ivanov IP, Jungreis I, Kellis M, Kiran AM, Baranov PV, Atkins JF. 2014. Evidence of efficient stop codon readthrough in four mammalian genes. Nucleic Acids Res 42: 8928–8938. [DOI] [PMC free article] [PubMed] [Google Scholar]
- Lykke-Andersen S, Jensen TH. 2015. Nonsense-mediated mRNA decay: an intricate machinery that shapes transcriptomes. Nat Rev Mol Cell Biol 16: 665–677. [DOI] [PubMed] [Google Scholar]
- MacArthur DG, Tyler-Smith C. 2010. Loss-of-function variants in the genomes of healthy humans. Hum Mol Genet 19: R125–R130. [DOI] [PMC free article] [PubMed] [Google Scholar]
- MacArthur DG, Seto JT, Raftery JM, Quinlan KG, Huttley GA, Hook JW, Lemckert FA, Kee AJ, Edwards MR, Berman Y, et al. 2007. Loss of ACTN3 gene function alters mouse muscle metabolism and shows evidence of positive selection in humans. Nat Genet 39: 1261–1265. [DOI] [PubMed] [Google Scholar]
- MacArthur DG, Balasubramanian S, Frankish A, Huang N, Morris J, Walter K, Jostins L, Habegger L, Pickrell JK, Montgomery SB, et al. 2012. A systematic survey of loss-of-function variants in human protein-coding genes. Science 335: 823–828. [DOI] [PMC free article] [PubMed] [Google Scholar]
- MacArthur DG, Manolio TA, Dimmock DP, Rehm HL, Shendure J, Abecasis GR, Adams DR, Altman RB, Antonarakis SE, Ashley EA, et al. 2014. Guidelines for investigating causality of sequence variants in human disease. Nature 508: 469–476. [DOI] [PMC free article] [PubMed] [Google Scholar]
- Meyer LR, Zweig AS, Hinrichs AS, Karolchik D, Kuhn RM, Wong M, Sloan CA, Rosenbloom KR, Roe G, Rhead B, et al. 2013. The UCSC Genome Browser database: extensions and updates 2013. Nucleic Acids Res 41: D64–D69. [DOI] [PMC free article] [PubMed] [Google Scholar]
- Nyegaard M, Rendtorff ND, Nielsen MS, Corydon TJ, Demontis D, Starnawska A, Hedemand A, Buniello A, Niola F, Overgaard MT, et al. 2015. A novel locus harbouring a functional CD164 nonsense mutation identified in a large Danish family with nonsyndromic hearing impairment. PLoS Genet 11: e1005386. [DOI] [PMC free article] [PubMed] [Google Scholar]
- Ong S-E, Blagoev B, Kratchmarova I, Kristensen DB, Steen H, Pandey A, Mann M. 2002. Stable isotope labeling by amino acids in cell culture, SILAC, as a simple and accurate approach to expression proteomics. Mol Cell Proteomics 1: 376–386. [DOI] [PubMed] [Google Scholar]
- Pacho F, Zambruno G, Calabresi V, Kiritsi D, Schneider H. 2011. Efficiency of translation termination in humans is highly dependent upon nucleotides in the neighbourhood of a (premature) termination codon. J Med Genet 48: 640–644. [DOI] [PubMed] [Google Scholar]
- Popp MW-L, Maquat LE. 2013. Organizing principles of mammalian nonsense-mediated mRNA decay. Annu Rev Genet 47: 139–165. [DOI] [PMC free article] [PubMed] [Google Scholar]
- Rivas MA, Pirinen M, Conrad DF, Lek M, Tsang EK, Karczewski KJ, Maller JB, Kukurba KR, DeLuca DS, Fromer M, et al. 2015. Effect of predicted protein-truncating genetic variants on the human transcriptome. Science 348: 666–669. [DOI] [PMC free article] [PubMed] [Google Scholar]
- Schueren F, Lingner T, George R, Hofhuis J, Dickel C, Gärtner J, Thoms S. 2014. Peroxisomal lactate dehydrogenase is generated by translational readthrough in mammals. eLife 3: e03640. [DOI] [PMC free article] [PubMed] [Google Scholar]
- Stiebler AC, Freitag J, Schink KO, Stehlik T, Tillmann BAM, Ast J, Bölker M. 2014. Ribosomal readthrough at a short UGA stop codon context triggers dual localization of metabolic enzymes in Fungi and animals. PLoS Genet 10: e1004685. [DOI] [PMC free article] [PubMed] [Google Scholar]
- Sulem P, Helgason H, Oddson A, Stefansson H, Gudjonsson SA, Zink F, Hjartarson E, Sigurdsson GT, Jonasdottir A, Jonasdottir A, et al. 2015. Identification of a large set of rare complete human knockouts. Nat Genet 47: 448–452. [DOI] [PubMed] [Google Scholar]
- Trapnell C, Pachter L, Salzberg SL. 2009. TopHat: discovering splice junctions with RNA-Seq. Bioinformatics 25: 1105–1111. [DOI] [PMC free article] [PubMed] [Google Scholar]
- Wang ET, Sandberg R, Luo S, Khrebtukova I, Zhang L, Mayr C, Kingsmore SF, Schroth GP, Burge CB. 2008. Alternative isoform regulation in human tissue transcriptomes. Nature 456: 470–476. [DOI] [PMC free article] [PubMed] [Google Scholar]
- Wickham H. 2009. ggplot2: elegant graphics for data analysis. Springer, New York: http://ggplot2.org/book/. [Google Scholar]
- Xue Y, Daly A, Yngvadottir B, Liu M, Coop G, Kim Y, Sabeti P, Chen Y, Stalker J, Huckle E, et al. 2006. Spread of an inactive form of caspase-12 in humans is due to recent positive selection. Am J Hum Genet 78: 659–670. [DOI] [PMC free article] [PubMed] [Google Scholar]
Associated Data
This section collects any data citations, data availability statements, or supplementary materials included in this article.