This study demonstrates low variation of coronary plaque volume assessment with state-of-the-art coronary CT angiography when the same CT vendor is used at baseline and for follow-up plaque assessment; coronary CT angiography may be a noninvasive alternative to intravascular US to reliable assess coronary plaque volume.
Abstract
Purpose
To determine reader and computed tomography (CT) scan variability for measurement of coronary plaque volume.
Materials and Methods
This HIPAA-compliant study followed Standards for Reporting of Diagnostic Accuracy guidelines. Baseline coronary CT angiography was performed in 40 prospectively enrolled subjects (mean age, 67 years ± 6 [standard deviation]) with asymptomatic hyperlipidemia by using a 320–detector row scanner (Aquilion One Vision; Toshiba, Otawara, Japan). Twenty of these subjects underwent coronary CT angiography repeated on a separate day with the same CT scanner (Toshiba, group 1); 20 subjects underwent repeat CT performed with a different CT scanner (Somatom Force; Siemens, Forchheim, Germany [group 2]). Intraclass correlation coefficients (ICCs) and Bland-Altman analysis were used to assess interreader, intrareader, and interstudy reproducibility.
Results
Baseline and repeat coronary CT angiography scans were acquired within 19 days ± 6. Interreader and intrareader agreement rates were high for total, calcified, and noncalcified plaques for both CT scanners (all ICCs ≥ 0.96) without bias. Scanner variability was ±18.4% (coefficient of variation) with same-vendor follow-up. However, scanner variability increased to ±29.9% with different-vendor follow-up. The sample size to detect a 5% change in noncalcified plaque volume with 90% power and an α error of .05 was 286 subjects for same–CT scanner follow-up and 753 subjects with different-vendor follow-up.
Conclusion
State-of-the-art coronary CT angiography with same-vendor follow-up has good scan-rescan reproducibility, suggesting a role of coronary CT angiography in monitoring coronary artery plaque response to therapy. Differences between coronary CT angiography vendors resulted in lower scan-rescan reproducibility.
© RSNA, 2016
Introduction
The natural history of coronary artery disease involves a progressive increase in coronary plaque volume that potentially results in plaque rupture and coronary artery thrombosis (1,2). Prior studies with intravascular ultrasonography (US) have shown markedly differing interindividual responses to antiatherosclerotic therapy with HMG-CoA reductase inhibitors (statins). Despite an overall regression in total plaque volume in patients with high risk treated with statins, approximately 35% of high-risk patients showed progression of plaque despite statin therapy (3). The advent of high-dose, high-potency statin therapy, as well as new therapies with monoclonal antibodies that inactivate proprotein convertase subtilisin/kexin type 9, or PCSK9, raises the potential for directed antiatherosclerotic therapy with the goal of reducing coronary artery plaque volume.
The current reference standards for measuring change in coronary artery plaque volume are intravascular US and optical coherence tomography (OCT) (4). However, routine serial assessment with intravascular US or OCT is limited by the invasive nature and cost of these examinations, making only high-risk patients eligible for follow-up. Additionally, OCT lacks the ability to depict the outer vessel wall in the presence of plaque, limiting its capability for total plaque volume assessment (5). Coronary computed tomographic (CT) angiography is a noninvasive alternative for directly quantifying coronary plaque volume. Previous studies (6,7) have shown good reader reproducibility for measuring coronary stenosis and quantifying plaque volume. However, little is known about the variability of the coronary CT angiography study itself (“scan-rescan variation”). The use of semiautomated plaque quantification software may both improve coronary CT angiography reproducibility and help in mitigating intervendor variability in plaque assessment (8). Measurements of plaque volume at coronary CT angiography may show variation because of technical issues such as changes in heart rate, pharmacologic therapy, iodine bolus, and/or myocardial motion. In addition, the scan-rescan variation of coronary CT angiography between different CT scanners has not been established. We hypothesized that state-of-the-art coronary CT angiography hardware and software can reliably measure coronary plaque volume. We assessed stable subjects by using the same scanner or a scanner from a different CT vendor within a 30-day period. These results are directly applicable to determine whether plaque volume has changed over time in a single patient. We also determined the impact of coronary CT angiography variability on sample size estimates that would be applicable in a clinical trial (eg, to determine the potential response to antiatherosclerosis therapy). The aim of this study was to determine reader and CT scan variability in the measurement of coronary plaque volume.
Materials and Methods
Study Design
The study was compliant with the Health Insurance Portability and Accountability Act, was approved by our institutional review board, and followed the 2015 guidelines for Standards for Reporting of Diagnostic Accuracy, or STARD (9). Written informed consent was obtained from each subject before enrollment. Forty study subjects were prospectively enrolled between October 2012 and November 2015 at the National Institutes of Health Clinical Center. The authors designed the study and had control of the data and information submitted for publication. The study participants were recruited on a voluntary basis in a convenience series from a cohort that had been prospectively enrolled in the Risk Stratification with Image Guidance of HMG-CoA Reductase Inhibitor Therapy, or RIGHT, study (NCT0212900). The RIGHT study enrolled asymptomatic subjects with hyperlipidemia over the age of 55 years who were eligible for statin therapy according to Adult Treatment Panel–III guidelines. Exclusion criteria included renal failure, concurrent non-statin lipid therapy, and hypersensitivity to iodinated contrast material. Study subjects had clinically stable conditions, with no change in medical status within year prior to study entry. No adverse events from performing the study were recorded. No subjects were excluded from analysis after enrollment for this study.
Image Acquisition
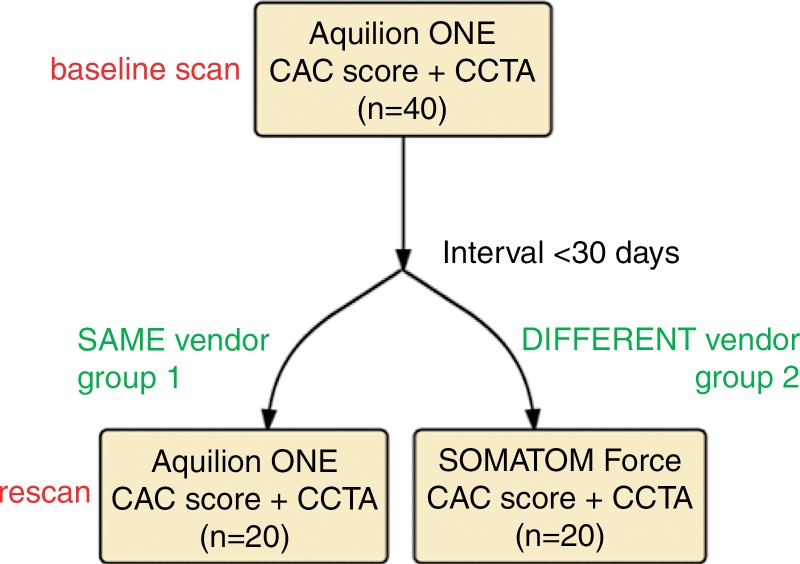
All patients underwent baseline Agatston coronary artery calcium (CAC) scoring and coronary CT angiography performed by using an Aquilion One Vision 320–detector row 0.5-mm detector scanner (Toshiba Medical Systems, Otawara, Japan). Repeat CAC scoring and coronary CT angiography were performed within 30 days of the baseline scan. For the repeat scan, 20 subjects (group 1) underwent a repeat coronary CT angiography scan with the same Aquilion One scanner, while the other 20 subjects (group 2) underwent a repeat coronary CT angiography scan with a Somatom Force 2 × 192-row 0.6-mm detector dual-source scanner (Siemens Healthcare, Forchheim, Germany) (Fig 1). Oral β-blockade agents were administered if the patient’s resting heart rate was greater than 65 beats per minute. CAC scoring with the Aquilion One and the Somatom Force was performed with a tube voltage of 120 kVp, adaptive tube current based on sex and body mass index (BMI), and rotation times of 275 and 250 msec, respectively. For coronary CT angiography, iodinated contrast material (iopamidol 370 mg/mL, Isovue 370; Bracco Diagnostics, Melville, NY), was administered intravenously at a rate of 5 mL/sec on the basis of subject weight (50 mL for subjects weighing < 59 kg; 60 mL for subjects weighing 60–100 kg; and 70 mL for subjects weighing > 100 kg). Coronary CT angiography with the Aquilion One scanner was performed with a tube voltage of 100 or 120 kVp, a rotation time of 275 msec, and adaptive tube current that depended on sex and BMI, whereas with the Somatom Force scanner, coronary CT angiography was performed in a dual-energy acquisition with a tube voltage of 90/Sn150 kVp, a rotation time of 250 msec, and adaptive tube current. Effective dose was calculated by multiplying the dose-length product (DLP) by 0.014 mSv/mGy · cm as the constant k-value for cardiovascular imaging. Images were reconstructed at a section thickness of 0.5 mm and an increment of 0.25 mm with a standard soft-tissue kernel, FC03 for Aquilion One and Br36 for Somatom Force. Siemens images were calculated by addition of the original low-tube-voltage and high-tube-voltage images with a 0.6 weighting ratio (10). All iodine injection and CT parameters were carefully kept constant between baseline and repeat coronary CT angiography scans.
Figure 1:
Study flowchart. CCTA = Coronary CT angiography.
Image Analysis
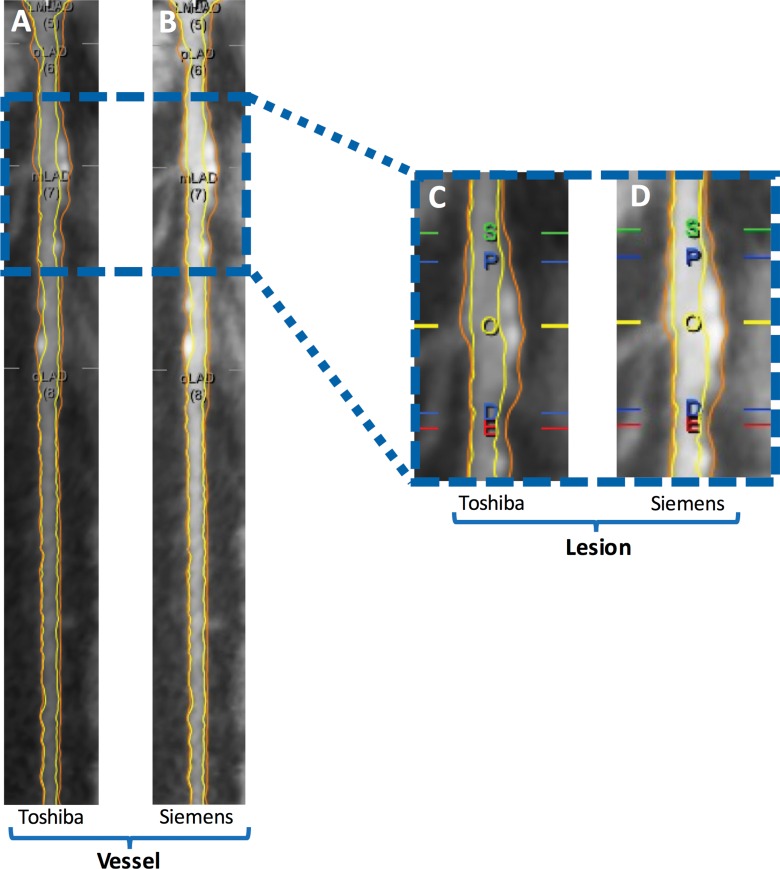
Plaque analysis was performed at a dedicated workstation using QAngioCT, version 2.1.9.1 (Medis Medical Imaging Systems, Leiden, the Netherlands) as previously described (11). QAngioCT software has been validated for the quantification of plaque volume by comparison with intravascular US findings (12). The coronary tree was automatically extracted, and each of the major vessels (the left main artery, the left anterior descending [LAD] artery, the left circumflex artery, and the right coronary artery were analyzed from the ostium to the point at which the internal vessel caliber decreased to less than 2.0 mm, exclusive of focal stenosis. Segmentation was performed according to American Heart Association nomenclature (13). Proximal segments were defined as the left main artery, proximal LAD artery, left circumflex artery, and right coronary artery. Middle segments were defined as the middle LAD artery and right coronary artery segments, whereas the remaining segments were defined as distal. Incompletely visualized segments or segments with motion artifacts, poor image quality, and/or stents were excluded. Plaque nomenclature followed that of Miller et al (14). QAngio software was used to automatically contour the inner and outer lumen walls. Segmentation errors were subsequently manually corrected by trained readers (training for proper operation of the software was provided by senior observers and in coordination with the software manufacturer on separate coronary CT angiography training data sets). Lumen attenuation was adaptively corrected on an individual scan basis by using gradient filters in combination with intensity values of the arteries (Fig 2).
Figure 2:
Example of, A, B, vessel-based and, C, D, lesion-based coronary plaque analysis in the LAD artery in a 62-year-old man. A, C, Baseline Toshiba coronary CT angiography images. B, D, Rescan Siemens coronary CT angiography images. Yellow line and O = maximum stenosis; blue lines = proximal (P) and distal (D) borders of lesion; green and red lines = proximal and distal normal reference areas, respectively. The vessel total coronary plaque volume was 212.2 mm3 for the Toshiba scan and 211.3 mm3 for the Siemens scan. Lesion total coronary plaque volume was 91.2 mm3 for the Toshiba scan and 93.2 mm3 for the Siemens scan.
The following two outcome measures were evaluated by the readers:
Total plaque volume.—Total coronary artery plaque volume was calculated by subtracting the lumen volume from the outer wall volume for all coronary vessels 2.0 mm in diameter or larger (exclusive of focal stenosis). Coronary plaque volume was determined for each segment, and results reflect analysis on a segment level.
Focal coronary lesion volume.—A focal lesion was identified on curved multiplanar reconstructions as a stenosis of greater than 30% compared with the most normal-appearing adjacent cross-section. If more than one lesion was present, the most severe lesion was analyzed to avoid clustering effects.
Both plaque metrics are reported, because there is precedence in the literature for both approaches to assess the extent of coronary plaque. For both total plaque volume and lesion volume, the noncalcified (“soft”) plaque volume was calculated as the difference between total plaque volume and calcified plaque volume.
The two trained readers (R.S. and J.Z.M.) were blinded to clinical information and analyzed all baseline and repeat coronary CT angiography scans. The readers had 5 years and 1 year of experience in cardiovascular imaging, respectively, and were supervised by a cardiologist (V.S.) with more than 5 years of imaging experience and interventional cardiology training and a radiologist (D.A.B.) with more than 10 years of coronary CT angiography experience and American College of Radiology coronary CT angiography certification. Reader 1 (R.S.) re-read all coronary CT angiography studies in group 2 after 4 weeks to assess intrareader reproducibility.
Statistical Analysis
Statistical analyses were performed by using R Statistical Software, version 3.2.2 (Foundation for Statistical Computing, Vienna, Austria) and MedCalc, version 16.1 (MedCalc Software, Mariakerke, Belgium). Data were tested for normal distribution with the Shapiro-Wilk test. Summary statistics for all continuous variables are reported as means ± standard deviations or as medians with interquartile ranges, as appropriate. The Student t test for independent samples and the Mann-Whitney U test were used to compare continuous variables between groups. The paired t test and the paired Wilcoxon signed rank test were used to compare continuous variables between baseline and control coronary CT angiography. P < .05 was considered to indicate a statistically significant difference. Intrareader, interreader, and interstudy agreement were assessed by using intraclass correlation coefficients (ICCs) and Bland-Altman analysis with 95% limits of agreement (LOAs) (15). ICCs of greater than 0.75 and of 0.4–0.75 indicate strong and average agreement, respectively. ICCs were corrected for within-patient correlation of segments. A difference between ICCs was considered to be statistically significant when there was no overlap between their respective 95% confidence interval (CI) limits. Linear mixed models that accounted for correlations within patients were used to estimate the effects of reader and scanner hardware on plaque measurements. The fixed-effects predictors included indicator variables for reader (reader 1 and reader 2) and group (same vendor and different vendor). To account for the similarity of measurements within a single patient, we included a random effect for patient (16). The interstudy mean and standard deviation of noncalcified plaque volume were calculated as the mean and standard deviation of the difference between rescan and baseline coronary CT angiography divided by the baseline coronary CT angiography noncalcified plaque volume. Sample size estimates were derived from the interstudy standard deviation of noncalcified plaque volume as described by Machin et al (17) and Altman (18). The sample size required by coronary CT angiography to show a clinical change with 90% power and an α error of .05 was calculated by using the following formula:
where α is the significance level, P is the study power,  is the value of the factor for different values of α and P, σ is the interstudy standard deviation, δ is the desired percentage difference to be detected, and n is the sample size needed. Coronary CT angiography reproducibility and sample size were calculated for both a vessel-based and a lesion-based analysis, as defined above.
Results
Forty study subjects (29 men) underwent baseline and repeat coronary CT angiography examinations. The mean age was 67 years ± 6 (standard deviation) (range, 57–83 years). The mean time between baseline and repeat coronary CT angiography was 19 days (range, 7–28 days). No clinically relevant medical events occurred for any subject between baseline and repeat coronary CT angiography. No significant differences in baseline demographics were present between subjects in group 1 and those in group 2 (Table 1). Mean radiation doses were similar for all coronary CT angiography examinations; for example, radiation dose at baseline was 4.5 mSv for Toshiba and 4.8 mSv for Siemens coronary CT angiography (P = .50, Table 1). In total, 80 coronary CT angiography examinations, 667 coronary artery segments, and 67 coronary lesions were analyzed by the two readers. Reader 1 re-read all coronary CT angiography studies from group 2 (334 coronary artery segments and 31 coronary lesions) after 4 weeks to assess intrareader reproducibility.
Table 1.
Baseline Demographic and Laboratory Data and Radiation Dose Parameters
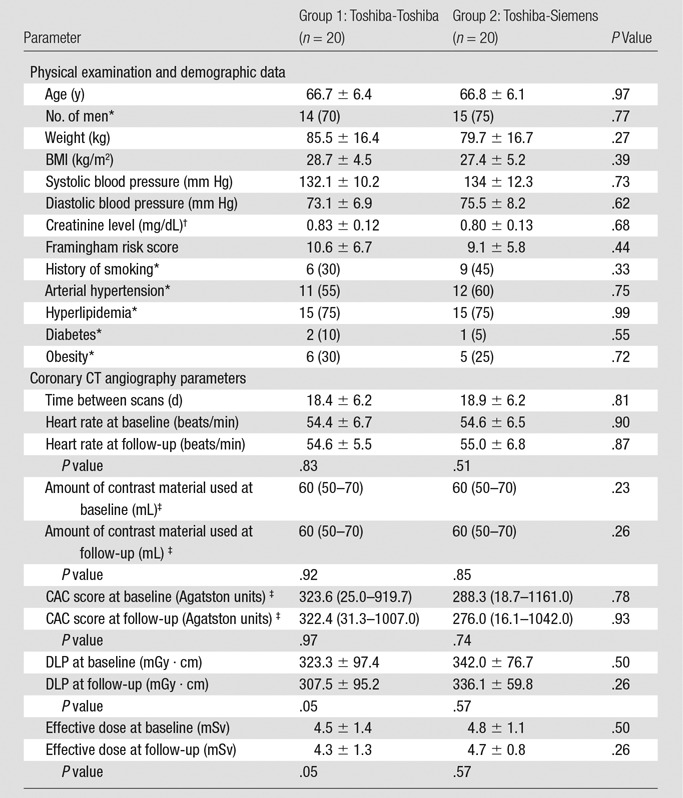
Note.—Unless otherwise specified, data are means ± standard deviations. There were no significant changes in weight, BMI, blood pressure, and creatinine level between baseline and follow-up.
*Data are numbers of patients, with percentages in parentheses.
†To convert creatinine levels to Système International units (micromoles per liter), multiply by 88.4.
‡Data are medians, with interquartile ranges in parentheses.
Reader Variability
Intrareader agreement was high for total, calcified, and noncalcified plaque for both Toshiba (ICC: 0.999, 0.999, and 0.998, respectively) and Siemens (ICC: 0.996, 0.999, and 0.991, respectively) coronary CT angiography. No significant bias was observed with Bland-Altman analysis for Toshiba and Siemens intrareader comparison (0.4 and 0.9 mm3, 95% LOAs: −13.4, 14.2 mm3 and −17.7, 19.4 mm3, respectively). Intrareader reproducibility for target coronary lesion total, calcified, and noncalcified plaque volume was similar to total vessel reproducibility.
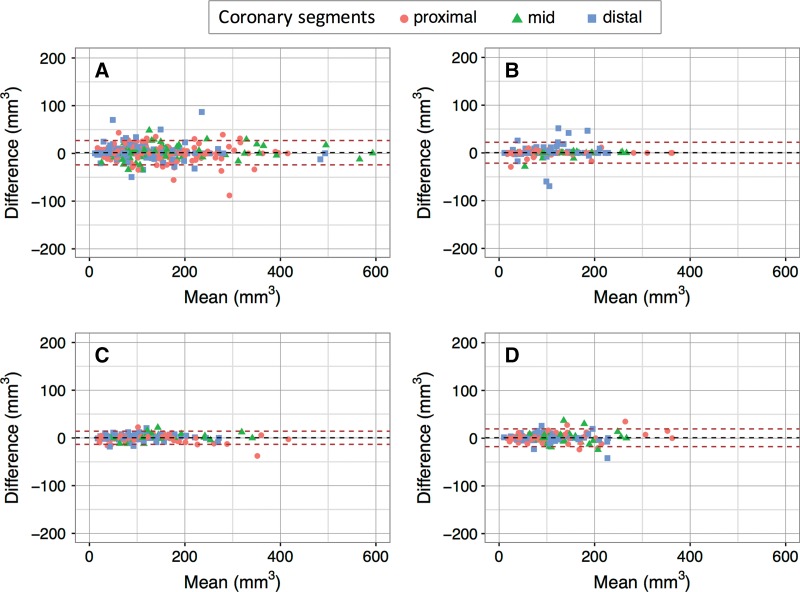
Interreader agreement was high for total, calcified, and noncalcified plaque for both Toshiba (ICC: 0.997, 0.999, and 0.985, respectively) and Siemens (ICC: 0.997, 0.999, and 0.991, respectively) coronary CT angiography. Bland-Altman analysis showed a mean bias of 1.4 mm3 for Toshiba and 0.4 mm3 for Siemens interreader comparison, with 95% LOAs of −23.6, 26.4 mm3 and −21.5, 22.4 mm3, respectively. Interreader reproducibility for target coronary lesion total, calcified, and noncalcified plaque was similar to total vessel reproducibility (ICC: 0.997, 0.965, 0.995 for Toshiba; ICC: 0.967, 0.961, 0.974 for Siemens) without significant bias. Interreader and intrareader ICCs and Bland-Altman plots are shown in Table 2 and in Figure 3. Detailed raw data from coronary CT angiography readings and Bland-Altman plots for calcified and noncalcified plaque volumes are provided in Table E1 (online) and Figures E1 and E2 (online), respectively.
Table 2.
Reader Reproducibility for Coronary Artery Plaque at Coronary CT Angiography
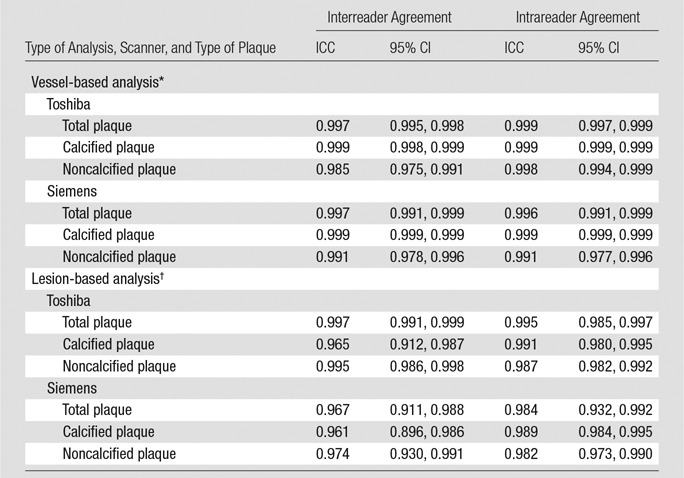
*In vessel-based analysis, total plaque volume is measured for all coronary artery segments.
†In lesion-based analysis, plaque volume is measured in the single most significant focal coronary artery lesion.
Figure 3:
Bland-Altman plots show interreader and intrareader reproducibility of vessel total plaque measurements. A, Interreader reproducibility of Toshiba coronary CT angiography (bias: 1.4 mm3 [95% LOAs: −23.6, 26.4 mm3]). B, Interreader reproducibility of Siemens coronary CT angiography (bias: 0.4 mm3 [95% LOAs: −21.5, 22.4 mm3]). C, Intrareader reproducibility of Toshiba coronary CT angiography (bias: 0.4 mm3 [95% LOAs: −13.4, 14.2 mm3]). D, Intrareader reproducibility of Siemens coronary CT angiography (bias: 0.9 mm3 [95% LOAs: −17.7, 19.4 mm3]).
CT Scanner Variation
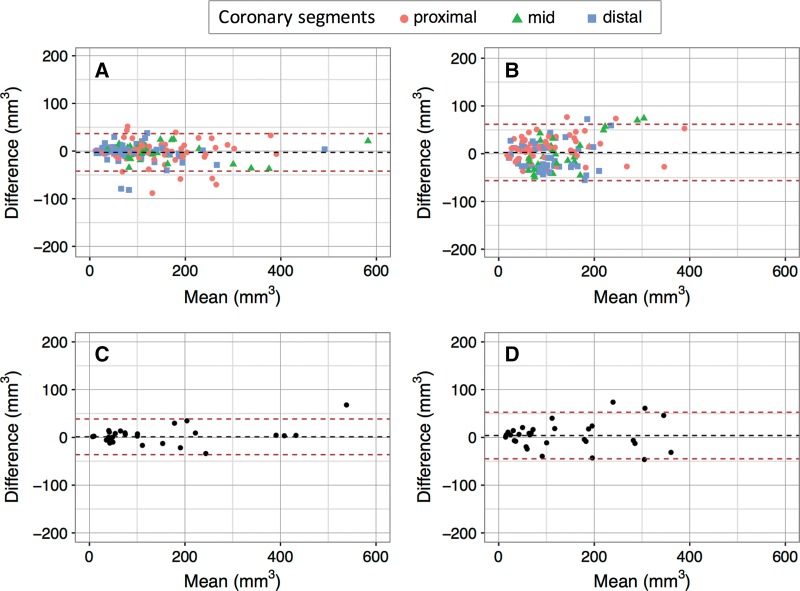
Table 3 and Figure 4 summarize the scan-rescan variation for vessel and lesion total, calcified, and noncalcified coronary plaque. Scan-rescan variation showed no significant bias but was significantly better for group 1 than for group 2 for both total plaque (vessel ICC: 0.967 vs 0.766; lesion ICC: 0.964 vs 0.788) and noncalcified plaque (vessel ICC: 0.948 vs 0.609; lesion ICC: 0.950 vs 0.642) with smaller 95% LOAs in Bland-Altman analysis. A similar though nonsignificant trend was observed for calcified plaque.
Table 3.
CT Scanner Reproducibility for Coronary Artery Plaque at Coronary CT Angiography

Note.—Data in parentheses are 95% CIs. BA = Bland-Altman, COV = coefficient of variation, Diff = interstudy difference.
*In vessel-based analysis, total plaque volume is measured for all coronary artery segments.
†In lesion-based analysis, plaque volume is measured in the single most significant focal coronary artery lesion.
Figure 4:
Bland-Altman plots show scan-rescan reproducibility of, A, B, vessel and, C, D, coronary lesion total plaque measurements for, A, C, group 1 and, B, D, group 2.
The variability (expressed as the coefficient of variation, the interstudy standard deviation normalized to the mean) of Toshiba coronary CT angiography at baseline and at follow-up was 18.4% and 16.0% for measurement of noncalcified plaque for all coronary arteries and for the most significant lesion, respectively. The variability of Toshiba coronary CT angiography at baseline and Siemens coronary CT angiography at follow-up was 29.9% and 26.4% for measurement of noncalcified plaque for all coronary arteries and for the most significant lesion, respectively. In Figure 4, Bland-Altman plots are shown for both a vessel- and a lesion-based analysis. Differences within the 95% LOAs can be attributed to variations in the measurement, while values outside these limits suggest a true change in plaque volume. For instance, for a lesion-based follow-up study of a noncalcified plaque, the 95% LOAs for same-scanner follow-up were −31.3%, 31.5%; thus, a plaque volume change of 32% or more can be considered a true change with 95% confidence. Conversely, for different-scanner follow-up, the 95% LOAs were −54.1%, 49.3%, so a change of 55% or more in plaque volume would be required to be considered a true change with this level of confidence. After correction for within-patient correlation of segments, there was a significant effect of vendor on calcified plaque volume (12% lower calcified plaque volume estimates at Siemens coronary CT angiography), whereas total and noncalcified plaque volumes were similar for both vendors (Table 4).
Table 4.
Effects of Reader and CT Scanner on Interstudy Variability of Coronary Plaque Measurements
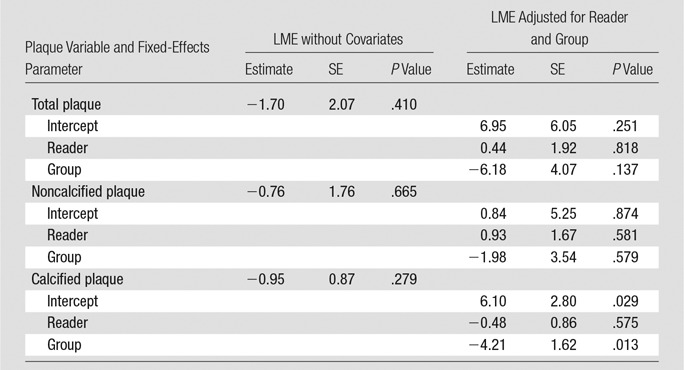
Note.—Parameter estimates, their standard errors (SEs) of the mean and corresponding P values were computed based on two linear mixed-effects models (LMEs). The P values are for testing the null hypothesis that the true value of the parameter is zero versus the nonzero alternative. The outcomes are the differences in plaque measurements (total plaque, noncalcified plaque, and calcified plaque). The two mixed-effects models were as follows: (a) LME without covariates (ie, with only fixed- and random-effects intercepts) and (b) LME adjusted for reader and group (ie, with fixed- and random-effects intercepts and fixed and random effects for group). The results were computed by using the R “lme4” package by treating the patients as clusters with repeated measurements obtained at the segments within each patient (16).
Variability of CAC Score and Relationship to CAC Volume
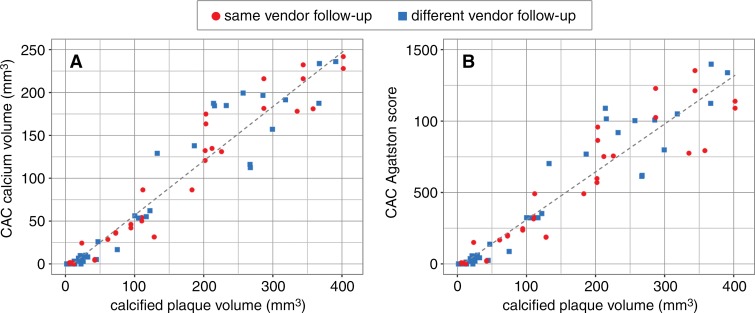
We evaluated the scan-rescan variation for CAC score as a quality assurance metric in comparison with prior literature data. The scan-rescan variation of the CAC score was low, with ICC of 0.998 (95% CI: 0.997, 0.999) and 0.996 (95% CI: 0.994, 0.997) for groups 1 and 2, respectively. Vessel calcified plaque volume as assessed by using the QAngio software at coronary CT angiography showed strong correlation with calcium volume in terms of CAC score for Toshiba and Siemens (ICC: 0.810 [95% CI: 0.681, 0.885] and 0.753 [95% CI: 0.582, 0.864], respectively).
The Agatston CAC score categorizes the highest density of calcification with a weighting factor (one for 130–199 HU, two for 200–299 HU, three for 300–399 HU, and four for 400 HU and greater) multiplied by the area of the coronary calcification. As a result of the weighting factor, the correlation of Agatston CAC score with CAC volume was low (Toshiba ICC: 0.541 [95% CI: 0.452, 0.610]; Siemens ICC: 0.448 [95% CI: 0.280, 0.603]) (Fig 5) (19).
Figure 5:
Correlation plots show calcified plaque volume versus, A, calcium volume and, B, Agatston score, as assessed by using the conventional CAC score. The average of both readers is shown for each data point. ICCs were significantly better for calcium volume than for Agatston score (same-vendor study: 0.810 [95% CI: 0.681, 0.885] vs 0.541 [95% CI: 0.452, 0.610]; different vendor study: 0.753 [95% CI: 0.582, 0.864] vs 0.448 [95% CI: 0.280, 0.603]).
Sample Size Estimation for Clinical Trials
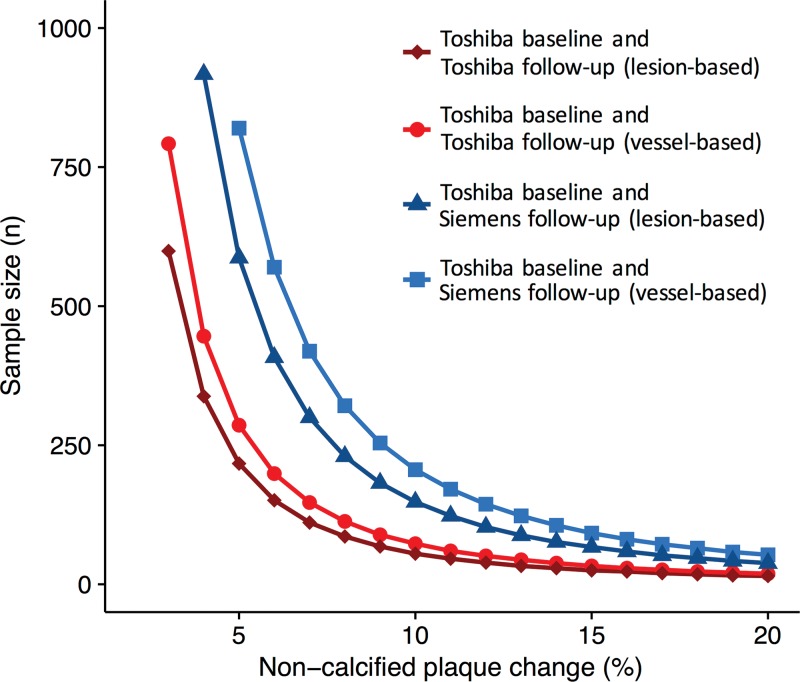
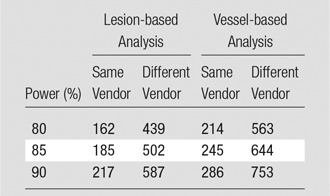
On the basis of the scan-rescan variability of coronary CT angiography (Table 3), we calculated sample sizes needed to detect decreases in noncalcified plaque volume by using coronary CT angiography (Fig 6). Results of prior studies determining the effect of statin therapy on coronary plaque are summarized in Table 5. An example of the use of this is as follows: Considering a clinical trial intended to show a change of 5% in noncalcified plaque volume over time with a power of 90%, 217 patients would be needed for lesion-based analysis of noncalcified plaque for follow-up with the same scanner, whereas 587 patients would be needed if a different vendor is used for follow-up. Similarly, for a vessel-based analysis of noncoronary plaque volume, the sample size to detect a change of 5% in plaque volume over time would need to be 286 patients for follow-up with the same scanner, but 753 patients with different-vendor follow-up. Estimated sample sizes required in each group to detect a change in noncalcified plaque with coronary CT angiography follow-up are summarized in Table 6.
Figure 6:
Graph shows sample size required in each group to detect a change in noncalcified plaque with 90% power and an α error of .05. The x-axis represents the plaque volume change to be detected and the y-axis the corresponding sample size needed for a same-vendor study ( Toshiba baseline vs Toshiba follow-up) and a different-vendor study ( Toshiba baseline vs Siemens follow-up).
Table 5.
Examples of Longitudinal Trials Evaluating the Impact of Statin Therapy on Coronary Artery Plaque Volume
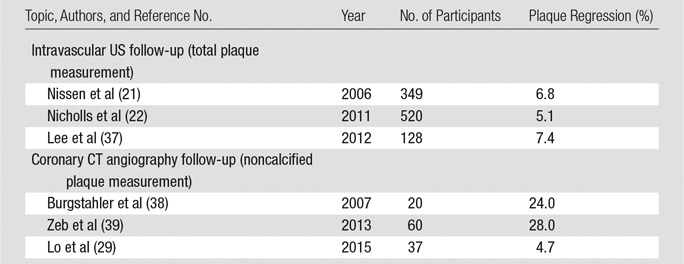
Table 6.
Estimated Sample Sizes Required in Each Group to Detect a Change in Noncalcified Plaque with Coronary CT Angiography Follow-up in a Clinical Trial and an α Error of .05
Discussion
Technologic advances have dramatically reduced coronary CT angiography radiation dose, making serial coronary CT angiography clinically feasible for longitudinal plaque follow-up (20). Historically, coronary atherosclerosis has been considered a relentless progressive disease for which slowing plaque growth was the best obtainable result. However, recent studies (21,22) have shown that high-intensity treatment with newer, more potent statins has the potential to induce plaque stabilization or regression in a significant number of patients. Unfortunately, approximately one-third of patients may experience progression of coronary plaque despite potentially lifelong statin therapy. Timely recognition of response to statin treatment—or lack thereof—may allow for personalized, more cost-effective medical therapy if noninvasive evaluation is available and can be fully validated. Our results show high agreement rates of trained readers for determining plaque volumes (all agreement rates were ≥ 0.96). Additionally, we assessed the variability of the CT scanner measurements by performing repeat coronary CT angiography on a different day, within a short interval (median, 19 days ± 6). All study subjects were outpatients in stable condition, so the true amount of plaque was considered to be unchanged during follow-up. When the same CT vendor was used for baseline and at follow-up, scanner variability was ±18.4% (coefficient of variation). However, when a different vendor was used at follow-up, scanner variability was ±29.9%.
Coronary CT angiography is a noninvasive, less expensive alternative to intravascular US or OCT. However, a key remaining issue has been to understand the reliability of coronary CT angiography plaque volume measurements. This information is needed to interpret changes in plaque volume over time. Previous studies (23–25) reported good interreader and intrareader coronary CT angiography reproducibility for assessment of calcified plaque in the proximal segments of the coronary tree; however, reproducibility was poor for assessment of noncalcified plaque, especially in distal segments of the coronary tree. Measurement of noncalcified plaque with coronary CT angiography is challenging because of the relatively poor soft-tissue contrast between soft plaque/adventitia and surrounding fat tissue (26). Nevertheless, its assessment is of paramount importance, as noncalcified plaque appears to be more vulnerable, to be associated with acute coronary syndromes, and more likely to be influenced by medical intervention (27–30).
Importantly, our results indicate that state-of-the-art coronary CT angiography can be used both to characterize the extent and composition of total coronary plaque burden and for plaque volume analysis of focal coronary lesions. The importance of total coronary plaque burden was highlighted recently by a study (31) whose results showed that diffuse nonobstructive coronary artery disease is associated with rates of cardiovascular death and myocardial infarction that are comparable with those of obstructive coronary artery disease. Therefore, the assessment of total coronary plaque at coronary CT angiography may be clinically relevant and enhance risk stratification.
The use of the latest-generation CT scanners with advanced iterative reconstruction and faster acquisition speeds in this study is a plausible contributing factor to the improved reproducibility of coronary CT angiography (32,33). Additionally, improvements in plaque measurement software with adaptive thresholds to differentiate plaque components can correct for the influence of luminal contrast material densities on plaque attenuation values and improve soft plaque detection (34). Importantly, with use of these state-of-the-art techniques, the scan-rescan reproducibility of coronary CT angiography also improved significantly compared with that in previous reports, which has major implications for future clinical trials assessing coronary plaque treatment response. Sample size estimates show that a reasonable sample is needed to detect a clinically significant treatment response in noncalcified plaque volume with coronary CT angiography. However, different-vendor follow-up requires substantially larger sample sizes (by a factor of two to three) for both lesion-based and vessel-based analysis. Indeed, intervendor variability, even with state-of-the-art equipment, seems to be the largest contributing factor to differences in plaque volume measurements at coronary CT angiography. A similar phenomenon has been observed for CAC scoring (35). Therefore, it is recommended to perform follow-up coronary CT angiography with the same CT system.
This study had several limitations. First, this was a single-center study with a relatively small sample size in which all examinations were performed in asymptomatic hyperlipidemic individuals according to a strict scan protocol. Multicenter studies inevitably lead to greater variability and therefore a larger sample size. We did not perform a direct comparison to intravascular US results, but prior studies have shown good correlation of coronary CT angiography findings with intravascular US findings (36). Additionally, we did not perform further subclassification of noncalcified plaque into fatty and fibrous components, as this has been shown to be less reliable and likely of less importance in clinically stable, asymptomatic patients. Owing to concerns about radiation exposure, we did not do baseline and follow-up scan assessment with the Siemens scanner; this was because the parent clinical trial was designed to perform baseline scanning with the Toshiba scanner. Finally, we compared only two specific CT scanners from two vendors as representative of state-of-the-art coronary CT angiography quality. Reconstruction kernels and coronary CT angiography acquisitions were optimized according to vendor instructions to achieve optimal image quality for each system rather than to obtain qualitative matched results. Hence, this study was not intended as a comparison between two vendors, and the results might not be applicable to other scanners or other plaque measurement software packages.
This study demonstrated low variation of coronary plaque volume assessment at state-of-the-art coronary CT angiography when the same CT vendor is used at baseline and for follow-up plaque assessment. Coronary CT angiography may be a noninvasive alternative to intravascular US for the reliable assessment of coronary plaque volume.
Advances in Knowledge
■ For coronary CT angiography, interreader and intrareader agreement for coronary plaque volume were highly reproducible with either of two CT scanners (eg, all intraclass correlation coefficients [ICCs] were ≥ 0.96 for total, calcified, and noncalcified plaque volumes).
■ Repeat assessment of coronary CT angiography plaque volumes showed excellent reproducibility when the same-vendor CT scanner was used at baseline and for follow-up scans (ICC, 0.948; coefficient of variation [COV], ±18.4%).
■ The use of a different CT vendor for baseline versus follow-up scans had lower reproducibility (ICC, 0.609; COV, ±29.9%).
Implications for Patient Care
■ State-of-the-art coronary CT angiography showed low scan-rescan variability, suggesting that the reproducibility of coronary CT angiography may be comparable to the previously described reproducibility of intravascular US for measurement of coronary plaque volume.
■ Differences in CT vendor technology were present, resulting in moderate variability in plaque volume measurements when different CT vendors are used at baseline and follow-up examinations.
SUPPLEMENTAL TABLE
SUPPLEMENTAL FIGURES
Received July 17, 2016; revision requested July 29; revision received August 5; accepted August 11; final version accepted August 26.
Supported by National Institutes of Health Intramural Research program (ZIACL090019, ZIAEB000072).
Disclosures of Conflicts of Interest: R.S. disclosed no relevant relationships. J.Z.M. disclosed no relevant relationships. C.O.W. disclosed no relevant relationships. A.P. Activities related to the present article: institution has a cooperative research and development agreement with Siemens. Activities not related to the present article: disclosed no relevant relationships. Other relationships: disclosed no relevant relationships. M.A.A. disclosed no relevant relationships. J.A.C.L. Activities related to the present article: has received grant support from Toshiba Medical. Activities not related to the present article: disclosed no relevant relationships. Other relationships: disclosed no relevant relationships. M.Y.C. Activities related to the present article: disclosed no relevant relationships. Activities not related to the present article: institution has a research agreement with Toshiba Medical. Other relationships: disclosed no relevant relationships. M.M. disclosed no relevant relationships. V.S. disclosed no relevant relationships. D.A.B. Activities related to the present article: disclosed no relevant relationships. Activities not related to the present article: institution has active research agreements with Siemens and Toshiba. Other relationships: disclosed no relevant relationships.
Abbreviations:
- BMI
- body mass index
- CAC
- coronary artery calcium
- CI
- confidence interval
- DLP
- dose-length product
- ICC
- intraclass correlation coefficient
- LAD
- left anterior descending
- LOA
- limit of agreement
- OCT
- optical coherence tomography
References
- 1.Sakakura K, Nakano M, Otsuka F, Ladich E, Kolodgie FD, Virmani R. Pathophysiology of atherosclerosis plaque progression. Heart Lung Circ 2013;22(6):399–411. [Published correction appears in Heart Lung Circ 2014;23(4):387.] [DOI] [PubMed] [Google Scholar]
- 2.Virmani R, Kolodgie FD, Burke AP, Farb A, Schwartz SM. Lessons from sudden coronary death: a comprehensive morphological classification scheme for atherosclerotic lesions. Arterioscler Thromb Vasc Biol 2000;20(5):1262–1275. [DOI] [PubMed] [Google Scholar]
- 3.Nicholls SJ, Hsu A, Wolski K, et al. Intravascular ultrasound-derived measures of coronary atherosclerotic plaque burden and clinical outcome. J Am Coll Cardiol 2010;55(21):2399–2407. [DOI] [PubMed] [Google Scholar]
- 4.Waller BF, Pinkerton CA, Slack JD. Intravascular ultrasound: a histological study of vessels during life—the new “gold standard” for vascular imaging. Circulation 1992;85(6):2305–2310. [DOI] [PubMed] [Google Scholar]
- 5.Prati F, Guagliumi G, Mintz GS, et al. Expert review document. II. Methodology, terminology and clinical applications of optical coherence tomography for the assessment of interventional procedures. Eur Heart J 2012;33(20):2513–2520. [DOI] [PMC free article] [PubMed] [Google Scholar]
- 6.Chatzizisis YS, George E, Cai T, et al. Accuracy and reproducibility of automated, standardized coronary transluminal attenuation gradient measurements. Int J Cardiovasc Imaging 2014;30(6):1181–1189. [DOI] [PMC free article] [PubMed] [Google Scholar]
- 7.Lee MS, Chun EJ, Kim KJ, Kim JA, Vembar M, Choi SI. Reproducibility in the assessment of noncalcified coronary plaque with 256-slice multi-detector CT and automated plaque analysis software. Int J Cardiovasc Imaging 2010;26(Suppl 2):237–244. [DOI] [PubMed] [Google Scholar]
- 8.Papadopoulou SL, Garcia-Garcia HM, Rossi A, et al. Reproducibility of computed tomography angiography data analysis using semiautomated plaque quantification software: implications for the design of longitudinal studies. Int J Cardiovasc Imaging 2013;29(5):1095–1104. [DOI] [PubMed] [Google Scholar]
- 9.Bossuyt PM, Reitsma JB, Bruns DE, et al. STARD 2015: an updated list of essential items for reporting diagnostic accuracy studies. Radiology 2015;277(3):826–832. [DOI] [PubMed] [Google Scholar]
- 10.Krauss B, Grant KL, Schmidt BT, Flohr TG. The importance of spectral separation: an assessment of dual-energy spectral separation for quantitative ability and dose efficiency. Invest Radiol 2015;50(2):114–118. [DOI] [PubMed] [Google Scholar]
- 11.Rodriguez K, Kwan AC, Lai S, et al. Coronary plaque burden at coronary CT angiography in asymptomatic men and women. Radiology 2015;277(1):73–80. [DOI] [PMC free article] [PubMed] [Google Scholar]
- 12.Boogers MJ, Broersen A, van Velzen JE, et al. Automated quantification of coronary plaque with computed tomography: comparison with intravascular ultrasound using a dedicated registration algorithm for fusion-based quantification. Eur Heart J 2012;33(8):1007–1016. [DOI] [PubMed] [Google Scholar]
- 13.Cerqueira MD, Weissman NJ, Dilsizian V, et al. Standardized myocardial segmentation and nomenclature for tomographic imaging of the heart: a statement for healthcare professionals from the Cardiac Imaging Committee of the Council on Clinical Cardiology of the American Heart Association. Circulation 2002;105(4):539–542. [DOI] [PubMed] [Google Scholar]
- 14.Miller JM, Dewey M, Vavere AL, et al. Coronary CT angiography using 64 detector rows: methods and design of the multi-centre trial CORE-64. Eur Radiol 2009;19(4):816–828. [DOI] [PMC free article] [PubMed] [Google Scholar]
- 15.Bland JM, Altman DG. Statistical methods for assessing agreement between two methods of clinical measurement. Lancet 1986;1(8476):307–310. [PubMed] [Google Scholar]
- 16.Bates D, Mächler M, Bolker B, Walker S. Fitting linear mixed-effects models using lme4. arXiv Prepr arXiv14065823. 2014. [Google Scholar]
- 17.Machin D, Campbell MJ, Tan SB, Tan SH. Sample size tables for clinical studies. Chichester, England: Wiley-Blackwell, 2011. [Google Scholar]
- 18.Altman DG. Practical statistics for medical research. Boca Raton, Fla: CRC, 1990. [Google Scholar]
- 19.Agatston AS, Janowitz WR, Hildner FJ, Zusmer NR, Viamonte M, Jr, Detrano R. Quantification of coronary artery calcium using ultrafast computed tomography. J Am Coll Cardiol 1990;15(4):827–832. [DOI] [PubMed] [Google Scholar]
- 20.Meyer M, Haubenreisser H, Schoepf UJ, et al. Closing in on the K edge: coronary CT angiography at 100, 80, and 70 kV—initial comparison of a second- versus a third-generation dual-source CT system. Radiology 2014;273(2):373–382. [DOI] [PubMed] [Google Scholar]
- 21.Nissen SE, Nicholls SJ, Sipahi I, et al. Effect of very high-intensity statin therapy on regression of coronary atherosclerosis: the ASTEROID trial. JAMA 2006;295(13):1556–1565. [DOI] [PubMed] [Google Scholar]
- 22.Nicholls SJ, Ballantyne CM, Barter PJ, et al. Effect of two intensive statin regimens on progression of coronary disease. N Engl J Med 2011;365(22):2078–2087. [DOI] [PubMed] [Google Scholar]
- 23.Achenbach S, Moselewski F, Ropers D, et al. Detection of calcified and noncalcified coronary atherosclerotic plaque by contrast-enhanced, submillimeter multidetector spiral computed tomography: a segment-based comparison with intravascular ultrasound. Circulation 2004;109(1):14–17. [DOI] [PubMed] [Google Scholar]
- 24.Leber AW, Becker A, Knez A, et al. Accuracy of 64-slice computed tomography to classify and quantify plaque volumes in the proximal coronary system: a comparative study using intravascular ultrasound. J Am Coll Cardiol 2006;47(3):672–677. [DOI] [PubMed] [Google Scholar]
- 25.Cheng VY, Nakazato R, Dey D, et al. Reproducibility of coronary artery plaque volume and composition quantification by 64-detector row coronary computed tomographic angiography: an intraobserver, interobserver, and interscan variability study. J Cardiovasc Comput Tomogr 2009;3(5):312–320. [DOI] [PubMed] [Google Scholar]
- 26.Galonska M, Ducke F, Kertesz-Zborilova T, Meyer R, Guski H, Knollmann FD. Characterization of atherosclerotic plaques in human coronary arteries with 16-slice multidetector row computed tomography by analysis of attenuation profiles. Acad Radiol 2008;15(2):222–230. [DOI] [PubMed] [Google Scholar]
- 27.Dohi T, Mintz GS, McPherson JA, et al. Non-fibroatheroma lesion phenotype and long-term clinical outcomes: a substudy analysis from the PROSPECT study. JACC Cardiovasc Imaging 2013;6(8):908–916. [DOI] [PubMed] [Google Scholar]
- 28.Dey D, Achenbach S, Schuhbaeck A, et al. Comparison of quantitative atherosclerotic plaque burden from coronary CT angiography in patients with first acute coronary syndrome and stable coronary artery disease. J Cardiovasc Comput Tomogr 2014;8(5):368–374. [DOI] [PubMed] [Google Scholar]
- 29.Lo J, Lu MT, Ihenachor EJ, et al. Effects of statin therapy on coronary artery plaque volume and high-risk plaque morphology in HIV-infected patients with subclinical atherosclerosis: a randomised, double-blind, placebo-controlled trial. Lancet HIV 2015;2(2):e52–e63. [DOI] [PMC free article] [PubMed] [Google Scholar]
- 30.Nicholls SJ, Tuzcu EM, Wolski K, et al. Coronary artery calcification and changes in atheroma burden in response to established medical therapies. J Am Coll Cardiol 2007;49(2):263–270. [DOI] [PubMed] [Google Scholar]
- 31.Bittencourt MS, Hulten E, Ghoshhajra B, et al. Prognostic value of nonobstructive and obstructive coronary artery disease detected by coronary computed tomography angiography to identify cardiovascular events. Circ Cardiovasc Imaging 2014;7(2):282–291. [DOI] [PubMed] [Google Scholar]
- 32.Donnino R, Jacobs JE, Doshi JV, et al. Dual-source versus single-source cardiac CT angiography: comparison of diagnostic image quality. AJR Am J Roentgenol 2009;192(4):1051–1056. [DOI] [PubMed] [Google Scholar]
- 33.Wang R, Schoepf UJ, Wu R, et al. Diagnostic accuracy of coronary CT angiography: comparison of filtered back projection and iterative reconstruction with different strengths. J Comput Assist Tomogr 2014;38(2):179–184. [DOI] [PubMed] [Google Scholar]
- 34.Dalager MG, Bøttcher M, Andersen G, et al. Impact of luminal density on plaque classification by CT coronary angiography. Int J Cardiovasc Imaging 2011;27(4):593–600. [DOI] [PubMed] [Google Scholar]
- 35.Willemink MJ, Vliegenthart R, Takx RA, et al. Coronary artery calcification scoring with state-of-the-art CT scanners from different vendors has substantial effect on risk classification. Radiology 2014;273(3):695–702. [DOI] [PubMed] [Google Scholar]
- 36.Park HB, Lee BK, Shin S, et al. Clinical feasibility of 3D automated coronary atherosclerotic plaque quantification algorithm on coronary computed tomography angiography: comparison with intravascular ultrasound. Eur Radiol 2015;25(10):3073–3083. [DOI] [PubMed] [Google Scholar]
- 37.Lee CW, Kang SJ, Ahn JM, et al. Comparison of effects of atorvastatin (20 mg) versus rosuvastatin (10 mg) therapy on mild coronary atherosclerotic plaques (from the ARTMAP trial). Am J Cardiol 2012;109(12):1700–1704. [DOI] [PubMed] [Google Scholar]
- 38.Burgstahler C, Reimann A, Beck T, et al. Influence of a lipid-lowering therapy on calcified and noncalcified coronary plaques monitored by multislice detector computed tomography: results of the New Age II Pilot Study. Invest Radiol 2007;42(3):189–195. [DOI] [PubMed] [Google Scholar]
- 39.Zeb I, Li D, Nasir K, et al. Effect of statin treatment on coronary plaque progression: a serial coronary CT angiography study. Atherosclerosis 2013;231(2):198–204. [DOI] [PubMed] [Google Scholar]
Associated Data
This section collects any data citations, data availability statements, or supplementary materials included in this article.


