Pulse wave imaging can be used to assess the stability of murine aortic aneurysms noninvasively by measuring the homogeneity of pulse wave propagation within the aneurysm sac.
Abstract
Purpose
To assess whether the stability of murine aortic aneurysms is associated with the homogeneity of pulse wave propagation within the saccular wall.
Materials and Methods
All animal procedures were approved by the institutional Animal Care and Use Committee. Apolipoprotein E and tissue inhibitor of metalloproteinases-1 knockout mice (n = 26) were infused with angiotensin II by using subcutaneously implanted osmotic pumps, with an additional control mouse used for histologic examination (n = 1). Pulse wave imaging (PWI) was performed just before infusion and 15 days after infusion by using 40-MHz ultrasonography at 8000 frames per second (with electrocardiographic gating). Aneurysm appearance on B-mode images was monitored every 2–3 days for 30 days. On the basis of B-mode images obtained after 30 days, aneurysms were deemed to have been unstable if they had ruptured; otherwise, they were deemed stable. Statistical significance was assessed by using two-tailed t tests.
Results
In normal aortas, the pulse waves propagated at relatively constant velocities (mean ± standard deviation, 2.8 m/sec ± 0.9). Fifteen days after infusion, all mice had developed aneurysms, with significant (P < .001/12) changes in maximum anterior-posterior diameter (increase of 54.9% ± 2.5) and pulse wave velocity (PWV) (decrease of 1.3 m/sec ± 0.8). While there was no significant difference in these parameters (P = .45 for diameter and P = .55 for PWV) between stable aneurysms (n = 12) and unstable aneurysms (n = 14), the standard deviation of the high-resolution PWV was significantly higher (P < .001/12) in unstable aneurysms (5.7 m/sec ± 1.6) than in stable ones (3.2 m/sec ± 0.9).
Conclusion
High-resolution PWI was used to measure the local homogeneity of pulse wave propagation within the saccular wall, which is lower in unstable aneurysms than in stable ones. Hence, if proven to add additional information beyond size and appearance in human studies, PWI could potentially be used to assess the stability of aneurysms by providing information that is complementary to the anatomic data obtained with conventional B-mode imaging.
© RSNA, 2016
Online supplemental material is available for this article.
Introduction
The abdominal aortic aneurysm (AAA) is a common vascular disease that causes more than 150 000 new cases and 10 000 deaths annually in the United States (1,2). AAA is typically caused by a localized weakness in the vessel wall, which induces dilation or ballooning in the abdominal aorta and results in the formation of an aneurysmal sac (3). The main cause of AAA-induced death is severe internal hemorrhaging after a rupture in the saccular wall. Even with prompt medical intervention, more than 85% of AAA ruptures are fatal, and 50% of individuals that experience a rupture die before even reaching the hospital (4,5).
Once AAA is identified, the available treatment options are open surgery and endovascular repair (6). Because both of these procedures carry some risk to the patient, they are only performed when the likelihood of AAA rupture is deemed to be greater than the risks associated with the treatment itself (4), which are particularly high in the case of abdominal surgery (7). In current clinical practice, the risk of AAA rupture is assessed on the basis of maximum anterior-posterior (AP) diameter of the aneurysm (2,8). However, studies have shown that this criterion is poor in the prediction of disease outcome. Many smaller aneurysms that do rupture are not identified with this method (6,9,10), while patients with larger but stable aneurysms are subjected to potentially unnecessary surgical intervention (8).
In several studies, investigators have suggested that a better means of assessing rupture risk is to measure localized changes in the material and mechanical properties of the vessel (11–13). The standard measure of arterial stiffness in current clinical practice is pulse wave velocity (PWV) (14–16). At the start of every cardiac cycle, the blood that originates from the left ventricle of the heart generates a pulse that then propagates throughout the arterial tree, which in turn induces a displacement wave in the walls of the vessel (17). PWV has been shown to be an effective biomarker of all-cause and cardiovascular disease–related mortality, particularly in hypertensive patients (11,13,18).
Pulse wave imaging (PWI) is a noninvasive ultrasonography (US)–based technique for visualizing and tracking the propagation of pulse waves along the arterial wall at high spatial and temporal resolutions (19,20). The purpose of this study was to assess whether the stability of murine aortic aneurysms is associated with the homogeneity of pulse wave propagation within the saccular wall.
Materials and Methods
Animal Model
All procedures were approved by the institutional Animal Care and Use Committee of Columbia University (protocol no. AC-AAAI5750). Twenty-seven male apolipoprotein E and tissue inhibitor of metalloproteinases-1 knockout mice were used in this study. This sample size was chosen to obtain a statistical power of 0.9, based on an anticipated effect size of 1.4 (Cohen d) observed in previous work conducted by the authors (19) with the same animal model. One mouse was retained solely as a control for histologic examination, while the other 26 mice were infused with angiotensin II (A9525; Sigma-Aldrich, St Louis, Mo) for 30 days via subcutaneously implanted osmotic pumps (Alzet Model 2004; Durect, Cupertino, Calif). This animal model of AAA disease is known to produce aneurysms that share several characteristics with human diseased tissue, including inflammation, dilation of the lumen, degeneration of the medial wall, and the formation of a thrombus (7,21,22). The mechanisms that underlie this model have been explored in other studies (7,22), although some aspects are not completely understood.
Seven mice received a dose of 2.2 mg of angiotensin II per kilogram of body mass per day, while the remaining mice (n = 19) received 4.4 mg per kilogram of body mass per day. These doses are higher than those in previously reported studies (7,21,23) to increase the likelihood of aneurysm rupture events. This is based on the aforementioned previous study by Nandlall et al (19) by using the same animal model and doses of angiotensin II, in which 10 mice developed aneurysms and three mice experienced rupture events. In this study, the distribution of mice and dosages was chosen with the aim of obtaining a rate of aneurysm rupture of approximately 50% by the end of the observation period.
In the aforementioned study, all ruptures occurred before 30 days of angiotensin II infusion had passed. The remaining mice (n = 7) survived for 90 days; by the end of this period, all seven aneurysms were still present, and no ruptures had occurred. On the basis of these observations, in the present study, aneurysms that ruptured within 30 days of infusion were categorized as unstable, and those that were intact after 30 days were deemed stable.
Imaging
PWI was performed over a 12 × 12-mm field of view by using a Vevo 770 imager with an RMV-704 single-element probe (VisualSonics, Toronto, Ontario, Canada), which had a center frequency of 40 MHz, a focal length of 6 mm, and a lateral resolution of 80 μm. Excluding setup time, each acquisition took approximately 7 minutes to complete. During imaging, each mouse was anesthetized with a mixture of 2% isoflurane (AErrane; Baxter Health Care, Deerfield, Ill) and pure oxygen (Tech Air, White Plains, NY), administered via inhalation by using an isoflurane vaporizer (Model 100; SurgiVet, Waukesha, Wis). The mouse was then placed in a supine position on a heated platform to maintain its body temperature at approximately 37°C. Abdominal fur was removed with a shaver and depilatory cream. Degassed US gel (Aquasonic 100; Parker Laboratories, Fairfield, NJ) was used as a coupling medium.
Throughout the acquisition, the electrocardiogram (ECG) for each mouse was monitored with a THM-100 system (Indus Instruments, Webster, Tex). The radiofrequency signals from the US machine, as well as the ECG signal, were recorded by using a Gage CompuScope 14200 data acquisition card (Dynamic Signals, Montreal, Quebec, Canada) at a sampling frequency of 200 MHz and a resolution of 14 bits per sample. PWI acquisitions were performed in the suprarenal section of the abdominal aorta. The Vevo 770 imager (VisualSonics) was operated in the manufacturer’s ECG-gated kilohertz visualization mode at an effective frame rate of 8 kHz.
Study Timeline
Each of the 26 mice that received angiotensin II was monitored every 2–3 days by using B-mode imaging, beginning 1 day prior to angiotensin II infusion (day 0) and ending 30 days after the start of infusion (day 30). PWI acquisitions were also performed on days 0 and 15. All imaging was performed by the first author (S.D.N.), who had 3 years of experience in small-animal US imaging. An aneurysm was deemed to have developed if a localized increase of at least 50% in the inner maximum AP diameter of the vessel was present (24,25); this occurred for all 26 mice between days 10 and 15.
In 14 of the mice that received 4.4 mg of angiotensin II per kilogram of body mass per day, the aneurysms ruptured between days 17 and 22; these cases were therefore classified as unstable. The aneurysms in the remaining 12 mice were still present at the end of the study period and were thus deemed to be stable. Eight of the mice with unstable aneurysms died before the end of the study period, although in all cases, the rupture was confirmed with at least one B-mode image. The other 18 mice that survived the full length of the study were sacrificed after day 31 (the day after the last B-mode image was obtained).
Histologic Examination
Histologic examination was performed on the aortas of the 18 sacrificed mice, as well as on the aorta of the control mouse that was not given angiotensin II. During histologic examination, the abdominal section of each aorta (from the diaphragm to just before the bifurcation) was removed, cleaned, and fixed in 4% (wt/vol) formaldehyde within the first hour after euthanasia. The fixed tissue was then embedded in paraffin and sectioned transversely at a thickness of 10 μm. Several sections per tissue sample were stained with hematoxylin-eosin and were visualized with an inverted microscope (IX-81; Olympus, Melville, NY). To ensure that any breaks seen in the wall were caused by vessel damage, sections were not obtained near blood vessels that branched off from the aorta or near the edges of the excised segments (so as to not observe damage from the scalpel used to remove the aorta).
Data Analysis
All data were processed by using Matlab version R2014b software (The Mathworks, Natick, Mass). Axial displacements were estimated by using a fast one-dimensional normalized cross-correlation method (26) with a correlation window size of 431 μm (approximately seven acoustic wavelengths) and an offset between successive windows of 7.7 μm (exactly one sample). The estimated displacements were filtered with a five-point (575-μm) one-dimensional median filter and a 15 × 15-point (1.725-mm × 1.875-msec) two-dimensional Savitzky-Golay filter. Regions in which the correlation coefficient associated with the displacement estimation was less than 0.9 (indicating poor quality) were cropped out of the images; these occurred along the borders of the field of view and in locations where the B-mode image was also noisy. These did not occur in the region of interest around the aorta, since the B-mode image was focused in that area before acquiring the PWI data. In the animal model used in this study, aneurysms only form on the anterior wall of the aorta (the top wall in all Figures herein), typically near the superior mesenteric or celiac arteries (7,23). For this reason, only the anterior wall was analyzed with PWI.
To track the pulse wave, the lateral position axis of each acquisition (corresponding to the longitudinal axis of the aorta) was aligned such that the superior mesenteric artery appeared at a position of 8 mm on the B-mode image. The anterior wall was segmented by using the B-mode image. The peak of the wall displacement profile at each spatial location was found by computing the time at which the highest incremental wall displacement occurred (20,21,27). The foot was then defined as the time of occurrence of the smallest incremental wall displacement before the peak. Finally, the 50% upstroke point was defined as the time between the foot and the peak at which the wall displacement was closest to the mean of its values at the foot and peak (20,21). The maximum AP diameter and vessel wall were manually traced (by S.D.N.) for each case by using the first B-mode frame. Since tracing occurred shortly after each acquisition and the final state of the mouse (stable AAA or unstable AAA) was not known until after both PWI acquisitions, this step was performed while effectively blinded to the AAA state. Plotting the 50% upstroke time points along the length of the vessel wall and performing a linear regression on these time-distance pairs yielded the PWV. In cases where two or more consecutive marker locations corresponded to the same time point, the mean of these locations was selected.
Statistical Analysis
All statistical analysis was performed by using Matlab version R2014b software (Mathworks). Statistical significance was assessed by using two-tailed t tests for either paired or unpaired samples, with the paired test being used if the groups being compared contained the same mice at different time points and the unpaired test with unequal variances being used otherwise. P values of less than .0042 (.05/12 = .0042, where 12 is the Bonferroni correction factor) were considered to indicate a statistically significant difference. Effect size was quantified by using Cohen d.
Results
Figure 1 illustrates the pulse wave propagation in three representative cases: a normal mouse with no AAA disease on day 0 (prior to receiving any angiotensin II), one of the mice with a stable aneurysm on day 15 (15 days after angiotensin II infusion), and a mouse with an unstable aneurysm, also on day 15. The corresponding videos of the wave propagation are available online (Movie E1 [online]). The displacements induced by the pulse waves are overlaid on the B-mode images of the vessels, which also show the locations of the aneurysms in the diseased cases.
Figure 1a:
US images show pulse wave propagation as the wave enters (left column), crosses (middle column), and exits (right column) the field of view in the abdominal aortas of (a) a normal mouse with no AAA disease, (b) a mouse with a stable aneurysm, and (c) a mouse with an unstable aneurysm that ruptured between 18 and 20 days after the start of angiotensin II infusion. The normal mouse was imaged the day before angiotensin II infusion started, while the mice with AAA were imaged after 15 days of angiotensin II infusion (and before it was known whether the aneurysm would rupture or not). The color overlay on the B-mode images represents the axial wall displacement induced by the pulse wave, while the arrow indicates the lateral position of the wave (ie, along the longitudinal axis of the aorta). The time stamp in each frame indicates the time elapsed since the start of the cardiac cycle (ie, the R wave of the ECG signal). The lateral position axes of all three fields of view are aligned such that the superior mesenteric artery appears at approximately 8 mm.
Figure 1b:
US images show pulse wave propagation as the wave enters (left column), crosses (middle column), and exits (right column) the field of view in the abdominal aortas of (a) a normal mouse with no AAA disease, (b) a mouse with a stable aneurysm, and (c) a mouse with an unstable aneurysm that ruptured between 18 and 20 days after the start of angiotensin II infusion. The normal mouse was imaged the day before angiotensin II infusion started, while the mice with AAA were imaged after 15 days of angiotensin II infusion (and before it was known whether the aneurysm would rupture or not). The color overlay on the B-mode images represents the axial wall displacement induced by the pulse wave, while the arrow indicates the lateral position of the wave (ie, along the longitudinal axis of the aorta). The time stamp in each frame indicates the time elapsed since the start of the cardiac cycle (ie, the R wave of the ECG signal). The lateral position axes of all three fields of view are aligned such that the superior mesenteric artery appears at approximately 8 mm.
Figure 1c:
US images show pulse wave propagation as the wave enters (left column), crosses (middle column), and exits (right column) the field of view in the abdominal aortas of (a) a normal mouse with no AAA disease, (b) a mouse with a stable aneurysm, and (c) a mouse with an unstable aneurysm that ruptured between 18 and 20 days after the start of angiotensin II infusion. The normal mouse was imaged the day before angiotensin II infusion started, while the mice with AAA were imaged after 15 days of angiotensin II infusion (and before it was known whether the aneurysm would rupture or not). The color overlay on the B-mode images represents the axial wall displacement induced by the pulse wave, while the arrow indicates the lateral position of the wave (ie, along the longitudinal axis of the aorta). The time stamp in each frame indicates the time elapsed since the start of the cardiac cycle (ie, the R wave of the ECG signal). The lateral position axes of all three fields of view are aligned such that the superior mesenteric artery appears at approximately 8 mm.
Movie 1a:
Cine loops of pulse wave propagation for the mice in Figure 1 show the abdominal aortas of (a) a normal mouse with no AAA disease, (b) a mouse with a stable aneurysm, and (c) a mouse with an unstable aneurysm that ruptured between 18 and 20 days after the start of angiotensin II infusion. The color overlay on the B-mode images represents the axial wall displacement induced by the pulse wave, while the time stamp in each frame indicates the time elapsed since the start of the cardiac cycle (ie, the R wave of the ECG signal).
Movie 1b:
Cine loops of pulse wave propagation for the mice in Figure 1 show the abdominal aortas of (a) a normal mouse with no AAA disease, (b) a mouse with a stable aneurysm, and (c) a mouse with an unstable aneurysm that ruptured between 18 and 20 days after the start of angiotensin II infusion. The color overlay on the B-mode images represents the axial wall displacement induced by the pulse wave, while the time stamp in each frame indicates the time elapsed since the start of the cardiac cycle (ie, the R wave of the ECG signal).
Movie 1c:
Cine loops of pulse wave propagation for the mice in Figure 1 show the abdominal aortas of (a) a normal mouse with no AAA disease, (b) a mouse with a stable aneurysm, and (c) a mouse with an unstable aneurysm that ruptured between 18 and 20 days after the start of angiotensin II infusion. The color overlay on the B-mode images represents the axial wall displacement induced by the pulse wave, while the time stamp in each frame indicates the time elapsed since the start of the cardiac cycle (ie, the R wave of the ECG signal).
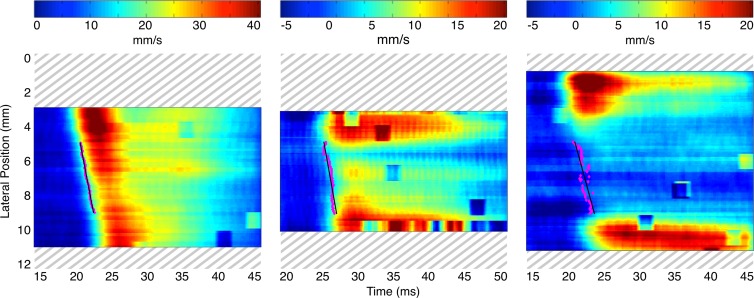
Spatiotemporal maps of the pulse wave propagation for the same three mice are shown in Figure 2. On these maps, the wall displacements are estimated over time along the entire length of the vessel wall. The 50% upstroke markers and corresponding linear regressions are also overlaid on each map between 5 mm and 9 mm. In all mice, this segment either encompasses the aneurysmal sac or corresponds to the vessel segment in which an aneurysm eventually developed. Hence, the slope of each linear regression corresponds to the PWV. As on the B-mode images, there is a discernible difference between the spatiotemporal pulse wave propagation map associated with the normal aorta and the maps associated with the AAA cases. In the normal aortas, the wave propagates more uniformly and smoothly than in the aneurysmal ones. In addition, there is a marked reduction in the displacement amplitude within the walls of the aneurysm sacs, although it is still possible to track the pulse wave through this area. However, there appears to be no discernible qualitative difference between the spatiotemporal wave propagation patterns for the stable and unstable aneurysms.
Figure 2:
Spatiotemporal maps of pulse wave propagation for the same mice as in Figure 1 show an aorta with no abnormalities (left), an aorta with a stable aneurysm (middle), and an aorta with an unstable aneurysm (right). Some regions along the borders of the field of view were cropped owing to poor displacement estimation (correlation coefficients of less than 0.9). The 50% upstroke markers and corresponding linear regressions are shown in a 4-mm-long window that spans lateral positions from 5 mm to 9 mm, which fall within the sacs of the aneurysms when these are present. The slope of each linear regression corresponds to the PWV. The normal case has the highest PWV (2.27 m/sec), while PWV is lower in the stable AAA (2.07 m/sec) and lowest in the unstable AAA (1.79 m/sec).
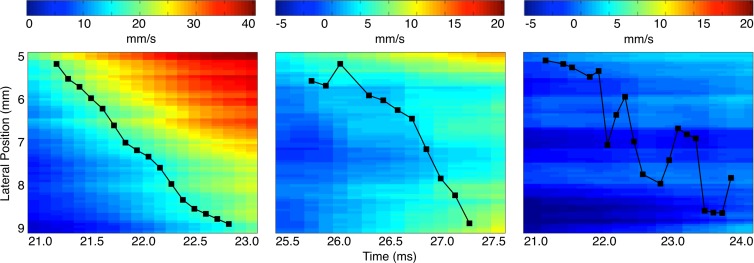
Figure 3 presents a high-resolution comparison of pulse wave propagation within the 5–9-mm segment in the three example cases by displaying the location of the 50% upstroke points every 125 µsec (ie, every frame) after the wave first reaches the start of the segment at 5 mm. Hence, the slope between any pair of successive markers provides a localized estimate of the PWV between these two points at the highest possible spatial resolution. Figure 3 illustrates that the local PWVs in the unstable example exhibit greater variation and attain more extreme values compared with the stable example, while in the normal example, the local PWVs do not vary as much.
Figure 3:
Comparison of pulse wave propagation in the 5–9-mm segments of the spatiotemporal maps in Figure 2 shows an aorta with no abnormalities (left), an aorta with a stable aneurysm (middle), and an aorta with an unstable aneurysm (right). In cases where two or more consecutive marker locations corresponded to the same time point, the mean of these locations was selected. The slopes of the lines drawn between successive markers thus provide localized estimates of the PWV at the highest possible spatial resolution.
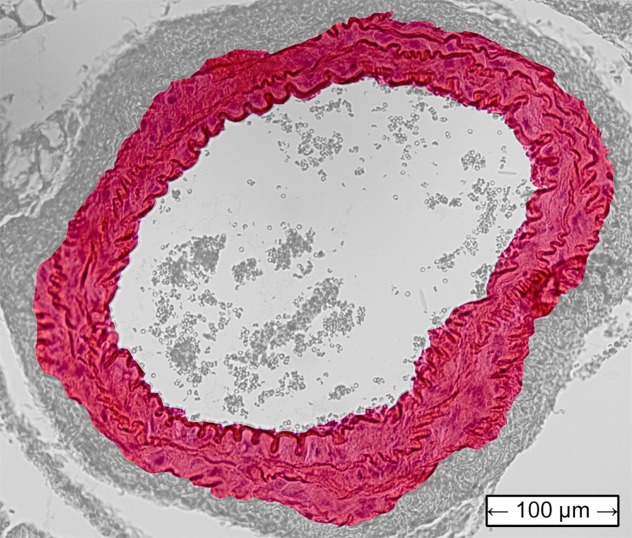
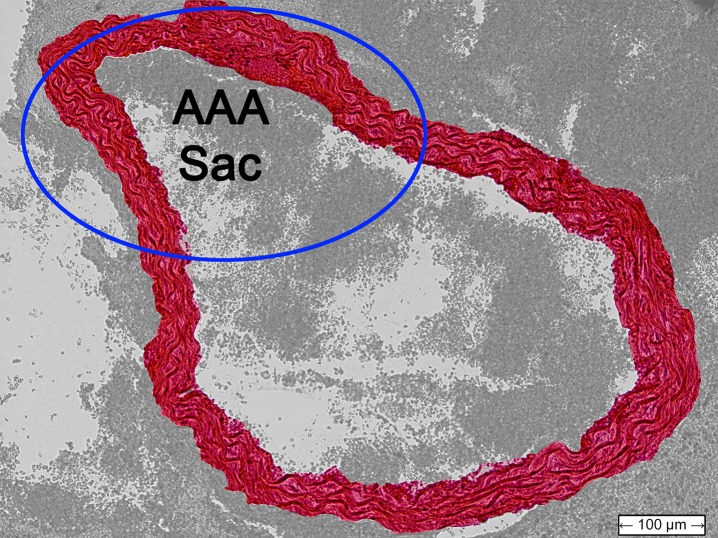
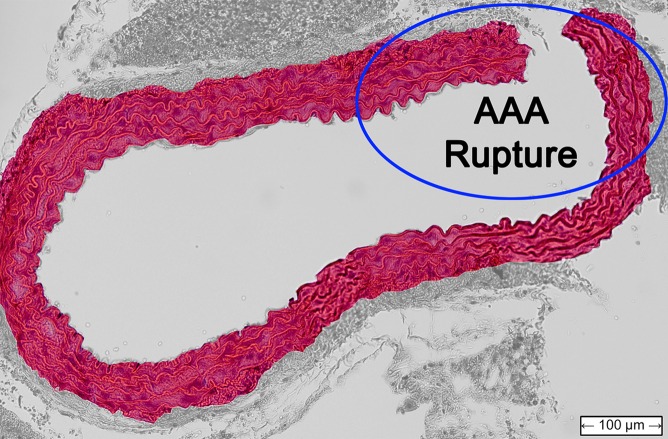
Figure 4 shows histologic sections obtained from the abdominal aortas of the normal mouse, as well as the examples of AAA mice shown previously. The latter two images confirmed the presence of AAA disease, with the image for the unstable case also indicating the location of the rupture.
Figure 4a:
Transverse histologic sections stained with hematoxylin-eosin (original magnification, ×10) from (a) the normal mouse that did not receive angiotensin II, (b) the stable AAA mouse, and (c) the unstable AAA mouse shown in Figures 1–3.
Figure 4b:
Transverse histologic sections stained with hematoxylin-eosin (original magnification, ×10) from (a) the normal mouse that did not receive angiotensin II, (b) the stable AAA mouse, and (c) the unstable AAA mouse shown in Figures 1–3.
Figure 4c:
Transverse histologic sections stained with hematoxylin-eosin (original magnification, ×10) from (a) the normal mouse that did not receive angiotensin II, (b) the stable AAA mouse, and (c) the unstable AAA mouse shown in Figures 1–3.
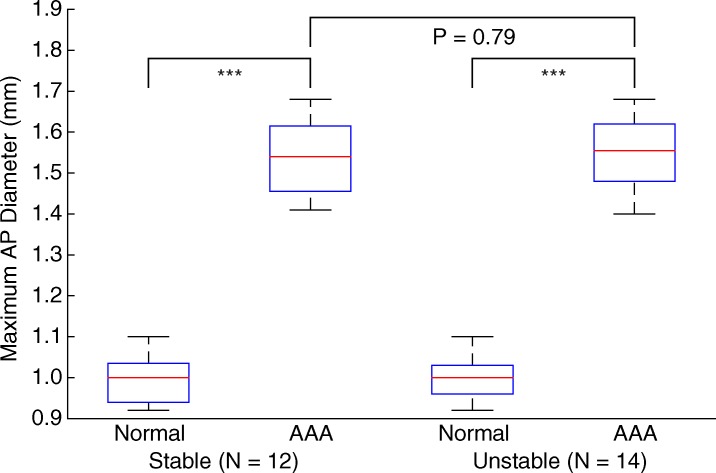
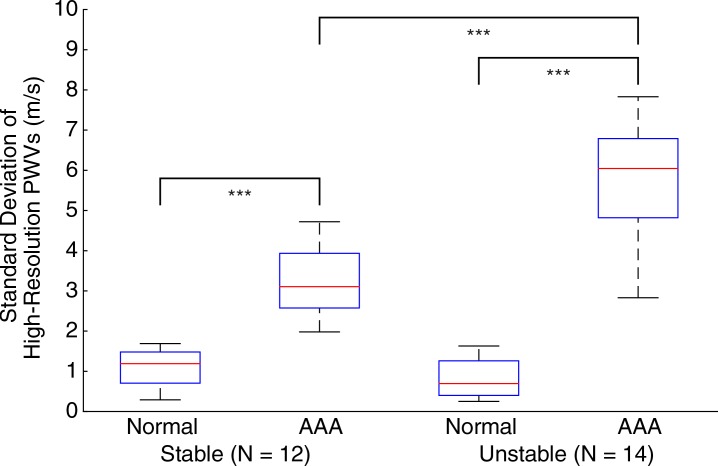
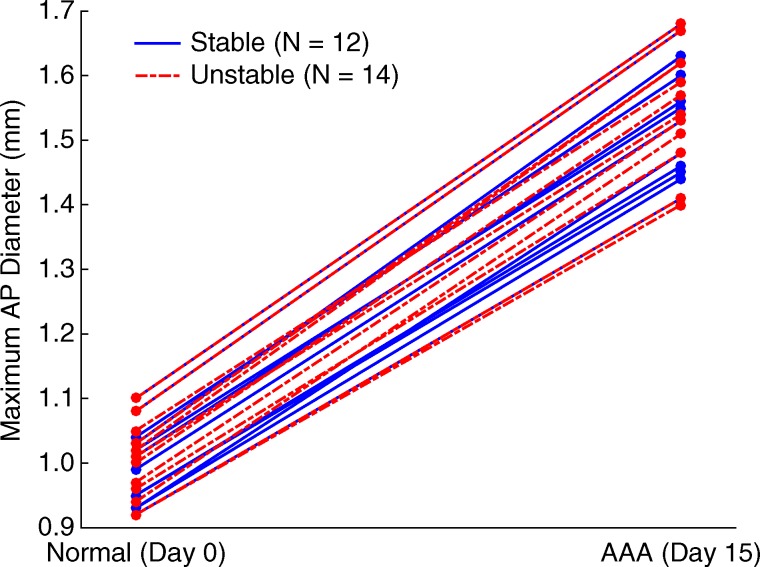
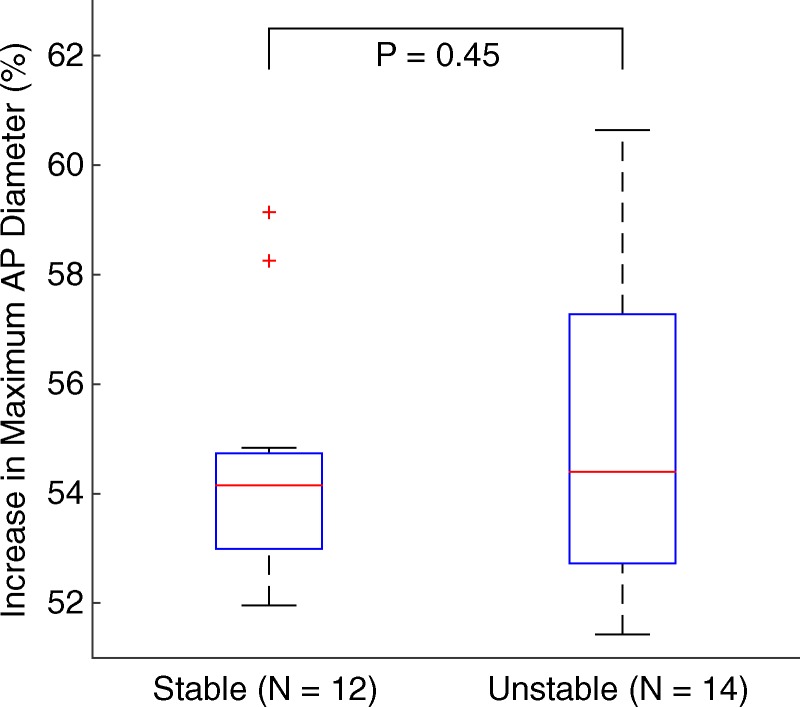
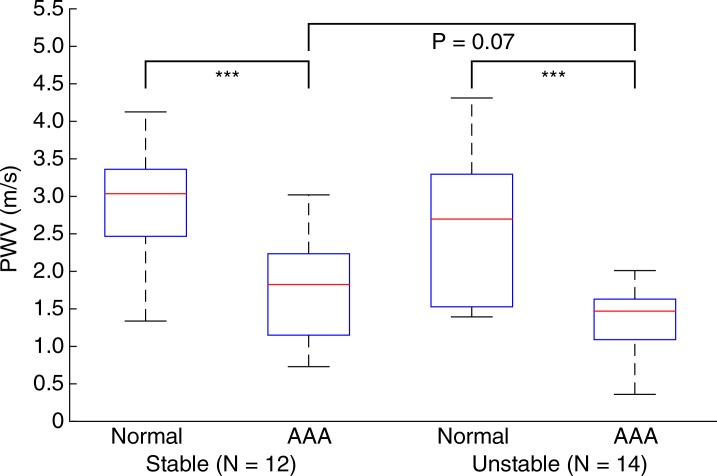
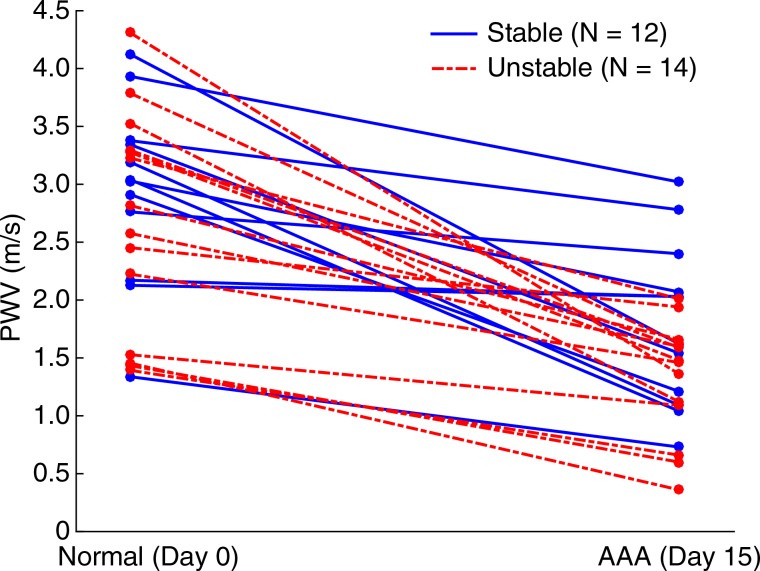
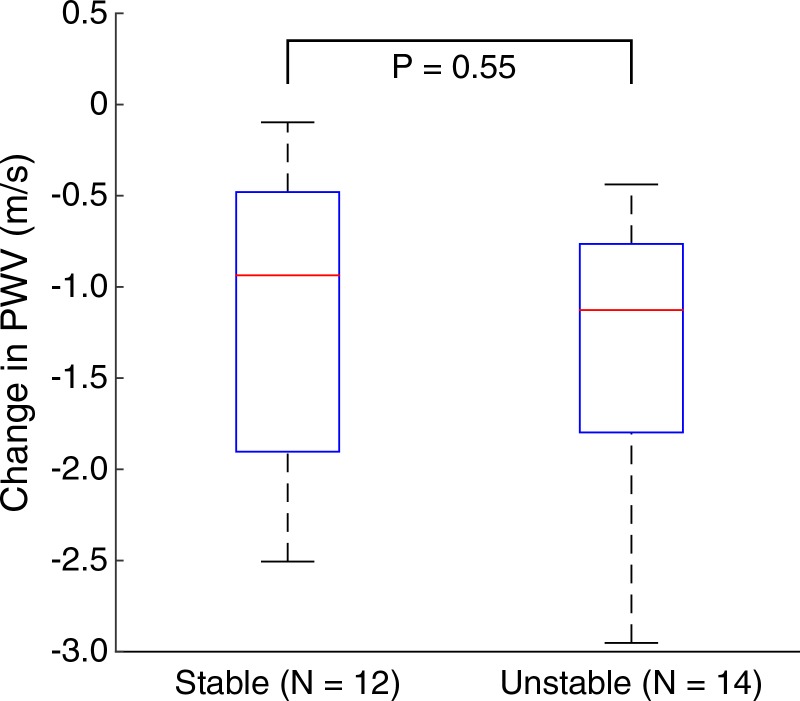
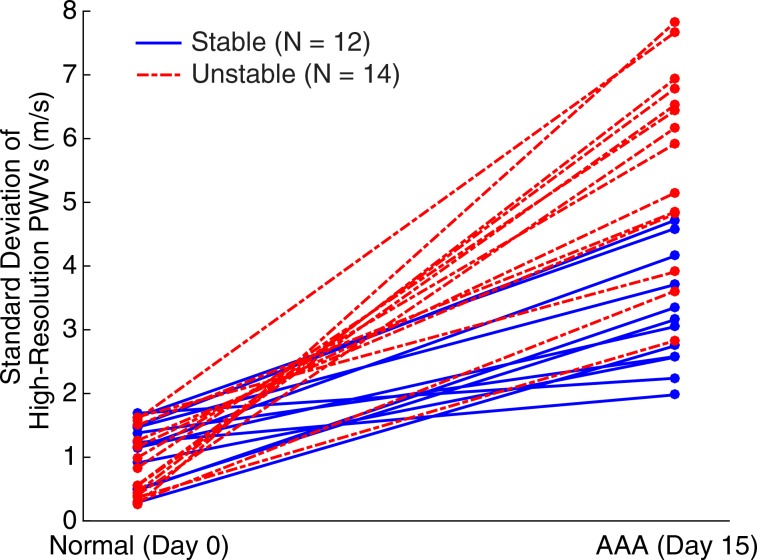
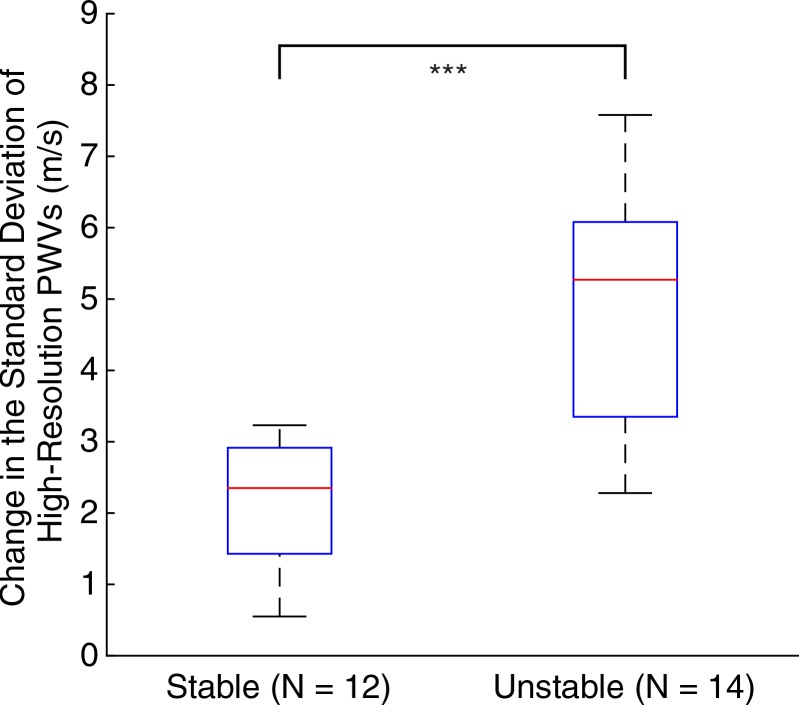
Figures 5–7 show quantitative comparisons between three parameters in all normal, stable AAA, and unstable AAA mice in the study: the maximum AP diameter at the start of the cardiac cycle (ie, at the peak of the R wave), the PWV within the 4-mm window from 5 mm to 9 mm, and the standard deviation of the high-resolution PWVs within this segment. The normal data were obtained on day 0 and are compared with the AAA categories by using paired t tests, while the stable and unstable AAA data were obtained on day 15 and were compared with each other by using an unpaired t test (since the two groups contain different mice). All three parameters were found to change significantly within the aneurysmal sacs compared with their values prior to angiotensin II infusion. However, neither the maximum AP diameter (P = .79 for groups and P = .45 for individuals) nor the PWV (P = .07 for groups and P = .55 for individuals) were found to be statistically significant in distinguishing stable aneurysms from unstable ones. Instead, the data indicated that the standard deviation of the high-resolution PWVs is a significant differentiator between these two groups, both at the group level (3.2 m/sec ± 0.9 for the stable aneurysms vs 5.7 m/sec ± 1.6 for the unstable aneurysms, P < .001/12, Cohen d = 1.9) and for individual mice (P < .001/12, Cohen d = 2.0).
Figure 5a:
Group data regarding maximum AP diameter of the vessel for all mice in the study. (a) Box and whisker plot of subgroup means and standard deviations, (b) parallel coordinate plot of the normal baseline and AAA measurements for each mouse, and (c) box and whisker plot of the change in each mouse after AAA development, relative to their individual normal baseline values, are shown. The normal baseline data were acquired the day before angiotensin II infusion started (day 0), while the AAA data were acquired after 15 days of angiotensin II infusion (day 15). *** = P < .001/12, where 12 is the Bonferroni correction factor.
Figure 7a:
Group data regarding standard deviation of the high-resolution PWV measurements for all mice in the study, measured across the entire 4-mm window from 5 mm to 9 mm. (a) Box and whisker plot of subgroup means and standard deviations, (b) parallel coordinate plot of the normal baseline and AAA measurements for each mouse, and (c) box and whisker plot of the change in each mouse after AAA development, relative to their individual normal baseline values, are shown. The normal baseline data were acquired the day before angiotensin II infusion started (day 0), while the AAA data were acquired after 15 days of angiotensin II infusion (day 15). *** = P < .001/12, where 12 is the Bonferroni correction factor.
Figure 5b:
Group data regarding maximum AP diameter of the vessel for all mice in the study. (a) Box and whisker plot of subgroup means and standard deviations, (b) parallel coordinate plot of the normal baseline and AAA measurements for each mouse, and (c) box and whisker plot of the change in each mouse after AAA development, relative to their individual normal baseline values, are shown. The normal baseline data were acquired the day before angiotensin II infusion started (day 0), while the AAA data were acquired after 15 days of angiotensin II infusion (day 15). *** = P < .001/12, where 12 is the Bonferroni correction factor.
Figure 5c:
Group data regarding maximum AP diameter of the vessel for all mice in the study. (a) Box and whisker plot of subgroup means and standard deviations, (b) parallel coordinate plot of the normal baseline and AAA measurements for each mouse, and (c) box and whisker plot of the change in each mouse after AAA development, relative to their individual normal baseline values, are shown. The normal baseline data were acquired the day before angiotensin II infusion started (day 0), while the AAA data were acquired after 15 days of angiotensin II infusion (day 15). *** = P < .001/12, where 12 is the Bonferroni correction factor.
Figure 6a:
Group data regarding spatially averaged PWV for all mice in the study. PWV for each mouse was obtained by performing a linear regression across the entire 4-mm window from 5 mm to 9 mm. (a) Box and whisker plot of subgroup means and standard deviations, (b) parallel coordinate plot of the normal baseline and AAA measurements for each mouse, and (c) box and whisker plot of the change in each mouse after AAA development, relative to their individual normal baseline, are shown. The normal baseline data were acquired the day before angiotensin II infusion started (day 0), while the AAA data were acquired after 15 days of angiotensin II infusion (day 15). *** = P < .001/12, where 12 is the Bonferroni correction factor.
Figure 6b:
Group data regarding spatially averaged PWV for all mice in the study. PWV for each mouse was obtained by performing a linear regression across the entire 4-mm window from 5 mm to 9 mm. (a) Box and whisker plot of subgroup means and standard deviations, (b) parallel coordinate plot of the normal baseline and AAA measurements for each mouse, and (c) box and whisker plot of the change in each mouse after AAA development, relative to their individual normal baseline, are shown. The normal baseline data were acquired the day before angiotensin II infusion started (day 0), while the AAA data were acquired after 15 days of angiotensin II infusion (day 15). *** = P < .001/12, where 12 is the Bonferroni correction factor.
Figure 6c:
Group data regarding spatially averaged PWV for all mice in the study. PWV for each mouse was obtained by performing a linear regression across the entire 4-mm window from 5 mm to 9 mm. (a) Box and whisker plot of subgroup means and standard deviations, (b) parallel coordinate plot of the normal baseline and AAA measurements for each mouse, and (c) box and whisker plot of the change in each mouse after AAA development, relative to their individual normal baseline, are shown. The normal baseline data were acquired the day before angiotensin II infusion started (day 0), while the AAA data were acquired after 15 days of angiotensin II infusion (day 15). *** = P < .001/12, where 12 is the Bonferroni correction factor.
Figure 7b:
Group data regarding standard deviation of the high-resolution PWV measurements for all mice in the study, measured across the entire 4-mm window from 5 mm to 9 mm. (a) Box and whisker plot of subgroup means and standard deviations, (b) parallel coordinate plot of the normal baseline and AAA measurements for each mouse, and (c) box and whisker plot of the change in each mouse after AAA development, relative to their individual normal baseline values, are shown. The normal baseline data were acquired the day before angiotensin II infusion started (day 0), while the AAA data were acquired after 15 days of angiotensin II infusion (day 15). *** = P < .001/12, where 12 is the Bonferroni correction factor.
Figure 7c:
Group data regarding standard deviation of the high-resolution PWV measurements for all mice in the study, measured across the entire 4-mm window from 5 mm to 9 mm. (a) Box and whisker plot of subgroup means and standard deviations, (b) parallel coordinate plot of the normal baseline and AAA measurements for each mouse, and (c) box and whisker plot of the change in each mouse after AAA development, relative to their individual normal baseline values, are shown. The normal baseline data were acquired the day before angiotensin II infusion started (day 0), while the AAA data were acquired after 15 days of angiotensin II infusion (day 15). *** = P < .001/12, where 12 is the Bonferroni correction factor.
Discussion
In agreement with previous work (19–21), the differences between aneurysm sacs and normal tissue are easily detected with PWI. From a qualitative perspective, the pulse waves propagate less uniformly in aneurysms and have lower displacement amplitudes, while from a quantitative perspective, PWV and the standard deviation of local PWV change significantly in aneurysms. These trends were found to hold not only across all mice in the study, but also in observations obtained in the same mouse at different time points.
However, while normal vessels and aneurysms may be distinguished with relative ease by using either the B-mode image or the PWV, we found no clear differentiating features between the stable aneurysms and the unstable aneurysms prior to rupture in terms of maximum AP diameter, morphologic appearance, pulse wave propagation patterns, or spatiotemporal displacement maps. We also found no statistically significant change in PWV over the 4-mm window that corresponds to the aneurysm sac, indicating that a single PWV measurement may not be sufficient for assessing the likelihood of AAA rupture. Instead, high-resolution analysis of pulse wave propagation within the saccular wall may be used to differentiate stable aneurysms from unstable ones. By using this technique, the PWV is measured over short segments, whose length is dictated by the lateral resolution of the US probe (63 μm in this study). In normal vessels, the PWV measurements across short segments tend to be in better agreement, owing to the relatively homogeneous composition of the vessel wall. In contrast, the vessel walls in the aneurysmal sacs will have undergone remodeling. For this reason, wave propagation within AAA vessels is more heterogeneous and exhibits a greater variation in local PWV. The degree of spatial homogeneity may therefore be quantified by examining the standard deviation of the high-resolution PWV within the aneurysm sac. We found that this metric is significantly associated with the likelihood of aneurysm rupture and increases by more than 75% on average in unstable AAAs compared with stable ones. From a physiological perspective, several studies have shown that the saccular wall of AAAs is often heterogeneous and of varying thickness (28–30). Hence, the increased inhomogeneity in pulse wave propagation within unstable AAAs may indicate that the saccular wall contains more potential points of rupture after remodeling of the vessel.
It is unlikely that the increased standard deviations in the local PWVs originate from noise, since noise of this nature would have to arise from misalignments in the ECG gating between successive lines in the image. Since the effectiveness of the ECG gating depends only on the quality of the ECG signal and is independent of the image data, this type of noise would be expected to affect all PWI acquisitions equally, rather than affecting normal aortas less than stable AAA or affecting stable aneurysms less than unstable ones. Additionally, noise that is present in the ECG gating is partly mitigated by the Savitzky-Golay and median filters described earlier. Finally, if ECG gating noise were affecting the 50% upstroke markers to the degree observed in this study, substantial degradation would also be observed in the corresponding B-mode cine loops, since these are also formed by using the same ECG gating process.
Previous work with the animal model used in this study has shown that changes in the overall diameter and stiffness of an aneurysm play an important role in staging the progression of aortic aneurysm disease (19). It is possible that in our study, we did not have sufficient statistical power to detect a difference in PWV or aneurysm diameter between the stable AAA and unstable AAA groups. In previous studies (19,31), investigators showed that aneurysm formation in the murine angiotensin II model is preceded by the formation of fissures in the wall of the aorta. Incomplete remodeling of the wall after the appearance of a fissure could result in structural weaknesses that remain in the saccular wall, thereby rendering rupture more likely.
Because the PWI technique relies on wave arrival time, the orientation of the imaging probe relative to the vessel does not affect the reliability of the technique. This is because the wave arrival time can be tracked as long as the displacement contains an axial component, which will be the case as long as the probe is not completely parallel to the vessel. This feature of PWI has been confirmed in successful applications of the technique in humans with clinically available equipment (20,32,33). Hence, the metrics of aneurysm stability proposed in this study are also angle independent and robust to changes in the field of view, which are important features for clinical practice.
Long-term clinical studies in humans are needed to study the influence of pulse wave propagation homogeneity on the stability of human aneurysms, given that there are several differences between AAA disease in humans and the murine AAA disease model used in this study. These differences include the time scale of aneurysm formation, which is several years or more in humans compared with less than 2 weeks in mice; the mechanisms of aneurysm formation, which are still not completely understood in humans but are almost certainly different from the angiotensin II–based model used in this work; the mural calcification often present in human aneurysms (30), which would increase the variability in local PWV measurements on its own; the geometry and location of the aneurysm sac, which is typically fusiform and infrarenal in humans (20,30) compared with the one-sided, suprarenal aneurysms seen in this work; and the available resolution and frame rate, which are lower in humans. The latter difference is of particular relevance to this study, given that the metrics of wave propagation homogeneity and aneurysm stability proposed herein rely on obtaining high-resolution measurements of the PWV at relatively high frame rates over the length of the vessel wall. In humans, the lower spatial and temporal resolutions stem primarily from two factors: the increased depth and size of the abdominal aorta, which means that lower frequencies and lower frame rates must be used; and the limited acoustic window in some areas, which necessitates the use of diverging beams and implies that lateral resolution decreases with depth. However, human aneurysms are also commensurately larger than the murine ones in this study, and recent work with modern imaging platforms has demonstrated that comparable beam densities, relative to the size of the aneurysm, are possible in humans (34). This work therefore suggests additional parameters to consider that may be correlated with disease outcome and that clinicians may consider on a case-by-case basis when assessing patients.
In conclusion, PWI can be used to assess the stability of murine aortic aneurysms noninvasively by measuring the homogeneity of pulse wave propagation within the aneurysm sac. While no differences between stable and unstable aneurysms were observed by comparing maximum AP diameters or PWV values, the standard deviation of variability of high-resolution PWVs across the saccular wall was found to be significantly associated with aneurysm rupture in this animal model. Hence, PWI could potentially be used to assess the stability of human aneurysms by providing information that is complementary to the anatomic data obtained from B-mode images, with no additional equipment required.
Advances in Knowledge
■ The standard deviation of high-resolution pulse wave velocity (PWV) measurements is a statistically significant (P < .001/12, Cohen d = 2.0) predictor of aneurysm rupture in mice, with pulse wave propagation being more homogeneous in stable aneurysms (3.2 m/sec ± 0.9, n = 12) than in unstable aneurysms (5.7 m/sec ± 1.5, n = 14).
■ No significant difference was observed between stable (n = 12) and unstable (n = 14) aneurysms on the basis of neither the increase in the maximum anterior-posterior (AP) vessel diameter (54.5% ± 2.2 in stable aneurysms vs 55.3% ± 2.8 in unstable aneurysms, P = .45) nor the decrease in PWV within the aneurysm sac (1.1 m/sec ± 0.8 decrease in stable aneurysms vs 1.3 m/sec ± 0.8 decrease in unstable aneurysms, P = .55).
■ Maximum AP diameter, PWV, and wave propagation homogeneity all change significantly (P < .001/12) in aneurysms compared with normal aortas (n = 26).
Acknowledgments
Acknowledgments
The authors thank Shunichi Homma, MD, for the use of the VisualSonics Vevo 770 US imager. The authors also thank Camilo Acosta, BA, Iason-Zacharias Apostolakis, BS, Ronny Li, PhD, Fusako Sera, MD, and Anushree Srivastava, MS, for their assistance.
Received June 30, 2015; revision requested August 10; revision received March 14, 2016; accepted March 18; final version accepted April 5.
Study supported by the National Institutes of Health National Heart, Lung, and Blood Institute (R01-HL098830-04).
Disclosures of Conflicts of Interest: S.D.N. disclosed no relevant relationships. E.E.K. disclosed no relevant relationships.
Abbreviations:
- AAA
- abdominal aortic aneurysm
- AP
- anterior-posterior
- ECG
- electrocardiogram
- PWI
- pulse wave imaging
- PWV
- pulse wave velocity
References
- 1.Murphy SL, Xu J, Kochanek KD. Deaths: final data for 2010. Natl Vital Stat Rep 2013;61(4):1–117. [PubMed] [Google Scholar]
- 2.Urbonavicius S, Urbonaviciene G, Honoré B, Henneberg EW, Vorum H, Lindholt JS. Potential circulating biomarkers for abdominal aortic aneurysm expansion and rupture—a systematic review. Eur J Vasc Endovasc Surg 2008;36(3):273–280; discussion 281–282. [DOI] [PubMed] [Google Scholar]
- 3.Crawford CM, Hurtgen-Grace K, Talarico E, Marley J. Abdominal aortic aneurysm: an illustrated narrative review. J Manipulative Physiol Ther 2003;26(3):184–195. [DOI] [PubMed] [Google Scholar]
- 4.Patterson BO, Holt PJ, Hinchliffe R, Loftus IM, Thompson MM. Predicting risk in elective abdominal aortic aneurysm repair: a systematic review of current evidence. Eur J Vasc Endovasc Surg 2008;36(6):637–645. [DOI] [PubMed] [Google Scholar]
- 5.Forsdahl SH, Singh K, Solberg S, Jacobsen BK. Risk factors for abdominal aortic aneurysms: a 7-year prospective study: the Tromsø study, 1994–2001. Circulation 2009;119(16):2202–2208. [DOI] [PubMed] [Google Scholar]
- 6.Brewster DC, Cronenwett JL, Hallett JW, Jr, et al. Guidelines for the treatment of abdominal aortic aneurysms. J Vasc Surg 2003;37(5):1106–1117. [DOI] [PubMed] [Google Scholar]
- 7.Manning MW, Cassi LA, Huang J, Szilvassy SJ, Daugherty A. Abdominal aortic aneurysms: fresh insights from a novel animal model of the disease. Vasc Med 2002;7(1):45–54. [DOI] [PubMed] [Google Scholar]
- 8.Stather PW, Dattani N, Bown MJ, Earnshaw JJ, Lees TA. International variations in AAA screening. Eur J Vasc Endovasc Surg 2013;45(3):231–234. [DOI] [PubMed] [Google Scholar]
- 9.Vorp DA, Raghavan ML, Webster MW. Mechanical wall stress in abdominal aortic aneurysm: influence of diameter and asymmetry. J Vasc Surg 1998;27(4):632–639. [DOI] [PubMed] [Google Scholar]
- 10.Choksy SA, Wilmink AB, Quick CR. Ruptured abdominal aortic aneurysm in the Huntingdon district: a 10-year experience. Ann R Coll Surg Engl 1999;81(1):27–31. [PMC free article] [PubMed] [Google Scholar]
- 11.Hamilton PK, Lockhart CJ, Quinn CE, McVeigh GE. Arterial stiffness: clinical relevance, measurement and treatment. Clin Sci (Lond) 2007;113(4):157–170. [DOI] [PubMed] [Google Scholar]
- 12.Zoungas S, Asmar RP. Arterial stiffness and cardiovascular outcome. Clin Exp Pharmacol Physiol 2007;34(7):647–651. [DOI] [PubMed] [Google Scholar]
- 13.Adji A, O’Rourke MF, Namasivayam M. Arterial stiffness, its assessment, prognostic value, and implications for treatment. Am J Hypertens 2011;24(1):5–17. [DOI] [PubMed] [Google Scholar]
- 14.Laurent S, Cockcroft J, Van Bortel L, et al. Expert consensus document on arterial stiffness: methodological issues and clinical applications. Eur Heart J 2006;27(21):2588–2605. [DOI] [PubMed] [Google Scholar]
- 15.Nemes A, Takács R, Gavallér H, et al. Correlations between arteriograph-derived pulse wave velocity and aortic elastic properties by echocardiography. Clin Physiol Funct Imaging 2011;31(1):61–65. [DOI] [PubMed] [Google Scholar]
- 16.Swillens A, Taelman L, Degroote J, Vierendeels J, Segers P. Comparison of non-invasive methods for measurement of local pulse wave velocity using FSI-simulations and in vivo data. Ann Biomed Eng 2013;41(7):1567–1578. [DOI] [PubMed] [Google Scholar]
- 17.Fung Y-C. Biomechanics: circulation. 2nd ed. New York, NY: Springer, 1996. [Google Scholar]
- 18.Mitchell GF. Arterial stiffness and wave reflection: biomarkers of cardiovascular risk. Artery Res 2009;3(2):56–64. [DOI] [PMC free article] [PubMed] [Google Scholar]
- 19.Nandlall SD, Goldklang MP, Kalashian A, Dangra NA, D’Armiento JM, Konofagou EE. Monitoring and staging abdominal aortic aneurysm disease with pulse wave imaging. Ultrasound Med Biol 2014;40(10):2404–2414. [DOI] [PMC free article] [PubMed] [Google Scholar]
- 20.Li RX, Luo J, Balaram SK, Chaudhry FA, Shahmirzadi D, Konofagou EE. Pulse wave imaging in normal, hypertensive and aneurysmal human aortas in vivo: a feasibility study. Phys Med Biol 2013;58(13):4549–4562. [DOI] [PMC free article] [PubMed] [Google Scholar]
- 21.Luo J, Fujikura K, Tyrie LS, Tilson MD, Konofagou EE. Pulse wave imaging of normal and aneurysmal abdominal aortas in vivo. IEEE Trans Med Imaging 2009;28(4):477–486. [DOI] [PubMed] [Google Scholar]
- 22.Daugherty A, Cassis LA. Mouse models of abdominal aortic aneurysms. Arterioscler Thromb Vasc Biol 2004;24(3):429–434. [DOI] [PubMed] [Google Scholar]
- 23.Lemaître V, Soloway PD, D’Armiento J. Increased medial degradation with pseudo-aneurysm formation in apolipoprotein E-knockout mice deficient in tissue inhibitor of metalloproteinases-1. Circulation 2003;107(2):333–338. [DOI] [PubMed] [Google Scholar]
- 24.De Prophetis N, Armitage HV, Triboletti ED. Rupture of tuberculous aortic aneurysm into lung. Ann Surg 1959;150(6):1046–1051. [DOI] [PMC free article] [PubMed] [Google Scholar]
- 25.Klevay LM. Cardiovascular disease from copper deficiency—a history. J Nutr 2000;130(2S Suppl):489S–492S. [DOI] [PubMed] [Google Scholar]
- 26.Luo J, Konofagou E. A fast normalized cross-correlation calculation method for motion estimation. IEEE Trans Ultrason Ferroelectr Freq Control 2010;57(6):1347–1357. [DOI] [PMC free article] [PubMed] [Google Scholar]
- 27.Chiu YC, Arand PW, Shroff SG, Feldman T, Carroll JD. Determination of pulse wave velocities with computerized algorithms. Am Heart J 1991;121(5):1460–1470. [DOI] [PubMed] [Google Scholar]
- 28.Thubrikar MJ, Labrosse M, Robicsek F, Al-Soudi J, Fowler B. Mechanical properties of abdominal aortic aneurysm wall. J Med Eng Technol 2001;25(4):133–142. [DOI] [PubMed] [Google Scholar]
- 29.Vorp DA, Vande Geest JP. Biomechanical determinants of abdominal aortic aneurysm rupture. Arterioscler Thromb Vasc Biol 2005;25(8):1558–1566. [DOI] [PubMed] [Google Scholar]
- 30.Siegel CL, Cohan RH, Korobkin M, Alpern MB, Courneya DL, Leder RA. Abdominal aortic aneurysm morphology: CT features in patients with ruptured and nonruptured aneurysms. AJR Am J Roentgenol 1994;163(5):1123–1129. [DOI] [PubMed] [Google Scholar]
- 31.Wilson JS, Virag L, Di Achille P, Karsaj I, Humphrey JD. Biochemomechanics of intraluminal thrombus in abdominal aortic aneurysms. J Biomech Eng 2013;135(2):021011. [DOI] [PMC free article] [PubMed] [Google Scholar]
- 32.Vappou J, Luo J, Okajima K, Di Tullio M, Konofagou E. Aortic pulse wave velocity measured by pulse wave imaging (PWI): a comparison with applanation tonometry. Artery Res 2011;5(2):65–71. [DOI] [PMC free article] [PubMed] [Google Scholar]
- 33.Khamdaeng T, Luo J, Vappou J, Terdtoon P, Konofagou EE. Arterial stiffness identification of the human carotid artery using the stress-strain relationship in vivo. Ultrasonics 2012;52(3):402–411. [DOI] [PMC free article] [PubMed] [Google Scholar]
- 34.Provost J, Nguyen VT, Legrand D, et al. Electromechanical wave imaging for arrhythmias. Phys Med Biol 2011;56(22):L1–L11. [DOI] [PMC free article] [PubMed] [Google Scholar]


