

Abstract
Background
Atypical teratoid rhabdoid tumors (AT-RT) are pediatric tumors of the central nervous system with limited treatment options and poor survival rate. We investigated whether enhancing chemotherapy toxicity by depleting intracellular glutathione (GSH; a key molecule in cisplatin resistance) with high dose acetaminophen (AAP), may improve therapeutic efficacy in AT-RT in vitro.
Procedure
BT16 (cisplatin-resistant) and BT12 (cisplatin-sensitive) AT-RT cell lines were treated with combinations of AAP, cisplatin, and the anti-oxidant N-acetylcysteine (NAC). Cell viability, GSH and peroxide concentrations, mitochondrial damage, and apoptosis were evaluated in vitro.
Results
AAP enhanced cisplatin cytotoxicity in cisplatin-resistant BT16 cells but not cisplatin-sensitive BT12 cells. Baseline GSH levels were elevated in BT16 cells compared to BT12 cells, and AAP decreased GSH to a greater magnitude in BT16 cells than BT12 cells. Unlike BT12 cells, BT16 cells did not have elevated peroxide levels upon treatment with cisplatin alone, but did have elevated levels when treated with AAP + cisplatin. Both cell lines had markedly increased mitochondrial injury when treated with AAP + cisplatin relative to either drug treatment alone. The enhanced toxic effects were partially reversed with concurrent administration of NAC.
Conclusions
Our results suggest that AAP could be used as a chemo-enhancement agent to potentiate cisplatin chemotherapeutic efficacy particularly in cisplatin-resistant AT-RT tumors with high GSH levels in clinical settings.
Keywords: acetaminophen, cisplatin, N-acetylcysteine
INTRODUCTION
Atypical teratoid rhabdoid tumors (AT-RT) are rare tumors of the central nervous system (CNS) that generally occur in children less than 3 years of age. They are composed of neuroepithelial, mesenchymal, and epithelial elements [1,2]. The prognosis of AT-RT is dismal, with survivals ranging from 16 to 24 months depending on the treatment regimen. Improvement in relatively short-term event free survival was reported in a trial that utilized a multimodal approach involving resection, radiation, and chemotherapy [3–5]. However, it would be ideal to avoid neuroradiation in these young patients given the potential for significant neurocognitive deficits associated with this approach [6].
Cisplatin (cis-diamminedichloroplatinum; CDDP)-based chemotherapy regimens continue to be a mainstay in the treatment of multiple solid tumors in adults and children, including AT-RT [7–9]. Cisplatin functions by cross-linking DNA leading to impaired transcription and replication, and ultimately cell cycle arrest and apoptosis [10]. It has been shown that the level of cisplatin-DNA adducts correlates with increased cell death in cervical carcinoma HeLa cells [11]. However, cisplatin is also thought to induce free-radical damage in target cells. A potential mechanism of cisplatin resistance involves glutathione (GSH), the most prevalent intracellular anti-oxidant. Increased levels of GSH have been associated with cisplatin resistance in tumor cell lines, and elevated mRNA of GSH S-transferase correlates inversely with cisplatin sensitivity [12,13]. Multiple studies have demonstrated that increased GSH-dependent detoxification of cisplatin correlates with increased resistance [14,15]. The mechanism is thought to involve covalent bonding of GSH to cisplatin [16]. However, GSH is also thought to function as a free-radical scavenger of cisplatin generated ROS [17].
Mechanisms to decrease concentrations of GSH in tumor cells may enhance the toxicity of chemotherapy. Previously, buthionine sulfoxamine (BSO), a selective inhibitor of glutamylcysteine synthetase, has been shown to be toxic alone against neuroblastoma cell lines via mechanisms involving free radical damage [18], and also potentiates the cytotoxicity of concurrently administered alkylating agents [19]. However, BSO is not FDA approved, limiting its clinical availability. In contrast, acetaminophen (AAP) is a cheap and widely available FDA-approved drug. Kobrinsky et al. [20] published a succesful case report in which AAP in combination with cisplatin was used in the treatment of a refractory hepatoblastoma patient who failed to respond to conventional chemotherapy. AAP is converted within the cell into a highly reactive free radical N-acetylp-benzoquinonimine (NAPQI) via multiple enzymes including cytochrome P450 2E1 (CYP2E1). NAPQI is generally detoxified by GSH, though in the setting of overdose this mechanism may be overwhelmed leading to depletion of GSH and free-radical da mage to the cell. The ability of AAP to deplete GSH in liver tumor cell lines with widely variable expression of CYP2E1 [21] suggests that AAP may have activity against non-hepatic tumors that may have limited expression of the enzyme. The objective of this study is to investigate the potential mechanisms of cytotoxicity of AAP in combination with cisplatin in two different AT-RT cell lines (BT 12 and BT 16) with differential susceptibility to cisplatin toxicity.
MATERIALS AND METHODS
Pharmacological Agents and Antibodies
Sterile solutions of cisplatin and N-acetylcysteine (NAC) in saline were obtained from the Oregon Health and Sciences University pharmacy. AAP was purchased from Sigma (St Louis, MO).
Rabbit anti-PARP polyclonal antibody and phospho-p53 (S15) antibody were from Cell Signaling Technology (Danvers, MA). Mouse anti-β-tubulin monoclonal antibody was from Sigma– Aldrich (St. Louis, MO). Rabbit anti-p53 polyclonal antibody was from Santa Cruz Biotechnology, Inc. (Santa Cruz, CA).
Cell Lines
BT16 and BT12 AT-RT cell lines were obtained from St. Jude’s Hospital in Tennessee. Cells were cultured in RPMI with 10% FBS in 5% CO2 at 37°C.
Cytotoxicity Assays
The MTS and CytoTox-Glo cell viability assays were obtained from Promega (San Luis Obispo, CA). For the MTS assay, cells were seeded (4,000 cells/well in RPMI) on Day 0, and incubated with varying doses of AAP and cisplatin from Days 1 to 4. Absorbance by MTS was read at 490 nm. For the CytoTox-Glo assay 1,000 cells/well were treated with AAP ± cisplatin for 24 or 48 hours, and live cells versus dead cell luminescence was measured. Each assay used four wells per group and experiments were replicated three to four times for each cell line. Results were normalized relative to positive and negative controls.
GSH Measurements
AT-RT cells (4 × 10⁵ cells plated onto 60-mm tissue culture plates in 5 ml of medium) were treated with the desired concentrations of AAP, cisplatin, and/or NAC. At 4 or 20 hours after treatment, both the attached and detached cells were collected, washed with PBS, and resuspended in PBS containing 1 mM EDTA. The mixtures were then vortexed, freeze–thawed twice, and centrifuged at 10,000g for 15 minutes at 4°C. The supernatants were analyzed for GSH concentration using a Quanticrom Glutathione Assay Kit from BioAssay Systems (Hayward, CA) according to the manufacturer’s protocol. The protein content was determined using a BCA assay kit (Pierce Biotechnology, Rockford, IL), and results were normalized for total protein content.
Western Blotting Analysis
The standard protocol of Western blotting and GSH measurement assay in our lab was described previously [21]. Total cell lysate (25 μg per lane) was loaded and subjected to gel electrophoresis. After membrane transferring and blocking, primary antibody: anti-PARP (1:1,000), phospho-p53 (S15; 1:1,000), β-tubulin (1:5,000), and p53 (1:1,000) was added to the membrane and incubated at 4°C for 20 hours. The membrane was further incubated with secondary antibody conjugated with horse radish peroxidase (1:5,000) at room temperature for 2 hours. Signals were detected using a Chemiluminescence Blotting Substrate Kit (Roche Diagnostics, Mannheim, Germany) according to the manufacturer’s protocol.
JC-1 Staining for Mitochondrial Membrane Potential
Cells were seeded (5 × 10⁵ cells) and treated with the described treatments as described in figure legend. After 20 hours incubation, 3 μg/ml final concentration JC-1 dye from eBioscience (San Diego, CA) was added to the plates and allowed to incubate for 30 minutes. The cells were then collected, washed with PBS, resuspended in PBS, and subjected to BD Calibur cytometer analysis at the OHSU flow cytometry core. Measurements were made according to the manufacturer’s protocol. The positive control was 1 μg/ml valinomycin.
DCFH Staining for Peroxide Levels
5-(and-6)-chloromethyl-2′,7′-dichlorodihydrofluorescein diacetate, acetyl ester (DCFH) was obtained from Invitrogen (Carlsbad, CA; catalogue C6827). Cells were incubated 20 hours in treatment solution, and the media was aspirated and cells washed with PBS. Fresh PBS was added to cells. DCFH was added to the solution at 1:100 dilution (final concentration 5 μM). The cells were incubated in the incubator 30 minutes. The solution was then aspirated, the cells were washed with PBS, and were trypsinized with phenol-red free trypsin. The cells were collected with phenol-red free media with FBS, centrifuged, and resuspended in phenol-red free medium with FBS and taken to the flow cytometry core for analysis per the manufacturer’s protocol.
Annexin V Apoptosis Staining
Cells were seeded and treated with AAP (5 mM), CDDP (1 μg/ml), AAP + cisplatin, and AAP + cisplatin + NAC (1 mg/ml) for 20 hours. Apoptosis was measured by flow cytometry using FITC annexin Vand propidium iodine (PI) apoptosis detection kit I from BD Pharmingen (San Jose, CA). After incubation with FITC annexin V and PI at room temparature in the dark for 15 min, cells were subjected to BD Calibur cytometer analysis at the OHSU flow cytometry core. Unstained cells, cells stained with FITC annexin V (no PI) and with PI (no FITC annexin V) were used to set up compensation and quadrants for analysis.
Statistical Analysis
The results were performed in triplicate and expressed as mean ± SEM, and the significance of the difference between the mean values of treated cells and their vehicle control within the same cell line was determined by using one-way analysis of variance (ANOVA) with Dunnett’s test. The Student’s t-test was performed to compare any two different variables of treatment groups selected. Significance was determined at the 5% level, two-sided, and indicated by asterisks: *P < 0.05, **P < 0.01, or ***P < 0.001.
RESULTS
AAP Treatment Significantly Depletes GSH Levels in AT-RT Cell Line
In order to investigate the hypothesis that AAP may potentiate cisplatin cytotoxicity via GSH depletion, GSH assays were performed to determine GSH levels with various treatment conditions. BT16 (cisplatin-resistant) cells baseline GSH levels (108 ± 10 mM/μg protein) were significantly higher (P < 0.05, Student’s t-test) than BT12 (cisplatin sensitive) cells (42 ± 8 mM/μg protein; Fig. 1). In both BT12 and BT16 cells, there were non-significant decreases in the GSH levels after 4 hours at increasing AAP concentrations. However, for both cell lines, there was a significant decrease in GSH levels with 20 hours incubation in increasing AAP concentrations (Fig. 1A). The AAP response for BT16 cells was of greater magnitude and occurred at lower AAP doses than BT12 cells. We investigated combination treatment with cisplatin, AAP, and NAC, after either 4 or 20 hours treatment. In both cell lines, cisplatin treatment alone increased GSH levels, but no increase was seen at 4 hours when the cells were also treated with AAP. Both cell lines had increased GSH levels at 4 hours when NAC was included with AAP and cisplatin (Supplementary Fig. 1). With 20 hours treatment, there were no significant differences in the GSH levels in BT12 cells treated with vehicle, AAP, cisplatin, and cisplatin + AAP, but increased GSH levels with NAC treatment. In BT16 cells, 20 hours AAP decreased GSH levels alone and in combination with cisplatin. NAC + cisplatin + AAP treated cells did not have significantly raised GSH levels above cells treated with only cisplatin + AAP or vehicle (Fig. 1B) in BT16 cells at the 20 hours timepoint. These findings suggest that there is less effect of AAP on decreasing GSH levels in BT12 cells compared to BT16 cells.
Fig. 1.
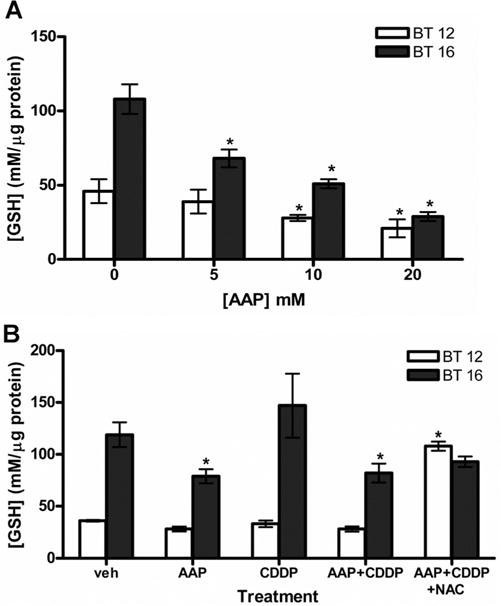
Effect of AAP, cisplatin, and NAC on glutathione in AT-RT cell line. A: Dose response of glutathione levels to increasing amounts of AAP after 20 hours incubation as analyzed with a quanticrom glutathione assay kit. Cells were treated with AAP (5 mM), CDDP (1 μg/ml), AAP + cisplatin and AAP + cisplatin + NAC (1 mg/ml). B: GSH levels measured after 20 hours incubation with described treatments. All experiments performed in triplicate. *Indicates significant difference (P <.05, ANOVA Dunnett’s test) of any treatment group compared to vehicle control within the same cell line.
AAP Combined With Cisplatin Increased Peroxide Levels in AT-RT Cell Lines
GSH is known to function in detoxifying intracellular free radicals, especially peroxide. To examine this effect, peroxide levels were measured in the treated cells using DCFH stain (Fig. 2). Figure 2A demonstrates representative plots generated by flow cytometry analysis from the BT12 cells treated 20 hours with combinations of cisplatin, AAP, and NAC. Peroxide levels increased in cells treated with AAP (77 ± 6%) and AAP + cisplatin (87 ± 2%) compared to baseline (62 ± 4%). This effect was reversed by concurrent administration of NAC (62 ± 4%). BT16 cells treated with AAP (71 ± 5%) and AAP + cisplatin (68 ± 6%) had elevated peroxide levels compared to vehicle control (52 ± 4%). However, BT16 cells treated with cisplatin alone (55 ± 3%) did not have elevated peroxide levels. In contrast to BT12 cells, BT16 cells treated with AAP + cisplatin + NAC (77 ± 1%) did not have decreased peroxide levels relative to AAP + cisplatin.
Fig. 2.
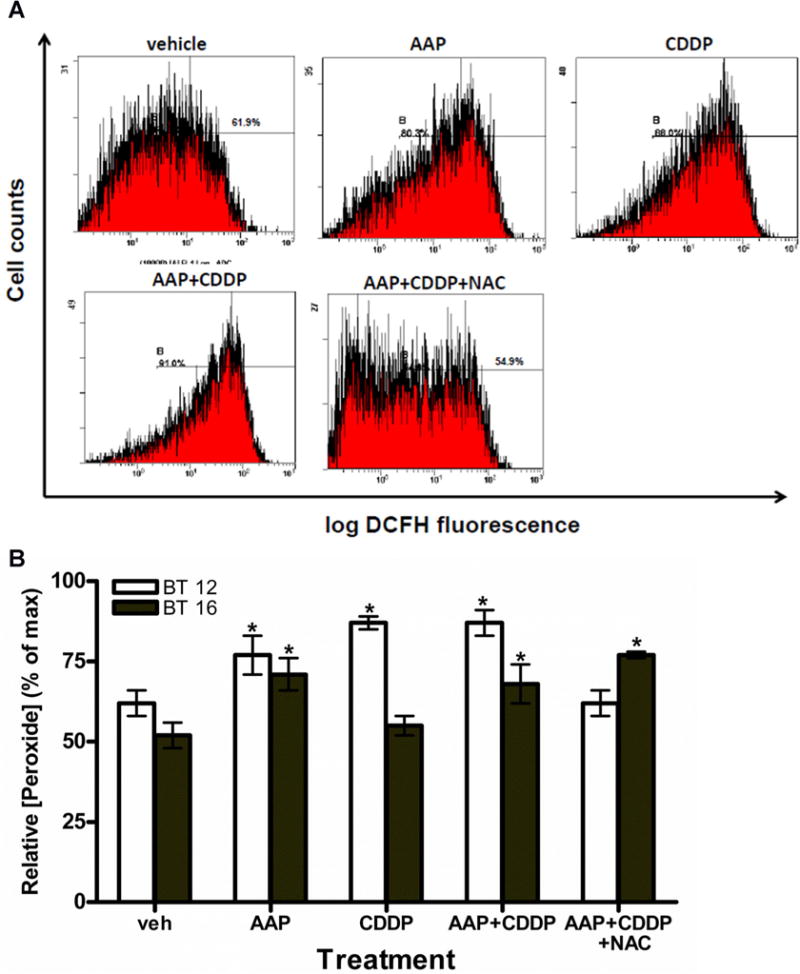
AAP treatment increased peroxide production in AT-RTcells. Peroxide levels were measured in the treated cells by using DCFH stain and analyzed by flow cytometry. The dose of drug used to treat cells is [AAP] = 5 mM, [CDDP] = 1 μg/ml, and [NAC] = 1 mg/ml, respectively. A: Representative flow cytometry output graphs demonstrating peroxide levels in BT12 cells after 20 hours incubation of various treatments. (x-axis: log DCFH flourensence and y-axis: cell counts). B: Relative [peroxide] of cells at y-axis was indicated by the percentage of maximal DCFH flourensence intensity. Results of three independent experiments for each cell line when cells were incubated 20 hours after treatment. *Indicates significant difference (P <.05, ANOVA Dunnett’s test) of any treatment group compared to vehicle control within the same cell line.
AAP Potentiated Change of Mitochondrial Membrane Potential by Cisplatin in AT-RT Cell Lines
Mitochondrial membrane potential (MtMP) is an important parameter of mitochondrial function and used as an indicator of cell health. To investigate the involvement of MtMP in AAP and cisplatin treatment, cells were analyzed with JC-1 stain via flow cytometry. JC-1 red-stained cells indicate healthy cells with intact mitochondrial membrane, where green signal indicates unhealthy cells with mitochondrial damage. Figure 3A demonstrates representative flow cytometry of BT12 cells. Cells treated with either AAP (15.1 ± 0.4%) or cisplatin (15.2 ± 2.6%) alone had significantly higher (P < 0.05, ANOVA Dunnett’s test) JC-1 green-stained cells compared to vehicle control (1.6 ± 0.1%; Fig. 3B). An even more marked increase in mitochondrial damage occurred in cells treated with both AAP + cisplatin (64.0 ± 2.4%; P < 0.001, Dunnett’s test). This effect was partially reversed when cells were simultaneously treated with NAC (26.8 ± 3.5%; P < 0.001, Student’s t-test; Fig. 3B). In BT16 cells, higher (4×) concentrations of both AAP and cisplatin were required to cause same magnitude of MtMP by using JC-1 staining and flow cytometry (Fig. 3C).
Fig. 3.
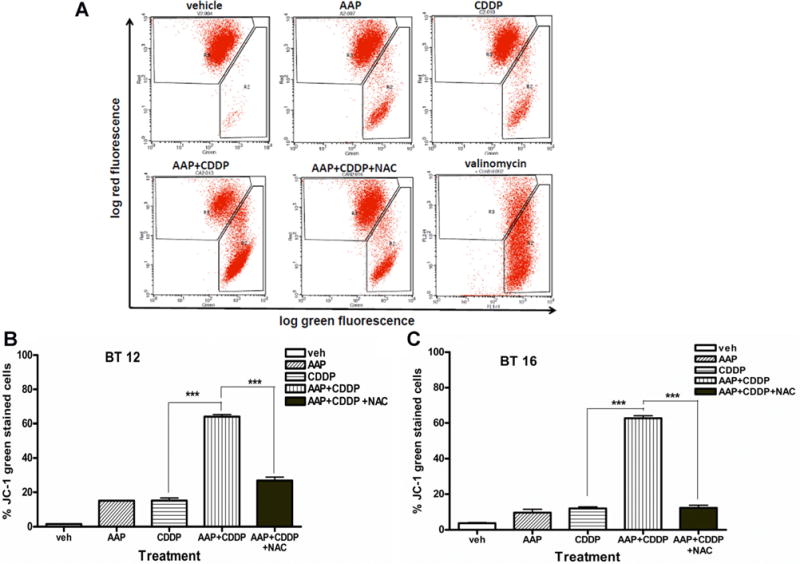
AAP potentiated changes of mitochondrial membrane potential by cisplatin in AT-RT cells. Cellular mitochondrial menbrane potential was measured by log green (x-axis) and log red (y-axis) flourensence intensity by flow cytometry after JC-1 staining. Red signal indicates healthy cells with intact mitochondrial membrane, where green signal indicates unhealthy cells with mitochondrial damadge. A: Representative flow output graphs for BT12 cells incubated with described treatment 20 hours. Doses were 10 mM AAP, 2 μg/ml cisplatin, and 1 mg/ml NAC. Postive control represents 30 minutes treatment of 1 μg/ml valinomycin. B: Results of three independent experiments under same treatment conditions as described in A). C: Results of three independent experiments with BT16 cells incubated 20 hours and stained with JC-1. Treatment concentrations were 20 mM AAP, 8 μg/ml cisplatin, and 1 mg/ml NAC. All experiments performed in triplicate. Data were expressed as mean ± SEM. ***Indicated significant difference (P <.001, Student’s t-test) between two treatment groups.
Western Blotting and Apoptosis Analysis of AT-RT Cell Lines
We assessed phosphorylation levels of p53 protein at serine 15 site, a marker of DNA damage (Fig. 4). The cisplatin-sensitive BT12 cells showed p53 phosphorylation in response to both cisplatin and AAP, with increased response to combination therapy and NAC protection. The cisplatin resistant BT16 cells showed no p-p53 by Western blot. We also assessed cleavage of poly (ADP-ribose) polymerase (PARP) as a marker of apoptosis. Both cell lines exhibited an increase of cleaved PARP when cells were treated with AAP + cisplatin compared to either AAP or cisplatin alone. NAC was partially protective when administered concurrently with chemotherapy in both cell lines. Similar results were found when we used FITC annexin V and propidium iodine detection kit to analyze apoptosis and necrosis by flow cytometry. In BT16 cells, both apoptotic (annexinV+/PI −stained) and annexinV+/PI+ stained cells were signifantly (P < 0.01, Student’s test) increased in AAP + cisplatin group after 20 hours incubation compared to either AAP or cisplatin alone and this effect was partially protected when NAC was added concurrently (P < 0.01, Student’s test; Fig. 4C).
Fig. 4.
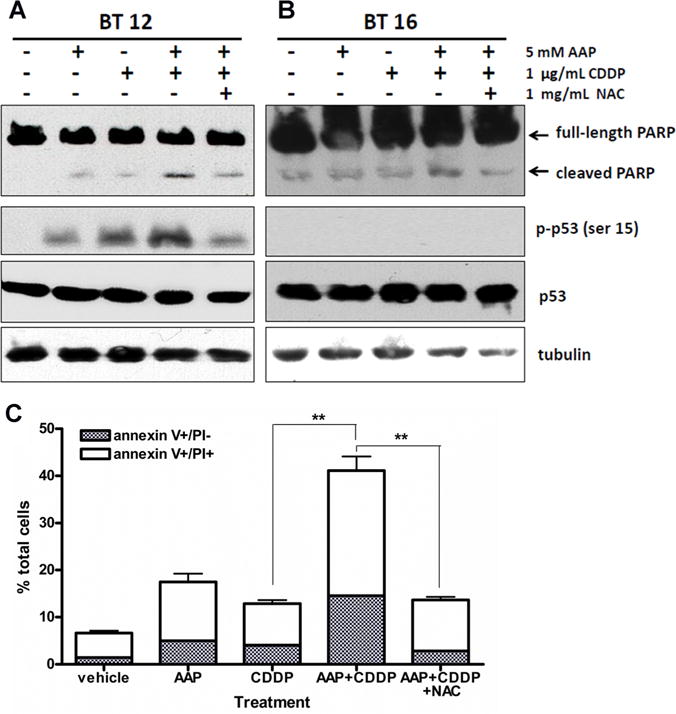
AAP potentiated apoptsis induced by cisplatin in AT-RT cells. A: BT12 cells were treated as shown and incubated in treatment solution 4 hours before collection and analysis. Tubulin was stained to demonstrate equal loading. B: BT16 cells were allowed to incubate in described treatment for 4 hours before collection and analysis. C: BT16 cells were treated with AAP (5 mM), CDDP (1 μg/ml), AAP cisplatin and AAP + cisplatin + NAC (1 mg/ml) 20 hours. Apoptosis was measured by flow cytometry using FITC annexin V with propidium iodine (PI) apoptosis detection kit I. Apoptotic and necrotic cells were indicated by annexin V + and PI + staining, respectively. Data were presented as mean ± SEM of three independent experiments. **Indicated significant difference (P <.01, Student’s t-test) between two treatment groups.
Cytotoxicity assays shown at Figure 5 demonstrated the effect of increasing concentrations of AAP and/or cisplatin on cell viability in AT-RT cells using an MTS cell viability assay. AAP and cisplatin were both independently cytotoxic in both cell lines. In BT12 cells, there was no decreased cell viability when combining AAP with cisplatin over cisplatin treatment alone. In contrast, BT16 cells were significantly less sensitive to cisplatin treatment than BT12 cells (Fig. 5B). Further, BT16 cells treated with cisplatin + AAP had significantly increased cell cytotoxicity relative to cells treated with either drug alone. Similar findings were observed during CytoToxGlo analysis. For BT16 cells, cisplatin LD50 was 15 μg/ml without AAP and 7 μg/ml with 5 mM AAP at 24 hours after treatment; and 7 μg/ml without AAP and 3.1 μg/ml with AAP at 48 hours after treatment. The cisplatin LD50 was not altered by AAP treatment in the cisplatin-sensitive BT12 cells (Supplementary Fig. 2). This suggests AAP combined with cisplatin increases cytotoxicity in BT16 but not BT12 AT-RT cell lines.
Fig. 5.
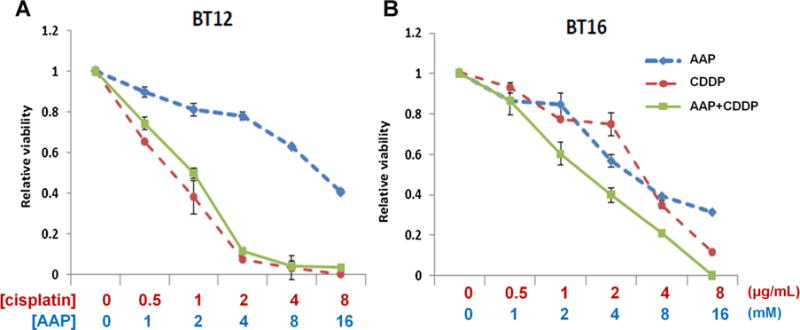
AAP potentiated cell toxicity induced by cisplatin in BT16 but not BT12 AT-RT cells. Cell viability was measured by MTS assays as decribed in Materials and Methods Section. All assays were normalized relative to untreated vehicle. Assay assessing dose response of increasing concentrations of AAP, cisplatin, and cisplatin + AAP for (A) BT12 cells and (B) BT16 cells. Results demonstrate mean of assay performed in triplicate, with error bars demonstrating standard deviation.
DISCUSSION
In this study, two AT-RT cell lines with different chemotherapy sensitivity were analyzed to examine the hypothesis that AAP may potentiate the cytotoxic effect of cisplatin with reversal by adding NAC. BT12 cells had lower GSH levels and were more sensitive to cisplatin at baseline than BT16 cells, a result consistent with the theory that GSH functions in cisplatin resistance. Further, in both cell lines, there was at least a trend toward an increased level of GSH in cisplatin treated cells after 4 hours. This could be a result of cells functioning to resist the cytotoxicity of the drug by upregulating GSH levels, and is consistent with the finding that recurrent ovarian tumors have elevated GSH levels over untreated controls [22]. The reduction of GSH following AAP treatment in both cell lines was far more marked after 20 hours treatment than 4 hours incubation, demonstrating delayed GSH reduction. The rate of GSH depletion in various cell lines varies in the literature, with hepatoblastoma lines showing accelerated GSH depletion and normal liver cells (HepaRG cells) showing more gradual GSH depletion upon treatment with AAP [21,23]. Hepatoblastoma cells have been shown to express CYP2E1 more consistently than other enzymes; in fact, one study demonstrated that CYP2E1 is present in 11 of 13 human hepatoblastoma tumors [24]. It is possible that this expression pattern of cytochrome P450 enzymes may account for the more rapid depletion of GSH in hepatoblastoma cells. These findings suggest that in potential clinical protocols calling for CDDP to be administered 4 hours after AAP in order to allow for GSH depletion, AT-RT cells would not yet be depleted of GSH.
There was an increase in apoptosis as determined by the presence of cleaved PARP protein in BT12 cells treated with cisplatin + AAP relative to cisplatin alone (Fig. 4A). However, the addition of AAP did not increase the cytotoxicity of cisplatin in BT12 cells in the MTS cell viability assay (Fig. 5A) or CytoTox Glo cytotoxicity study. The distinction between findings of Western blotting analysis and MTS assay can perhaps be explained by increased necrosis in BT16 cells treated with cisplatin + AAP relative to BT12 cells with same treatment. Alternatively, this finding may be a result of the different limitations of the assays used in the study. However, based on these studies, it appears unlikely that the cytotoxic relationship between AAP and cisplatin is synergistic in either cell line.
Our findings on GSH analysis were highly correlated to our DCFH measurement of intracellular peroxide levels. For instance, BT16 cells (with elevated GSH levels) have less free radical generation upon treatment with cisplatin than BT12 cells (Fig. 2B). This result makes physiologic sense because GSH plays a significant role in detoxifying intracellular peroxide [17]. Further, BT16 cells treated with NAC + cisplatin + AAP did not have elevated GSH levels compared to cisplatin + AAP after 20 hours of treatment (Fig. 1B; a result that suggests that GSH is metabolized between 4 and 20 hours after treatment as GSH levels were elevated in NAC treated cells after 4 hours). Indeed, peroxide levels, as measured by DCFH, were also not reduced after 20 hours of incubation in NAC treated BT16 cells, a finding consistent with the absence of increased GSH levels at this timepoint given the role of GSH in detoxifying peroxide (Figs. 1 and 2). Nevertheless, while NAC did not increase GSH levels at 20 hours after treatment, it did protect the tumor cells in both cell lines from apoptosis and mitochondrial damage (Figs. 3 and 4). This may indicate that NAC functioned to reverse the toxic effects of the compounds prior to being metabolized.
In order to determine the possible mitochondrial pathways impacted by combining AAP with cisplatin, JC-1 analysis with flow cytometry quantification was performed. Relatively higher concentrations of drugs were used for these studies because no significant effect was found at lower doses. Our results demonstrated a synergistically significant increase in MtMP when combining AAP + cisplatin compared to either drug treatment alone. This suggests that cisplatin may potentiate AAP induced mitochondrial damage in these cell lines. Further, NAC reversed this effect in both cell lines.
Of note, the concentrations of reagents used in our studies were moderately above what is achievable in vivo. In humans, peak plasma levels of 1.7 mM AAP have been shown to be safely tolerated [25]. In the current study, 1–20 mM AAP was used. For NAC, achievable plasma concentrations in humans are 0.3 mg/ml [26] and in cisplatin treated rats an achievable level is 0.72 μg/ml [27]. While concentrations used in these studies were higher than are achievable in vivo, we believe the proof of principle involved in the studies still applies.
Molecular profiling has proven to be a valuable tool in attaining prognostic and therapeutic information of brain tumors [28]. In our study, BT16 cells with higher GSH were less responsive to cisplatin and had better response to chemo-enhancement with AAP than BT12 cells. This finding suggests that biopsy specimens may be analyzed for GSH levels, and patients may be treated based on these results with chemo-enhancers such as AAP. In conclusion, we believe that AAP may be used as a chemo-enhancement agent to potentiate cisplatin chemotherapeutic efficacy particularly in cisplatin-resistant AT-RT tumors with high GSH levels in clinical settings.
Supplementary Material
Acknowledgments
We thank the Morgan Adams Foundation, Walter S. and Lucienne Driskill Foundation for financial support of this project.
Grant sponsor: Morgan Adams Foundation; Grant sponsor: Walter S. and Lucienne Driskill Foundation
Footnotes
Additional supporting information may be found in the online version of this article at the publisher’s web-site.
Conflict of interest: Nothing to declare.
References
- 1.Bhattacharjee M, Hicks J, Langford L, et al. Central nervous system atypical teratoid/rhabdoid tumors of infancy and childhood. Ultrastruct Pathol. 1997;21:369–378. doi: 10.3109/01913129709021935. [DOI] [PubMed] [Google Scholar]
- 2.Parwani AV, Stelow EB, Pambuccian SE, et al. Atypical teratoid/rhabdoid tumor of the brain: Cytopathologic characteristics and differential diagnosis. Cancer. 2005;105:65–70. doi: 10.1002/cncr.20872. [DOI] [PubMed] [Google Scholar]
- 3.Hilden JM, Meerbaum S, Burger P, et al. Central nervous system atypical teratoid/rhabdoid tumor: Results of therapy in children enrolled in a registry. J Clin Oncol. 2004;22:2877–2884. doi: 10.1200/JCO.2004.07.073. [DOI] [PubMed] [Google Scholar]
- 4.Chi SN, Zimmerman MA, Yao X, et al. Intensive multimodality treatment for children with newly diagnosed CNS atypical teratoid rhabdoid tumor. J Clin Oncol. 2009;27:385–389. doi: 10.1200/JCO.2008.18.7724. [DOI] [PMC free article] [PubMed] [Google Scholar]
- 5.Birks DK, Kleinschmidt-DeMasters BK, Donson AM, et al. Claudin 6 is a positive marker for atypical teratoid/rhabdoid tumors. Brain Pathol. 2010;20:140–150. doi: 10.1111/j.1750-3639.2008.00255.x. [DOI] [PMC free article] [PubMed] [Google Scholar]
- 6.Kalifa C, Grill J. The therapy of infantile malignant brain tumors: Current status? J Neurooncol. 2005;75:279–285. doi: 10.1007/s11060-005-6752-x. [DOI] [PubMed] [Google Scholar]
- 7.Hill JM, Speer RJ. Organo-platinum complexes as antitumor agents (review) Anticancer Res. 1982;2:173–186. [PubMed] [Google Scholar]
- 8.Galanski M. Recent developments in the field of anticancer platinum complexes. Recent Pat Anticancer Drug Discov. 2006;1:285–295. doi: 10.2174/157489206777442287. [DOI] [PubMed] [Google Scholar]
- 9.Lafay-Cousin L, Hawkins C, Carret AS, et al. Central nervous system atypical teratoid rhabdoid tumours: The Canadian Paediatric Brain Tumour Consortium experience. Eur J Cancer. 2012;48:353–359. doi: 10.1016/j.ejca.2011.09.005. [DOI] [PubMed] [Google Scholar]
- 10.Siddik ZH. Cisplatin: Mode of cytotoxic action and molecular basis of resistance. Oncogene. 2003;22:7265–7279. doi: 10.1038/sj.onc.1206933. [DOI] [PubMed] [Google Scholar]
- 11.Brozovic A, Fritz G, Christmann M, et al. Long-term activation of SAPK/JNK, p38 kinase and fas-L expression by cisplatin is attenuated in human carcinoma cells that acquired drug resistance. Int J Cancer. 2004;112:974–985. doi: 10.1002/ijc.20522. [DOI] [PubMed] [Google Scholar]
- 12.Nakagawa K, Yokota J, Wada M, et al. Levels of glutathione S transferase pi mRNA in human lung cancer cell lines correlate with the resistance to cisplatin and carboplatin. Jpn J Cancer Res. 1988;79:301–304. doi: 10.1111/j.1349-7006.1988.tb01590.x. [DOI] [PMC free article] [PubMed] [Google Scholar]
- 13.Brozovic A, Ambriovic-Ristov A, Osmak M. The relationship between cisplatin-induced reactive oxygen species, glutathione, and BCL-2 and resistance to cisplatin. Crit Rev Toxicol. 2010;40:347–359. doi: 10.3109/10408441003601836. [DOI] [PubMed] [Google Scholar]
- 14.Estrela JM, Ortega A, Obrador E. Glutathione in cancer biology and therapy. Crit Rev Clin Lab Sci. 2006;43:143–181. doi: 10.1080/10408360500523878. [DOI] [PubMed] [Google Scholar]
- 15.Sadowitz PD, Hubbard BA, Dabrowiak JC, et al. Kinetics of cisplatin binding to cellular DNA and modulations by thiol-blocking agents and thiol drugs. Drug Metab Dispos. 2002;30:183–190. doi: 10.1124/dmd.30.2.183. [DOI] [PubMed] [Google Scholar]
- 16.Berners-Price SJ, Kuchel PW. Reaction of cis- and trans-[PtCl2(NH3)2] with reduced glutathione inside human red blood cells, studied by 1H and 15N-[1H] DEPT NMR. J Inorg Biochem. 1990;38:327–345. doi: 10.1016/0162-0134(90)80006-j. [DOI] [PubMed] [Google Scholar]
- 17.Rudin CM, Yang Z, Schumaker LM, et al. Inhibition of glutathione synthesis reverses Bcl-2-mediated cisplatin resistance. Cancer Res. 2003;63:312–318. [PubMed] [Google Scholar]
- 18.Anderson CP, Tsai JM, Meek WE, et al. Depletion of glutathione by buthionine sulfoxine is cytotoxic for human neuroblastoma cell lines via apoptosis. Exp Cell Res. 1999;246:183–192. doi: 10.1006/excr.1998.4303. [DOI] [PubMed] [Google Scholar]
- 19.Tew KD, Houghton PJ, Houghton JA. Preclinical and clinical modulation of anticancer drugs. Preclinical and clinical modulation of anticancer drugs. Boca Raton: CRC; 1993. pp. 13–17. [Google Scholar]
- 20.Kobrinsky NL, Sjolander DE, Goldenberg JA, et al. Successful treatment of doxorubicin and cisplatin resistant hepatoblastoma in a child with Beckwith–Wiedemann syndrome with high dose acetaminophen and N-acetylcysteine rescue. Pediatr Blood Cancer. 2005;45:222–225. doi: 10.1002/pbc.20330. [DOI] [PubMed] [Google Scholar]
- 21.Neuwelt AJ, Wu YJ, Knap N, et al. Using acetaminophen’s toxicity mechanism to enhance cisplatin efficacy in hepatocarcinoma and hepatoblastoma cell lines. Neoplasia. 2009;11:1003–1011. doi: 10.1593/neo.09688. [DOI] [PMC free article] [PubMed] [Google Scholar]
- 22.O’Dwyer PJ, Hamilton TC, LaCreta FP, et al. Phase I trial of buthionine sulfoximine in combination with melphalan in patients with cancer. J Clin Oncol. 1996;14:249–256. doi: 10.1200/JCO.1996.14.1.249. [DOI] [PubMed] [Google Scholar]
- 23.McGill MR, Yan HM, Ramachandran A, et al. HepaRG cells: A human model to study mechanisms of acetaminophen hepatotoxicity. Hepatology. 2011;53:974–982. doi: 10.1002/hep.24132. [DOI] [PMC free article] [PubMed] [Google Scholar]
- 24.Schmidt A, Braeuning A, Ruck P, et al. Differential expression of glutamine synthetase and cytochrome P450 isoforms in human hepatoblastoma. Toxicology. 2011;281:7–14. doi: 10.1016/j.tox.2011.01.006. [DOI] [PubMed] [Google Scholar]
- 25.Wolchok JD, Williams L, Pinto JT, et al. Phase I trial of high dose paracetamol and carmustine in patients with metastatic melanoma. Melanoma Res. 2003;13:189–196. doi: 10.1097/00008390-200304000-00013. [DOI] [PubMed] [Google Scholar]
- 26.Brown M, Bjorksten A, Medved I, et al. Pharmacokinetics of intravenous N-acetylcysteine in men at rest and during exercise. Eur J Clin Pharmacol. 2004;60:717–723. doi: 10.1007/s00228-004-0862-9. [DOI] [PubMed] [Google Scholar]
- 27.Straathof CS, van den Bent MJ, Ma J, et al. The effect of dexamethasone on the uptake of cisplatin in 9L glioma and the area of brain around tumor. J Neuro-Oncol. 1998;37:1–8. doi: 10.1023/a:1005835212246. [DOI] [PubMed] [Google Scholar]
- 28.Birks DK, Donson AM, Patel PR, et al. High expression of BMP pathway genes distinguishes a subset of atypical teratoid/rhabdoid tumors associated with shorter survival. Neuro Oncol. 2011;13:1296–1307. doi: 10.1093/neuonc/nor140. [DOI] [PMC free article] [PubMed] [Google Scholar]
Associated Data
This section collects any data citations, data availability statements, or supplementary materials included in this article.