

Abstract
ATP, the molecule used by living organisms to supply energy to many different metabolic processes, is synthesized mostly by the ATPase synthase using a proton or sodium gradient generated across a lipid membrane. We present evidence that a modified electrode surface integrating a NiFeSe hydrogenase and a F1F0‐ATPase in a lipid membrane can couple the electrochemical oxidation of H2 to the synthesis of ATP. This electrode‐assisted conversion of H2 gas into ATP could serve to generate this biochemical fuel locally when required in biomedical devices or enzymatic synthesis of valuable products.
Keywords: bioelectrochemistry, biophysics, immobilization, membrane proteins, proton transport
Nature uses strategies to manage energy conversion between different sources that would be interesting to mimic artificially for their use in the development of man‐made devices. At the cellular and molecular level, the transduction of energy is linked to the vectorial transfer of ions across a membrane.1 Energy stored as an electrochemical gradient is invested into several key biochemical processes: transfer of certain biomolecules against a concentration gradient,2 chemical synthesis of ATP,3 or rotation of bacterial flagella.4 During respiration and photosynthesis, energy obtained from either chemical oxidation or light, respectively, a proton gradient is created between two compartments separated by a lipid bilayer. This gradient is used to drive the enzyme F1F0‐ATPase to produce ATP, the molecule that will convey this captured energy to many metabolic processes required by the cell.
In the quest to develop biomimetic devices, the ability to harness and transduce energy at the molecular level is a significant challenge. Great progress in immobilizing enzymes has allowed the exploitation of their substrate specificity to catalyze chemical reactions for industrial applications5 and to develop biosensors with great selectivity and capacity to detect analytes.6 However, to mimic and utilize the vectorial ion movement required for the generation of electrochemical gradients in living cells, both spatial control over the assembly of the participating proteins,7 and the presence and maintenance of two independent ion‐impermeable compartments are required.8 Liposomes,9 where a lipid bilayer separates the inner content from the outer solution, have been used as model systems to couple light energy to different biochemical reactions. The proton gradient developed by a light‐sensitive component, either bacteriorhodopsin or an artificial photosynthetic reaction center, has been coupled to Ca2+ active transport,10 to ATP synthesis9b or to activate bacterial pumps.11 Liposomes are fragile, however, and increased robustness is desired for in vitro applications that require coupling artificially generated electrochemical gradients to solid transducers, such as lab‐scale biosensors and biomimetic fuel cells. One strategy to improve the robustness of liposomes that maintain proton gradients generated by light, cytochrome oxidase, or by F1F0‐ATPase has been to deposit the lipid membranes on different solid surfaces: silica particles,12 polymersomes,13 electrode surfaces,14 and nanowires.15 An additional challenge is coupling the different energy sources, such as electricity and molecular hydrogen (H2), to ATP synthesis in artificial systems.
In this work we present a system where H2 is used to fuel ATP synthesis on an electrode surface modified to include two oriented proteins and a lipid membrane. Previously, we demonstrated that a proton gradient could be produced by electroenzymatic H2 oxidation on an electrode surface covered by a phospholipid bilayer (PhBL).16 We now show that this proton gradient can be harnessed to synthesize ATP when a membrane‐bound NiFeSe hydrogenase and an ATPase are co‐immobilized on a flat gold electrode surface in the presence of a lipid membrane (Figure 1).
Figure 1.
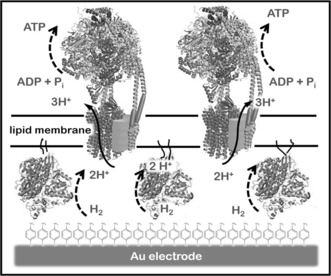
A) Representation of the supramolecular construction to synthesize ATP from enzymatic H2 electroxidation. NiFeSe hydrogen‐ase (Hase) immobilized covalently on an Au electrode modified with a SAM of 4‐aminothiophenol and anchored to a PhBL through its lipid tail.16a The PhBL embeds F1F0‐ATPases. Protons (H+) produced from H2 electroxidation are used to synthesize ATP from ADP and inorganic phosphate (Pi).
The assembly process was followed using atomic force microscopy (AFM) and quartz crystal microbalance (QCM) to characterize the biomimetic construction, and electrochemistry combined with UV spectroscopy to evaluate its functional properties. The assembly was done sequentially, following the steps previously described to covalently bind the hydrogenase on the electrode surface with the appropriate orientation for direct electron transfer.16a, 17 Once this first protein layer was characterized, the proteoliposomes containing the E. coli F1F0‐ATPase were incubated overnight in the presence of polystyrene beads to remove excess detergent and allow their fusion to the surface.
The AFM images (Figure 2 A–C), taken on flat annealed gold substrates prepared in parallel to the gold wires used for the electrochemical measurements, confirm that each modification step changed the surface as expected. Figure 2 A reflects the typical terraces found on flame‐annealed gold. Figure 2 B illustrates the appearance of a hydrogenase monolayer with a surface roughness of 5 nm after its covalent binding to the gold surface modified with a self‐assembled monolayer (SAM) of 4‐aminothiophenol. This roughness corresponds to that expected for a monolayer of hydrogenase molecules considering the enzyme dimensions.18 Figure 2 C illustrates that fusion of the proteoliposomes containing ATPase smooths the underlying roughness, but shows protrusions corresponding to the membrane‐embedded ATPase. The fact that protrusions are only seen on top of the bilayer indicates that the proteins are inserted with only one orientation, with the large F1 soluble domain sitting away from the substrate. Oriented protein insertion on lipid surfaces when using detergent‐destabilized bilayers has been previously reported.19 Figure S1 (Supporting Information) shows the height profile of the different surfaces shown in Figure 2 A–C.
Figure 2.
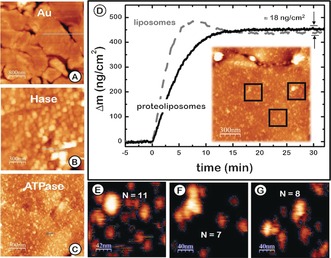
A–C) AFM topography images of A) the bare annealed gold surface, B) the Hase monolayer and C) the F1Fo ATPase reconstituted into the PhBL spread on the Hase monolayer. D) QCM monitoring of liposome (dashed line) and F1F0 proteoliposome (solid line) adsorption to a SiO2 surface. Inset: AFM image of an F1F0‐ATPase‐containing PhBL. E–G) Three regions from AFM image in (D) used to estimate the average number of proteins protruding more than 5 nm (N=9 per 200×200 nm2 ).
Panel D in Figure 2 presents the surface density measured with the QCM when F1F0‐ATPase proteoliposomes, of the same composition used for covering the gold electrodes, were fused over a SiO2 surface. Liposomes adsorb readily to the surface and break after 5 minutes, releasing water and forming the bilayer. The fast and transient increase in mass observed in the trace reflects this behavior.20 Proteoliposomes break more easily and form a bilayer upon interaction with the surface, showing slower surface binding kinetics without a transient increase in mass. The difference in mass detected after fusing liposomes, with and without proteins, and the number of protrusions detected per unit area on the AFM images were used to estimate the amount of protein present on the modified electrodes. SiO2 surfaces modified with proteoliposomes showed an increase in mass of 18 ng cm−2. The average number of protrusions per cm2 estimated from the AFM images is 2×10¹⁰. However, their size is not homogeneous and is larger than expected for individual molecules, indicating that each protrusion is likely to include more than one protein.21 The MW of the F1F0‐ATPase is ≈500 kD, so the expected mass increase for the average number of protrusions observed is indeed ≈18 ng cm−2. As the protrusions are not single proteins, this surface concentration would represent a lower limit of proteins present on the surface. The QCM registered the fusion of proteoliposomes directly onto a SiO2 surface. However, the amount of protein on the gold surface observed with the AFM is clearly larger. A more convenient way to estimate the mass content is to evaluate the percentage of the area covered by the protein from the AFM images. This estimate indicates that 30–40 % of the surface is covered by protein. Considering that a compact layer of F1F0‐ATPase would give approximately 1000 ng cm−2, the amount of protein on the gold surface would be 350 ng cm−2. This information was used to estimate the turnover rate of the F1F0‐ATPase on the electrode (see below).
To study the functionality of the fully modified electrode including both enzymes, we activated the Hase in an anaerobic chamber under 1 atm of H2 and subsequently performed a cyclic voltammogram sweep from −0.6 to +0.2 V to check the bioelectrocatalytic response in phosphate buffer. The increase of the anodic current, which reached a plateau at −0.2 V, was attributed to the oxidation of H2 to protons (Figure 3 A).13, 14 We previously showed that under these conditions the pH of the buffered bulk solution remains constant.16a In the following experiment (Figure 3 B), protons were generated at the PhBL/electrode interface of the biomimetic construction by applying a continuous potential of +150 mV (vs. SCE) during 130 min in the presence of 500 μm ADP, under 1 atm of H2, and stirring. Aliquots were taken periodically from the bulk solution to measure the ATP concentration by a spectrophotometric method.22 Control measurements were recorded with PhBL‐modified electrodes in the absence of either Hase or F1F0‐ATPase (Figure 3 B). The experiments showed that ATP production was detected in the bulk solution during hydrogen oxidation catalyzed by the immobilized hydrogenase only when F1F0‐ATPase, ADP, and phosphate were present. ATP detection was negligible in the control experiments performed with electrodes incorporating only one enzyme, either ATPase from the proteoliposomes deposited directly on the gold electrode surface, or the hydrogenase covalently bound to the electrode and covered by the PhBL.16a We also observed that at longer times, the rate of ATP production decreases. It is likely that the long‐term exposure to H2 at 37 °C, conditions at which the experiment is performed, favors the desorption of the SAM monolayer, thereby affecting the orientation and availability of the hydrogenase. Furthermore, the positive potential at which the experiments are run could also cause a certain extent of hydrogenase inactivation. Both effects could be contributing to the decrease in ATP production observed over long intervals.
Figure 3.
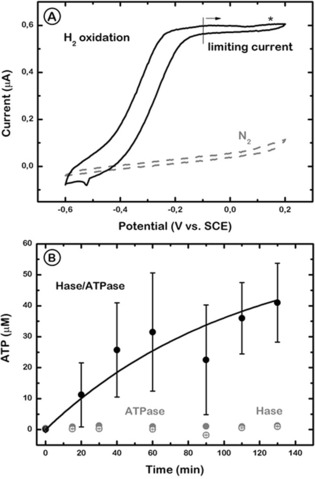
A) Cyclic voltammograms of the Hase/PhBL/ATPase‐modified electrode in 0.1 m phosphate buffer (pH 8.0) after Hase activation through H2 incubation (solid line) or under N2 before activation (dashed line). The star indicates the redox potential (150 mV vs. SCE) applied to drive ATP production. Scan rate=0.01 V s−1. Temperature=30 °C. B) ATP synthesis from ADP and phosphate in 0.1 m phosphate buffer (pH 8.0) at 150 mV and under 1 atm H2. ATP concentration in the bulk solution is shown as a function of time for Hase/PhBL/ATPase (black solid circles), PhBL/ATPase (gray solid circles), and Hase/PhBL (gray open circles) electrodes. Error bars=standard deviation of three measurements made from different electrode preparations.
The value for the turnover rate of ATP synthesis measured is strongly dependent on the experimental setup and conditions. Reported values range from 40–210 ATP s−1 observed on liposomes energized by an acid‐base transition,23 to 7 ATP s−1 measured for the light‐driven protein inserted in liposomes,9b or the much smaller 1.5×10⁻⁴ ATP s−1 turnover rate detected when the proton gradient was produced by bacteriorhodopsin in polymerosomes.13 In our experiments, considering that the amount of protein on the flat gold surface is 350 ng cm−2, the average ATP synthase turnover rate is around 1800 s−1, much higher than values previously reported. One possible explanation is that the high hydrogenase turnover rate (up to 900 s−1 for H2 oxidation)24 and the rapid diffusion of H2 across lipid membranes allows a quick and constant establishment of a proton gradient at the electrode interface,16a even if the supported PhBL may leak protons owing the presence of defects in its configuration.16b This net proton gradient across the PhBL of over one pH unit16a in the adequate direction is sufficient to drive the reconstituted F1F0‐ATPase (Figure 1) to produce ATP from ADP and phosphate. An additional consideration is that, as the activity measurements were performed on gold wires and not flat surfaces, it could be that the F1F0‐ATPase density on the wire is larger, which would mean that each individual protein has a smaller turnover than this estimate.
Nevertheless, this estimated turnover rate can only be considered an indication that the enzyme has a higher turnover for ATP synthesis when the system is fueled with H2 than when it is energized using light or acid‐base transitions. Information about the exact amount of protein and its orientation is needed to obtain a reliable turnover rate to confirm this observation.
We also tested the capacity of the F1F0‐ATPase incorporated into the lipid bilayer fused on an electrode to hydrolyze ATP and to generate a proton gradient in the absence of the hydrogenase (Figure 4 A). Pyrophosphate detection in the bulk solution by a spectrophotometric method was used to measure ATP hydrolysis (Figure 4 B), and the proton gradient was detected by differential pulse voltametry (DPV) following the shift in the oxidation peak of the SAM over the Au surface upon changes of the local pH at the electrode/PhBL interface (Figure 4 C).16a
Figure 4.
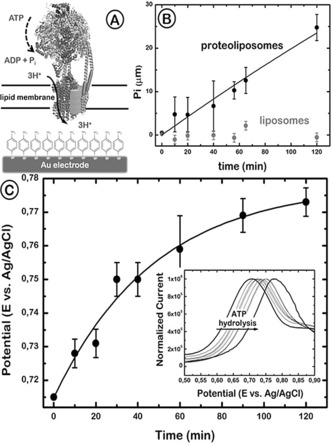
A) Representation of the PhBL reconstituted with F1F0‐ATP synthase over an Au electrode. The ATP hydrolysis by F1F0 leads to proton pumping across the membrane, which results in a decrease of the pH of the aqueous compartment between the lipid membrane and the Au electrode surface. B) ATP hydrolysis monitored by phosphate production as a function of time for a F1F0‐proteoliposome‐modified electrode (black circles) and for a bare liposome‐modified electrode (gray circles). The initial ATP concentration was 150 µm and the temperature was 37 °C. C) The simultaneous proton pumping activity of F1F0‐ATP synthase was monitored over time by differential pulse voltammetry (inset). The oxidation peak potential of the SAM on Au is shown as a function of time after ATP hydrolysis started. Error bars=standard deviation of two independent measurements.
The electrode modified with F1F0‐ATPase proteoliposomes was incubated in Tris HCl Buffer at 37 °C, pH 8. ATP was added to the solution, and the inorganic phosphate (Pi) concentration was monitored over 120 minutes, revealing a nearly linear increase (Figure 4 B). The same experiment carried out with an electrode modified with liposomes without ATPase did not yield any significant amount of Pi (Figure 4 B).
In parallel, the pH at the electrode/PhBL interface was measured using a procedure previously described.16a The SAM present on the gold surface can act as pH‐sensitive probe because its redox potential is pH‐dependent. The proteoliposome‐modified electrode was submitted to 15 cyclic voltammetry scans between 0 and 1 V (vs. Ag/AgCl), causing a partial dimerization of the aminophenol derivatives. After incubating the electrode in the ATP solution, the shift in the oxidation peak of the dimerized 4‐aminothiophenol measured by DPV is attributed to the pH change at the electrode/PhBL interface associated with the ATP hydrolysis activity of the reconstituted F1F0‐ATPase. The result obtained from two independent experiments (Figure 4 C) indicated a peak potential shift from 715 to 775 mV. This +60 mV shift corresponded to one pH unit13a and stabilized after 60 minutes of incubation, whereas the Pi detected showed an apparent linear production up to 120 minutes (Figure 4). The hydrolysis rate measured was 0.28 μm min−1, which gives a turnover rate of 788 ATP s−1. The reason for the stabilization of the pH gradient at longer times, in spite of the linear increase in Pi production, is not clear. It could be that a membrane potential builds up across the lipid bilayer, preventing further proton translocation.
This is not the first time that a membrane‐bound F1F0‐ATPase was reconstituted onto an electrode surface,14 and that the proton gradient generated during ATP hydrolysis was monitored electrochemically. Previously, the translocation of protons across the lipid film was investigated using square wave voltammetry (SWV), double potential‐pulse chronoamperometry (CA), or impedance spectroscopy, with the aim of correlating the activity of the enzyme with electrochemical processes occurring at the gold electrode.14b, 14c The authors demonstrated it was possible to measure ion transport through a protein as a function of membrane potential, which is difficult to measure on other reconstituted systems. However, in our setup we were able to go beyond the state of the art in two ways: we have managed to measure directly the pH shift generated on the electrode surface owing to the ATPase activity, and we have managed to synthesize ATP by coupling the F1F0‐ATPase activity with the proton gradient generated by the bioelectrooxidation of H2 at the PhBL/interface. We showed that the reconstituted F1F0‐ATPase is reversible, capable of synthesizing ATP in the presence of a proton gradient, or generating a proton gradient upon ATP consumption.
In summary, we demonstrated that a modified electrode integrating a NiFeSe hydrogenase, F1F0‐ATPase, and a lipid membrane can serve to couple the electrochemical H2 oxidation to ATP synthesis. Electrode‐assisted interconversion between these two valuable and versatile fuels could open new possibilities for using H2 gas to locally generate ATP needed for reactions in biomedical devices or the enzymatic organic synthesis of valuable products. Although the oxygen sensitivity of hydrogenases imposes important restrictions for the development of practical devices in a laboratory environment, the high turnover of electroenzymatic H2 oxidation allows a much faster proton gradient formation across the membrane compared to those generated by light.9b, 12a Therefore, this enzymatic system will still be advantageous to artificially fuel ATP synthesis.
Experimental Section
The NiFeSe Hase from Desulfovibrio vulgaris Hildenborough was isolated and purified as reported previously.24, 25 F1F0‐ATPase from E. coli was purified as described in the Supporting Information. Au electrodes of 0.16 cm2 surface area were prepared and modified with a 4‐aminothiophenol SAM as described previously.26 Au/4‐aminothiophenol SAM/Dv‐SeHase/PhBL/ATPase electrodes were constructed by incubating, sequentially, the gold electrode in a 4‐aminothiophenol solution and then in a 12 μm solution of Dv‐SeHase, in 0.1 mm phosphate buffer (pH 5.5) with 0.1 % n‐dodecyl‐β‐d‐maltoside, (DDM) at 48 °C. The electrodes were then incubated for 30 min in a 21 mm solution of N‐(3‐dimethylaminopropyl)‐N′‐ethylcarbodiimide hydrochloride in 50 mm Tris‐HCl buffer (pH 6.0) with 0.1 % DDM. Finally, the electrodes were incubated overnight in a 0.2 mg mL−1 proteoliposome suspension in the presence of 240 mg mL−1 Calbiosorb adsorbent biobeads (Calbiochem). Electrochemical, AFM, and QCM measurements were carried out as reported previously.16a, 17, 27 Inorganic phosphate (Pi) determination was performed by the Green Malachite assay.28 ATP concentration was measured using the Luciferase assay kit from Molecular Probes..
In memory of Philippe Devaux
Supporting information
As a service to our authors and readers, this journal provides supporting information supplied by the authors. Such materials are peer reviewed and may be re‐organized for online delivery, but are not copy‐edited or typeset. Technical support issues arising from supporting information (other than missing files) should be addressed to the authors.
Supplementary
Acknowledgements
This research was funded by the Spanish MINECO (project CTQ2012‐32448 and CTQ2015‐71290‐R) and by the Fundacão para a Ciência e a Tecnologia (project PTDC/BBB‐ EP/0934/2012 and UID/Multi/04551/2013). O.G.‐S. thanks MINECO for an FPI grant. ILM acknowledges the European Research Council (ERC), grant no. ERC‐StG‐2013‐338133 titled “MITOCHON” and the “Ramón y Cajal” program (RyC‐2013‐12609) from the Spanish Ministry of Economy. PN acknowledges Dr. rer. nat. Gabriele Deckers‐Hebestreit (Universität Osnabrück) for the generous gift of F1beta‐ and F0‐b subunit specific antibodies.
Ó. Gutiérrez-Sanz, P. Natale, I. Márquez, M. C. Marques, S. Zacarias, M. Pita, I. A. C. Pereira, I. López-Montero, A. L. De Lacey, M. Vélez, Angew. Chem. Int. Ed. 2016, 55, 6216.
Contributor Information
Dr. Iván López‐Montero, Email: ivanlopez@quim.ucm.es
Dr. Antonio L. De Lacey, Email: alopez@icp.csic.es
Dr. Marisela Vélez, Email: marisela.velez@icp.csic.es
References
- 1. Nicholls S. F. David G., Bioenergetics 4, Academic Press, 2013. [Google Scholar]
- 2. Shi Y., Annu. Rev. Biophys. 2013, 42, 51. [DOI] [PubMed] [Google Scholar]
- 3. Junge W., Nelson N., Annu. Rev. Biochem. 2015, 84, 631. [DOI] [PubMed] [Google Scholar]
- 4.
- 4a. Minamino T., Imada K., Trends Microbiol. 2015, 23, 267–274; [DOI] [PubMed] [Google Scholar]
- 4b. Kojima S., Curr. Opin. Microbiol. 2015, 28, 66. [DOI] [PubMed] [Google Scholar]
- 5. Garcia-Galan C., Berenguer-Murcia Á., Fernandez-Lafuente R., Rodrigues R. C., Adv. Synth. Catal. 2011, 353, 2885. [Google Scholar]
- 6. Turner A. P. F., Chem. Soc. Rev. 2013, 42, 3184. [DOI] [PubMed] [Google Scholar]
- 7. McMillan D. G. G., Marritt S. J., Firer-Sherwood M. A., Shi L., Richardson D. J., Evans S. D., Elliott S. J., Butt J. N., Jeuken L. J. C., J. Am. Chem. Soc. 2013, 135, 10550. [DOI] [PMC free article] [PubMed] [Google Scholar]
- 8. Bhattacharya S., Schiavone M., Nayak A., Bhattacharya S. K., Biotechnol. Appl. Biochem. 2004, 39, 293. [DOI] [PubMed] [Google Scholar]
- 9.
- 9a. Steinberg-Yfrach G., Liddell P. A., Hung S.-C., Moore A. L., Gust D., Moore T. A., Nature 1997, 385, 239–241; [Google Scholar]
- 9b. Steinberg-Yfrach G., Rigaud J.-L., Durantini E. N., Moore A. L., Gust D., Moore T. A., Nature 1998, 392, 479–482. [DOI] [PubMed] [Google Scholar]
- 10. Bennett I. M., Farfano H. M. V., Bogani F., Primak A., Liddell P. A., Otero L., Sereno L., Silber J. J., Moore A. L., Moore T. A., Gust D., Nature 2002, 420, 398–401. [DOI] [PubMed] [Google Scholar]
- 11.
- 11a. Verchère A., Broutin I., Picard M., Sci. Rep. 2012, 2, 306; [DOI] [PMC free article] [PubMed] [Google Scholar]
- 11b. Wendell D., Todd J., Montemagno C., Nano Lett. 2010, 10, 3231–3236. [DOI] [PubMed] [Google Scholar]
- 12.
- 12a. Luo T.-J. M., Soong R., Lan E., Dunn B., Montemagno C., Nat. Mater. 2005, 4, 220–224; [DOI] [PubMed] [Google Scholar]
- 12b. Nordlund G., Sing Ng J. B., Bergström L., Brzezinski P., ACS Nano 2009, 3, 2639–2646. [DOI] [PubMed] [Google Scholar]
- 13. Choi H.-J., Montemagno C. D., Nano Lett. 2005, 5, 2538–2542. [DOI] [PubMed] [Google Scholar]
- 14.
- 14a. Naumann R., Jonczyk A., Kopp R., van Esch J., Ringsdorf H., Knoll W., Gräber P., Angew. Chem. Int. Ed. Engl. 1995, 34, 2056; [Google Scholar]; Angew. Chem. 1995, 107, 2168; [Google Scholar]
- 14b. Naumann R., Jonczyk A., Hampel C., Ringsdorf H., Knoll W., Bunjes N., Gräber P., Bioelectrochem. Bioenerg. 1997, 42, 241; [Google Scholar]
- 14c. Naumann R., Baumgart T., Gräber P., Jonczyk A., Offenhäusser A., Knoll W., Biosens. Bioelectron. 2002, 17, 25. [DOI] [PubMed] [Google Scholar]
- 15.
- 15a. Ge C., Orosz K. S., Armstrong N. R., Saavedra S. S., ACS Appl. Mater. Interfaces 2011, 3, 2677; [DOI] [PMC free article] [PubMed] [Google Scholar]
- 15b. McBee T. W., Wang L., Ge C., Beam B. M., Moore A. L., Gust D., Moore T. A., Armstrong N. R., Saavedra S. S., J. Am. Chem. Soc. 2006, 128, 2184. [DOI] [PubMed] [Google Scholar]
- 16.
- 16a. Gutiérrez-Sanz Ó., Tapia C., Marques M. C., Zacarias S., Vélez M., Pereira I. A. C., De Lacey A. L., Angew. Chem. Int. Ed. 2015, 54, 2684; [DOI] [PubMed] [Google Scholar]; Angew. Chem. 2015, 127, 2722; [Google Scholar]
- 16b. Gutiérrez-Sanz O., Marques M., Pereira I. A. C., De Lacey A. L., Lubitz W., Rüdiger O., J. Phys. Chem. Lett. 2013, 4, 2794. [Google Scholar]
- 17. Gutiérrez-Sánchez C., Olea D., Marques M., Fernández V. M., Pereira I. A. C., Vélez M., De Lacey A. L., Langmuir 2011, 27, 6449. [DOI] [PubMed] [Google Scholar]
- 18. Marques M. C., Coelho R., De Lacey A. L., Pereira I. A. C., Matias P. M., J. Mol. Biol. 2010, 396, 893. [DOI] [PubMed] [Google Scholar]
- 19. Milhiet P.-E., Gubellini F., Berquand A., Dosset P., Rigaud J.-L., Le Grimellec C., Lévy D., Biophys. J. 2006, 91, 3268. [DOI] [PMC free article] [PubMed] [Google Scholar]
- 20. Cho N. J., Frank C. W., Kasemo B., Hook F., Nat. Protoc. 2010, 5, 1096. [DOI] [PubMed] [Google Scholar]
- 21. Minauro-Sanmiguel F., Wilkens S., Garcia J., Proc. Natl. Acad. Sci. USA 2005, 102, 12356. [DOI] [PMC free article] [PubMed] [Google Scholar]
- 22. Karamohamed S., Guidotti G., BioTechniques 2001, 31, 420. [DOI] [PubMed] [Google Scholar]
- 23. Fischer S., Gräber P., Turina P., J. Biol. Chem. 2000, 275, 30157. [DOI] [PubMed] [Google Scholar]
- 24. Valente F. A., Oliveira A. S., Gnadt N., Pacheco I., Coelho A., Xavier A., Teixeira M., Soares C., Pereira I. C., J. Biol. Inorg. Chem. 2005, 10, 667. [DOI] [PubMed] [Google Scholar]
- 25.
- 25a. Gutiérrez-Sanz O., Marques M., Baltazar C. A., Fernández V., Soares C., Pereira I. C., De Lacey A., J. Biol. Inorg. Chem. 2013, 18, 419; [DOI] [PubMed] [Google Scholar]
- 25b. van der Does C., de Keyzer J., van der Laan M., Driessen A. J. M., Methods Enzymol. 2003, 372, 86. [DOI] [PubMed] [Google Scholar]
- 26. Gutiérrez-Sanz O., Olea D., Pita M., Batista A. P., Alonso A., Pereira M. M., Vélez M., De Lacey A. L., Langmuir 2014, 30, 9007. [DOI] [PubMed] [Google Scholar]
- 27. Mateos-Gil P., Márquez I., López-Navajas P., Jiménez M., Vicente M., Mingorance J., Rivas G., Vélez M., Biochim. Biophys. Acta Biomembranes 2012, 1818, 806. [DOI] [PubMed] [Google Scholar]
- 28. Lanzetta P. A., Alvarez L. J., Reinach P. S., Candia O. A., Anal. Biochem. 1979, 100, 95. [DOI] [PubMed] [Google Scholar]
Associated Data
This section collects any data citations, data availability statements, or supplementary materials included in this article.
Supplementary Materials
As a service to our authors and readers, this journal provides supporting information supplied by the authors. Such materials are peer reviewed and may be re‐organized for online delivery, but are not copy‐edited or typeset. Technical support issues arising from supporting information (other than missing files) should be addressed to the authors.
Supplementary