

ABSTRACT
Biomarkers such as DNA, RNA, and protein are powerful tools in clinical diagnostics and therapeutic development for many diseases. Identifying RNA expression at the single cell level within the morphological context by RNA in situ hybridization provides a great deal of information on gene expression changes over conventional techniques that analyze bulk tissue, yet widespread use of this technique in the clinical setting has been hampered by the dearth of automated RNA ISH assays. Here we present an automated version of the RNA ISH technology RNAscope that is adaptable to multiple automation platforms. The automated RNAscope assay yields a high signal‐to‐noise ratio with little to no background staining and results comparable to the manual assay. In addition, the automated duplex RNAscope assay was able to detect two biomarkers simultaneously. Lastly, assay consistency and reproducibility were confirmed by quantification of TATA‐box binding protein (TBP) mRNA signals across multiple lots and multiple experiments. Taken together, the data presented in this study demonstrate that the automated RNAscope technology is a high performance RNA ISH assay with broad applicability in biomarker research and diagnostic assay development. J. Cell. Biochem. 117: 2201–2208, 2016. © 2016 The Authors. Journal of Cellular Biochemistry Published by Wiley Periodicals, Inc.
Keywords: IN SITU HYBRIDIZATION, RNA, RNAscope, GENE EXPRESSION, BIOMARKER, AUTOMATION
Biomarkers play critical roles in the diagnosis of clinical diseases as well as therapeutic development [Sotiriou and Piccart, 2007]. RNA has recently emerged as a means to discover novel biomarkers, as it is an ideal indicator of the dynamic genetic expression changes in a cell [Sotiriou and Piccart, 2007]. Traditional techniques that analyze RNA in bulk tissue or cell populations, such as qPCR, mask the cell‐to‐cell variations in gene expression [Wong and Medrano, 2005]. New single‐cell sequencing and expression analysis techniques can detect RNA at the single‐cell level, but require isolation of single cells from their native context, resulting in the loss of information on the spatial relationship of the analyzed cells [Grun and van Oudenaarden, 2015]. Spatially mapped expression data at the single‐cell level is crucial to understanding cellular organization and cell‐to‐cell interactions in complex tissue [Levsky and Singer, 2003; Matos et al., 2010]. Mapping RNA expression to single cells is possible with traditional RNA in situ hybridization (ISH) techniques, but it has been hampered by the limited performance and high technical complexity of these methods [Cassidy and Jones, 2014].
The RNAscope® method is a significant advancement in RNA ISH technology that addresses the challenges of traditional RNA ISH while providing single‐cell expression resolution with spatial and morphological context [Wang et al., 2012, 2014a,2014b,2014c]. It employs a unique signal amplification strategy that allows for the visualization of target RNAs as punctate dots, where each dot represents an individual RNA molecule. The key benefits of the RNAscope assay are high sensitivity due to its signal amplification strategy, high specificity as a result of the RNAscope probe design minimizing non‐specific off‐target signals, and detection and quantification of RNA with spatial and morphological context.
While the manual RNAscope assay has been well established as an important tool in detecting RNA in situ in a variety of applications [Tubbs et al., 2013; Du et al., 2015; Wang et al., 2014c], there is also a strong need for a reliable and consistent automated RNA ISH assay. Development of an automated RNA ISH assay would greatly improve the utility of RNA ISH in the clinical setting by allowing for more samples to be run in a standardized manner with minimized inter‐user variability and less hands‐on time, allowing for more consistently reproducible results. Therefore, we sought to develop an automated version of the RNAscope technology. We previously reported the development of an automated RNAscope assay for the detection of HER2 in invasive breast carcinomas [Wang et al., 2013]. In this study we report the most current version of the automated RNAscope assay that is adaptable to multiple automated platforms, including Leica and Roche Ventana systems. We demonstrate that this automated RNAscope assay yields a high signal‐to‐noise ratio with little to no background staining and intense punctate dots. Automated duplex detection allows two target genes to be mapped to single cells simultaneously. Lastly, we show consistency and reproducibility among reagent lots and run‐to‐run performance, as well as quantification of transcript levels in spatially‐preserved individual cells using advanced image analysis software. Overall these results position the automated RNAscope platform as a new tool for in situ gene expression analysis of cells and tissues with strong potential for utilization in the clinical diagnostics setting.
MATERIALS AND METHODS
TISSUE FIXATION AND PREPARATION CONDITIONS
Sections from HeLa cell pellets were obtained from Abbomax (San Jose, CA) at a thickness of 5 μm. Deidentified archival FFPE tissues from multiple human tumors were purchased from Tissue Solutions (Glasgow, UK). Tissues were fixed in 10% neutral‐buffered formalin (NBF) for 24 h, followed by dehydration and infiltration with paraffin using an automated processor and then manual embedding in paraffin wax molds. After hardening, tissues were sectioned at a thickness of 5 μm. Tissue quality was assessed by performing RNAscope analysis for mRNA of the housekeeping gene peptidylprolyl isomerase B (PPIB).
RNAscope ISH ASSAY
For the manual single‐plex RNAscope assays, tissue sections were baked for 1 h at 60°C, deparaffinized, and treated with pretreat 1 for 10 min at room temperature (RT). Target retrieval was performed for 15 min at 100°C, followed by protease treatment for 15 min at 40°C. Probes were then hybridized for 2 h at 40°C followed by RNAscope amplification followed by DAB chromogenic detection. For the single‐plex and duplex automated RNAscope assays on the Leica Biosystems BOND RX platform (LS), sections were baked and deparaffinized on the instrument, followed by target retrieval (15 min at 88°C for cell pellets and 15 min at 95°C for tissues using Leica Epitope Retrieval Buffer 2) and protease treatment (15 min at 40°C). Probes were then hybridized for 2 h at 42°C followed by RNAscope amplification. For the LS automated single‐plex assay, DAB chromogenic detection was then performed. For the LS automated duplex RNAscope assay, fast red chromogenic detection was performed first, followed by DAB chromogenic detection. For the fully automated RNAscope assay on the Roche Ventana Medical Systems DISCOVERY ULTRA platform (VS), sections were baked (32 min at 37°C) and deparaffinized on the instrument, followed by target retrieval (16 min at 97°C for cell pellets and 24 min at 97°C for tissues) and protease treatment (16 min at 37°C). Probes were then hybridized for 2 h at 43°C followed by RNAscope amplification and DAB chromogenic detection using VS detection reagents. RNAscope probe design has been previously described [Wang et al., 2012]. The following RNAscope probes were used in this study: dihydrodipicolinate reductase (dapB) (manual, cat. #310043; LS, cat. #312038; VS, cat. #312039), Hs‐PPIB (LS, cat. #313908; VS, cat. #313909), Hs‐TBP (manual, cat. #314291; LS, cat. #314298), Hs‐CD274 (PD‐L1) (LS, cat. #600868; VS, cat. #600869), Hs‐KRT19 (LS, cat. #310228), Hs‐PECAM1 (LS, cat. #548458‐C2), HPV‐HR18 (a pool of 18 genotypes for the HPV E6 and E7 genes) (LS, cat. #312598; VS, cat. #312599), and Hs‐CDKN2A (p16) (LS, cat. #310188‐C2).
The stained slides of each sample were analyzed using the RNAscope scoring system. RNAscope PPIB and dapB signal results were categorized into 5 grades according to the following scoring guidelines: score 0, no staining or less than 1 dot for every 10 cells (visible at 40x magnification); score 1, 1–3 dots per cell (visible at 20–40× magnification); score 2, 4–10 dots per cell with very few dot clusters (visible at 20–40× magnification); score 3, >10 dots per cell with less than 10% positive cells having dot clusters (visible at 20x magnification); score 4, >10 dots per cell with more than 10% positive cells having dot clusters (visible at 20x magnification). Samples with PPIB signal scores of 2 or higher and dapB background scores of 1 or lower were considered to pass qualification and were included in the analysis presented in this study. Samples with PPIB signal scores of 2 or lower and dapB background scores of 2 or higher were disqualified and omitted from the study.
MICROSCOPIC IMAGING
Images were acquired using a Leica Biosystems Aperio AT2 Digital Pathology scanner and analyzed using Aperio ImageScope imaging software.
DOT QUANTIFICATION
After the RNAscope assay was performed, the average number of dots per cell was quantified using the Halo imaging analysis algorithm (Indica Labs).
STATISTICAL ANALYSIS
The Prism analysis software was used to perform the statistical analyses. Differences between two groups were compared using an unpaired t‐test. Differences between three or more groups were analyzed using one way analysis of variance (ANOVA) followed by Tukey's post‐hoc test for multiple comparisons. A P value of <0.05 was considered statistically significant. Data are presented as the mean value and error bars represent SEM.
RESULTS
AUTOMATED RNAscope TECHNOLOGY AND METHOD
The RNA ISH assay used in this study is an improved version of the original RNAscope technology [Wang et al., 2012]. It employs the same probe design strategy as before (Fig. 1A) but has additional signal amplification steps to increase the size of signal dots for easier interpretation (Fig. 1B). The base of each Z probe contains the target binding site and consists of 18–25 nucleotides. A linker connects the base of the Z to the top of the Z, which contains the pre‐amplifier binding site (14 nucleotides). A pair of target probes (called a double Z or “ZZ”), complementary to two adjacent sequences on the target RNA, hybridize in tandem to the target region. Typically, an RNA sequence is targeted by 20 probe pairs, but as few as 3 probe pairs are sufficient for detection. This relatively large number of ZZ pairs provides further signal amplification and assures high detection efficiency even in partially degraded samples. After hybridization with the target RNA, each ZZ pair creates a 28‐nucleotide binding site (upper portion of ZZ) for the signal pre‐amplifier (Fig. 1Aii). Each pre‐amplifier can bind multiple amplifiers (Fig. 1Aiii), and each amplifier can further bind multiple labeled probes, sequentially hybridizing to assemble a branching complex at each ZZ binding site (Fig. 1Aiv). Labeled probes contain a chromogenic enzyme (e.g., horseradish peroxidase, HRP), generating visible signals after chromogenic reaction (e.g., 3,3′‐diaminobenzidine, DAB). This signal amplification strategy allows for visualization of target RNAs as a single dot, where each dot represents an individual RNA molecule (Fig. 1B).
Figure 1.
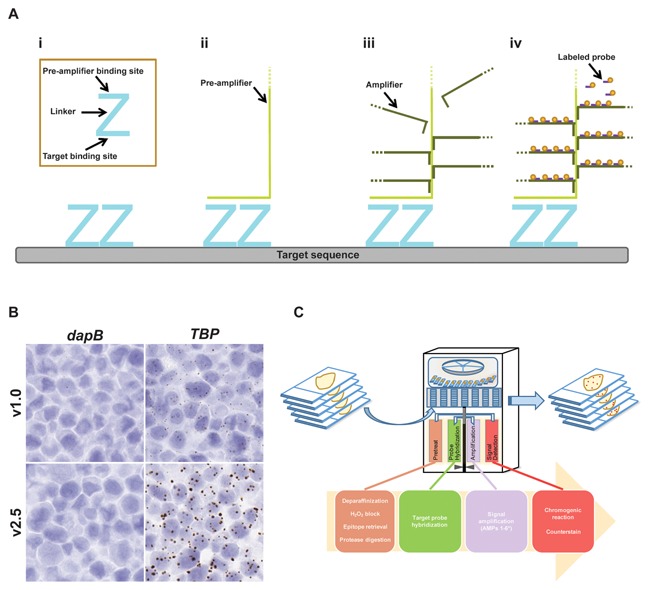
Automated RNAscope technology overview. (A) RNAscope probe design. (i) A standard target probe consists of a pool of 20 double Z probes targeting a region of 1000 bases. Each Z target probe contains three elements: the lower region is complementary to the target RNA and is selected for target specific hybridization and uniform hybridization properties; a spacer sequence links the lower region to an upper region; the two adjacent upper regions from a double Z target probe form a 28 base binding site for the pre‐amplifier. (ii) Once the Z probe pairs hybridize to the RNA target the pre‐amplifier binds to the upper regions of the Z probe pairs. (iii) Hybridization of multiple amplifiers per pre‐amplifier. (iv) Hybridization of multiple labeled probes per amplifier. Labeled probes contain a chromogenic enzyme to generate one punctate dot per RNA target. The size of the dot is directly proportional to the number of Z probe pairs hybridized onto the RNA target. Hybridization of only three Z probe pairs is sufficient to obtain a detectable signal by brightfield microscopy. (B) Current (v2.5) and previous (v1.0) versions of the manual RNAscope single‐plex assay were tested on FFPE sections of HeLa cells using either the negative control probe dapB or the positive control probe Hs‐TBP. Images are shown at 40× magnification. (C) General overview of the workflow for the automated single‐plex chromogenic RNA ISH assay for FFPE samples. *Ventana DISCOVERY ULTRA and XT platforms have an additional amplification step (Amplification Step 7).
The entire workflow of the RNAscope assay including pretreatment, probe hybridization, signal amplification, and signal detection is amenable to automation (Fig. 1C). Currently, fully automated RNAscope assays are available for the commonly used slide staining systems from Leica (BOND RX) and Roche Ventana (DISCOVERY ULTRA and XT). For FFPE samples using the chromogenic RNA ISH assay, pretreatment involves deparaffinization, peroxide treatment to block endogenous peroxidases, epitope retrieval, and protease digestion. The target probe is then hybridized to the target sequence, followed by a series of amplification steps. Signal detection is performed using DAB (brown), 4‐Chloro‐2‐methylbenzenediazonium/3‐Hydroxy‐2‐naphthoic acid 2,4‐dimethylanilide phosphate (fast red; red), or a black chromogen followed by visualization under standard light microscopy, and can also be quantified using image analysis software. In addition to FFPE samples, the automated RNAscope ISH assay is also compatible with fresh frozen tissue and fixed cells, however different pretreatment conditions are required for these samples compared to FFPE samples.
A HIGH SIGNAL‐TO‐NOISE RATIO IS MAINTAINED WITH THE AUTOMATED RNAscope PLATFORM
One of the fundamental challenges of traditional RNA ISH is that it can generate low signal and high background, compromising the interpretation and results of the assay. Therefore, we tested the ability of the automated RNAscope ISH technology described in Figure 1 to detect high signal with low background in FFPE tissues. Strong signal from the positive control probe PPIB was identified in human head and neck tumor samples while no signal was detected with the negative control probe dapB on both Leica (LS) and Ventana (VS) platforms (Fig. 2A, B, F, G). Detection of two clinically relevant markers, HPV‐HR18 (a pooled probe containing 18 subtypes of HPV viral transcripts) and the checkpoint marker programmed death ligand 1 (PD‐L1), in human head and neck tumor samples was achievable on both the LS and VS automated platforms using the RNAscope technology (Fig. 2C–E, H–J). The head and neck tumor case selected here was a low expressor of PD‐L1; PD‐L1 exhibits a wide range of expression in tumor tissues [Schalper et al., 2014]. Taken together, these results show that the automated RNAscope ISH assay on both Leica and Ventana systems is robust with a high signal‐to‐noise ratio.
Figure 2.
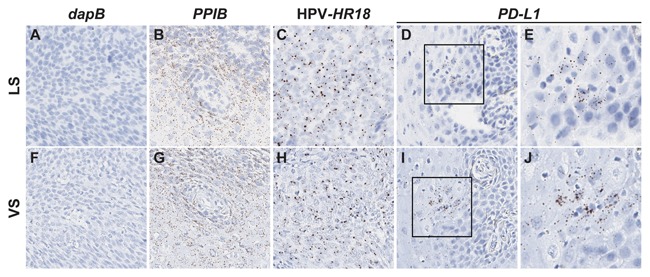
Automated RNAscope ISH assay detects high target signal with low background in human head and neck tumor on multiple platforms. Serial FFPE sections of a head and neck cancer case were stained with the automated RNAscope assay using the following probes: dapB (negative control), Hs‐PPIB (positive control), HPV‐HR18, and Hs‐PD‐L1. The assay was performed using either the Leica BOND RX (LS) or Roche Ventana DISCOVERY ULTRA (VS) automated platform. Signal was detected using DAB (brown) chromogen. Images are shown at either 10× (A–D, F–I) or 40× (E, J) magnification. Black boxes indicate regions shown at 40× magnification.
SIMULTANEOUS DETECTION OF TWO TARGET GENES USING THE AUTOMATED RNAscope DUPLEX ASSAY
Detection of more than one target gene is often desired to show co‐localization of the targets or expression of the target gene in a particular cell type. The tumor suppressor gene p16 and 18 subtypes of HPV E6/E7 transcripts were targeted concurrently in human head and neck and cervical cancer tumors using the Leica BOND RX platform (Fig. 3I–L). Detection of the two markers revealed expression in the same cells, demonstrating the ability of the automated RNAscope assay to detect two target genes in the same cell simultaneously. To determine if the signal detection of each individual target was compromised when performing the automated duplex RNAscope assay, signal detection of the single‐plex automated assay was compared to the duplex automated assay. No significant difference was observed between the automated single‐plex and duplex assays in the signal detection of either p16 or HPV‐HR18 (Fig. 3A–H). Taken together, these results show that the signal from two gene targets of interest in the same cell can be detected efficiently in the automated RNAscope duplex assay.
Figure 3.
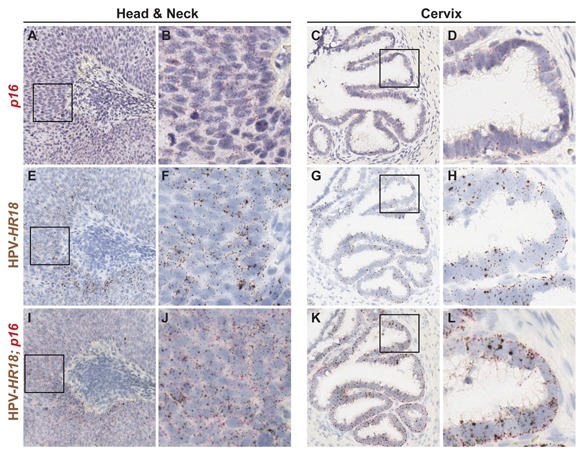
Simultaneous detection of two target genes within the same cell using the automated RNA ISH duplex assay. Serial FFPE sections from a head and neck (A, B, E, F, I, J) and cervical (C, D, G, H, K, L) cancer case were stained with the automated RNAscope duplex assay using the Leica BOND RX platform. The automated duplex RNAscope assay was performed to simultaneously detect p16 and the pooled probe HPV‐HR18 (which detects 18 high‐risk genotypes of HPV E6 and E7) (I–L). HPV‐HR18 was detected using DAB (brown) chromogen and p16 was detected using fast red (red) chromogen. (A–H) Sections were probed with either p16 only or HPV‐HR18 only, but detection of both chromogens was performed. Images are shown at either 10× (A, C, E, G, I, K) or 40x (B, D, F, H, J, L) magnification. Black box indicates region shown at 40× magnification.
Next, to test the ability of the automated RNAscope assay to detect two targets in different cells simultaneously, the expression of KRT19 and PECAM1 was examined in a panel of human tumors using the Leica BOND RX platform (Fig. 4). KRT19, which is expressed by epithelial cells and is a biomarker of malignant tumors, was detected in the tumor cells of nine different human tissue tumors, including breast, cervix, colon, esophagus, kidney, lung, ovary, stomach, and tonsil, whereas expression of PECAM1 was restricted to the endothelial cells in each of these tissues (Fig. 4). This data demonstrates the ability of the automated RNA ISH assay to detect markers of two distinct cell populations within human tumors.
Figure 4.
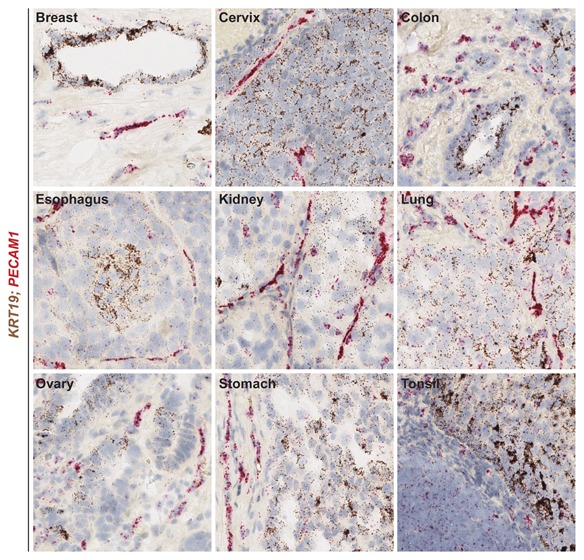
Simultaneous detection of two distinct cell populations using the automated RNAscope ISH duplex assay. The RNAscope automated duplex assay was performed using the Leica BOND RX platform on FFPE sections of human tumors from multiple tissues. KRT19 was detected using DAB (brown) chromogen and PECAM1 was detected using fast red (red) chromogen in breast, cervix, colon, esophagus, kidney, lung, ovary, stomach, and tonsil. Images are shown at 20× magnification.
THE AUTOMATED RNAscope PLATFORM IS HIGHLY CONSISTENT AND REPRODUCIBLE
To confirm that the automated RNAscope ISH assay is reproducible and consistent, three lots of assay reagents were tested on HeLa cell pellets using the Leica BOND RX platform. As shown in Figure 5A, little to no background was detected with the negative control probe dapB, while equivalent staining across three lots of reagents was observed with the positive control probe TBP (Fig. 5A). Similar results were seen with the Ventana DISCOVERY ULTRA and XT automated platforms (data not shown). Quantification of the average TBP dot number per cell demonstrated no statistically significant difference between the three lots (Fig. 5B), indicating the reproducibility of multiple lots of this assay.
Figure 5.
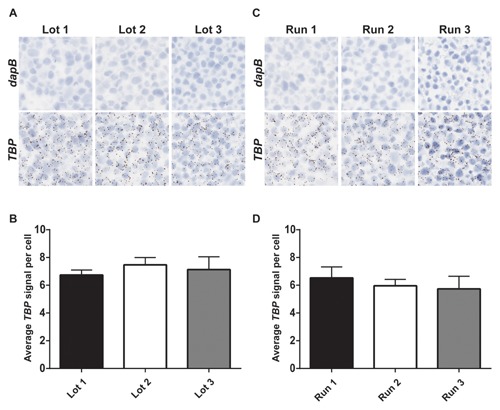
The automated RNAscope ISH assay performs consistently and reproducibly. (A) Three different lots of automated RNAscope assay reagents were generated for the Leica BOND RX automated platform and tested on FFPE sections of HeLa cells with either dapB or Hs‐TBP probe. (B) The average TBP signal per cell, indicating the average number of dots per cell, was quantified for every lot tested on the Leica BOND RX automated platform. Data are presented as mean + SEM; n = 3–8 replicates. (C) Three independent runs of the automated RNAscope assay were performed on FFPE sections of HeLa cells using either dapB or Hs‐TBP probes on the Leica BOND RX automated platform. (D) The average TBP signal per cell, indicating the average number of dots per cell, was quantified for every run performed on the Leica BOND RX automated platform. Data are presented as mean + SEM; n = 3–5 replicates. (A, C) Images are shown at 40× magnification.
Next, to determine the inter‐assay consistency of the automated RNAscope assay, three separate runs of the assay were performed on three different days using HeLa cell pellets. Little to no background was detected with dapB while comparable staining was observed with a probe targeting TBP in all three runs performed using the RNAscope assay on the Leica BOND RX platform (Fig. 5C). Similar results were seen with the Ventana DISCOVERY ULTRA and XT automated platforms (data not shown). Upon quantification, the average dot number per cell exhibited no statistical significance between the three runs, indicating consistency between multiple runs of the assay (Fig. 5D). Additionally, within a run on the Leica BOND RX automated assay, 2–5 replicates of a HeLa cell pellet were stained with TBP and showed similar number and intensity of dots, demonstrating intra‐run consistency (data not shown).
DISCUSSION
An automated RNA ISH assay allows for more samples to be run in a reliable manner, minimizing inter‐user variability and hands‐on time and generating consistently reproducible results. In this study we present the most recent version of the automated RNAscope technology, which is fully automated, generates a very high signal‐to‐noise ratio, is reproducible and consistent, is adaptable to multiple platforms, and can be quantified.
With the growth of companion diagnostics and personalized medicine, automated single‐molecule detection of RNA with morphological context is necessary to accurately and rapidly obtain clinically actionable data. Histopathological techniques performed manually can be hampered by user‐to‐user performance and are labor‐ and time‐consuming, while automated assays provide standardization, improve reproducibility, and increase throughput. Here we have shown that the automated RNAscope assay reliably and consistently detected the house‐keeping genes PPIB and TBP with little to no background in multiple samples using two different automated platforms (Leica BOND RX and Roche Ventana DISCOVERY ULTRA and XT) (Figs. 2 and 5). In addition, the automated RNAscope assay detected strong and specific expression of multiple targets in several human tumor tissues (Figs. 2–4). We also demonstrate the duplex capabilities of the automated RNAscope ISH assay in multiple human tumor samples, allowing for simultaneous detection of two biomarkers either in the same cell or different cells (Figs. 3 and 4). Lastly, the automated RNAscope assay is quantifiable (Fig. 5), allowing the stained slides to be objectively scored and thereby eliminating subjectivity in user analysis. Automation is especially important for clinical adoption of the RNAscope technology.
The fully automated RNA ISH assays described in this study were able to discern the expression of several clinically relevant biomarkers in human tumor samples, including PD‐L1 and HPV E6/E7 mRNA. These assays have been used by the research community in many fields. Currently, >6000 target probes have been generated upon request from researchers. The availability of these assays and the ability to make any new probe within 2 weeks should greatly facilitate both basic research and translational research by eliminating the time‐consuming process of making and validating traditional ISH probes.
One major appeal of the RNAscope technology is circumventing the need for antibodies for immunohistochemistry (IHC) for newly discovered biomarkers. Although IHC is a powerful technique for in situ gene expression analysis at the protein level, its results are highly dependent on the quality of the antibody used. The sensitivity and specificity of many antibodies are uncertain and can lead to costly misleading results for entire fields of research, as discussed in recent commentaries [Egelhofer et al., 2011; Yu et al., 2016]. In the case of the immune checkpoint marker PD‐L1, disagreement about the prognostic role of PD‐L1 for immunotherapy treatment has been mainly attributable to non‐standardized IHC techniques [Yu et al., 2016]. In a study comparing IHC results from antibodies against the immune checkpoint marker PD‐L1, the RNAscope assay validated only one out of the four PD‐L1 antibodies tested [Velcheti et al., 2014]. In another example, a recent study utilized the RNAscope assay to resolve discrepant IHC results from multiple MYC antibodies [Baker et al., 2016]. The authors determined that while an N‐terminal antibody detected MYC protein expression that correlated well with MYC mRNA expression, MYC protein distribution identified by a C‐terminal antibody did not correlate with MYC mRNA detected by the RNAscope assay [Baker et al., 2016]. These discrepancies in results among different antibodies can lead to misinterpretations of the data or misdiagnoses in clinical samples. RNA analysis via the RNAscope technology may be highly valuable for validating and selecting the right antibodies for IHC. With the automated RNAscope assay, this can be conveniently performed using the same tissue specimen and instrumentation.
In summary, we have developed an automated version of the RNA ISH technology RNAscope. This assay is both highly sensitive and specific, quantifiable, adaptable to perform on multiple platforms, and capable of duplex gene detection. This new advance should be a timely addition to the researcher's toolbox in many fields of research and holds great promise for accelerating the translation of genomic discoveries to the clinic.
Conflicts of interest: All authors are employed by and own stock in Advanced Cell Diagnostics, Inc.
REFERENCES
- Baker AM, Van Noorden S, Rodriguez‐Justo M, Cohen P, Wright NA, Lampert IA. 2016. Distribution of the c‐MYC gene product in colorectal neoplasia. Histopathology. [DOI] [PMC free article] [PubMed] [Google Scholar]
- Cassidy A, Jones J. 2014. Developments in in situ hybridisation. Methods 70:39–45. [DOI] [PubMed] [Google Scholar]
- Du Z, Abedalthagafi M, Aizer AA, McHenry AR, Sun HH, Bray MA, Viramontes O, Machaidze R, Brastianos PK, Reardon DA, Dunn IF, Freeman GJ, Ligon KL, Carpenter AE, Alexander BM, Agar NY, Rodig SJ, Bradshaw EM, Santagata S. 2015. Increased expression of the immune modulatory molecule PD‐L1 (CD274) in anaplastic meningioma. Oncotarget 6:4704–4716. [DOI] [PMC free article] [PubMed] [Google Scholar]
- Egelhofer TA, Minoda A, Klugman S, Lee K, Kolasinska‐Zwierz P, Alekseyenko AA, Cheung MS, Day DS, Gadel S, Gorchakov AA, Gu T, Kharchenko PV, Kuan S, Latorre I, Linder‐Basso D, Luu Y, Ngo Q, Perry M, Rechtsteiner A, Riddle NC, Schwartz YB, Shanower GA, Vielle A, Ahringer J, Elgin SC, Kuroda MI, Pirrotta V, Ren B, Strome S, Park PJ, Karpen GH, Hawkins RD, Lieb JD. 2011. An assessment of histone‐modification antibody quality. Nat Struct Mol Biol 18:91–93. [DOI] [PMC free article] [PubMed] [Google Scholar]
- Grun D, van Oudenaarden A. 2015. Design and analysis of single‐cell sequencing experiments. Cell 163:799–810. [DOI] [PubMed] [Google Scholar]
- Levsky JM, Singer RH. 2003. Fluorescence in situ hybridization: Past, present and future. J Cell Sci 116:2833–2838. [DOI] [PubMed] [Google Scholar]
- Matos LL, Trufelli DC, de Matos MG, da Silva Pinhal MA. 2010. Immunohistochemistry as an important tool in biomarkers detection and clinical practice. Biomark Insights 5:9–20. [DOI] [PMC free article] [PubMed] [Google Scholar]
- Schalper KA, Velcheti V, Carvajal D, Wimberly H, Brown J, Pusztai L, Rimm DL. 2014. In situ tumor PD‐L1 mRNA expression is associated with increased TILs and better outcome in breast carcinomas. Clin Cancer Res 20:2773–2782. [DOI] [PubMed] [Google Scholar]
- Sotiriou C, Piccart MJ. 2007. Taking gene‐expression profiling to the clinic: When will molecular signatures become relevant to patient care? Nat Rev Cancer 7:545–553. [DOI] [PubMed] [Google Scholar]
- Tubbs RR, Wang H, Wang Z, Minca EC, Portier BP, Gruver AM, Lanigan C, Luo Y, Cook JR, Ma XJ. 2013. Ultrasensitive RNA in situ hybridization for detection of restricted clonal expression of low‐abundance immunoglobulin light chain mRNA in B‐cell lymphoproliferative disorders. Am J Clin Pathol 140:736–746. [DOI] [PubMed] [Google Scholar]
- Velcheti V, Schalper KA, Carvajal DE, Anagnostou VK, Syrigos KN, Sznol M, Herbst RS, Gettinger SN, Chen L, Rimm DL. 2014. Programmed death ligand‐1 expression in non‐small cell lung cancer. Lab Invest 94:107–116. [DOI] [PMC free article] [PubMed] [Google Scholar]
- Wang F, Flanagan J, Su N, Wang LC, Bui S, Nielson A, Wu X, Vo HT, Ma XJ, Luo Y. 2012. RNAscope: A novel in situ RNA analysis platform for formalin‐fixed, paraffin‐embedded tissues. J Mol Diagn 14:22–29. [DOI] [PMC free article] [PubMed] [Google Scholar]
- Wang H, Su N, Wang LC, Wu X, Bui S, Nielsen A, Vo HT, Luo Y, Ma XJ. 2014a. Dual‐color ultrasensitive bright‐field RNA in situ hybridization with RNAscope. Methods Mol Biol 1211:139–149. [DOI] [PubMed] [Google Scholar]
- Wang H, Su N, Wang LC, Wu X, Bui S, Nielsen A, Vo HT, Luo Y, Ma XJ. 2014b. Quantitative ultrasensitive bright‐field RNA in situ hybridization with RNAscope. Methods Mol Biol 1211:201–212. [DOI] [PubMed] [Google Scholar]
- Wang H, Wang MX, Su N, Wang LC, Wu X, Bui S, Nielsen A, Vo HT, Nguyen N, Luo Y, Ma XJ. 2014c. RNAscope for in situ detection of transcriptionally active human papillomavirus in head and neck squamous cell carcinoma. J Vis Exp 85;(e51426):1–5. [DOI] [PMC free article] [PubMed] [Google Scholar]
- Wang Z, Portier BP, Gruver AM, Bui S, Wang H, Su N, Vo HT, Ma XJ, Luo Y, Budd GT, Tubbs RR. 2013. Automated quantitative RNA in situ hybridization for resolution of equivocal and heterogeneous ERBB2 (HER2) status in invasive breast carcinoma. J Mol Diagn 15:210–219. [DOI] [PubMed] [Google Scholar]
- Wong ML, Medrano JF. 2005. Real‐time PCR for mRNA quantitation. Biotechniques 39:75–85. [DOI] [PubMed] [Google Scholar]
- Yu H, Boyle TA, Zhou C, Rimm D, Hirsch FR. 2016. PD‐L1 expression in lung cancer. J Thorac Oncol. [DOI] [PMC free article] [PubMed] [Google Scholar]