

Abstract
The significant gap between quantitative and qualitative understanding of cytoskeletal function is a pressing problem; microscopy and labeling techniques have improved qualitative investigations of localized cytoskeleton behavior, whereas quantitative analyses of whole cell cytoskeleton networks remain challenging. Here we present a method that accurately quantifies cytoskeleton dynamics. Our approach digitally subdivides cytoskeleton images using interrogation windows, within which box‐counting is used to infer a fractal dimension (D f) to characterize spatial arrangement, and gray value intensity (GVI) to determine actin density. A partitioning algorithm further obtains cytoskeleton characteristics from the perinuclear, cytosolic, and periphery cellular regions. We validated our measurement approach on Cytochalasin‐treated cells using transgenically modified dermal fibroblast cells expressing fluorescent actin cytoskeletons. This method differentiates between normal and chemically disrupted actin networks, and quantifies rates of cytoskeletal degradation. Furthermore, GVI distributions were found to be inversely proportional to D f, having several biophysical implications for cytoskeleton formation/degradation. We additionally demonstrated detection sensitivity of differences in D f and GVI for cells seeded on substrates with varying degrees of stiffness, and coated with different attachment proteins. This general approach can be further implemented to gain insights on dynamic growth, disruption, and structure of the cytoskeleton (and other complex biological morphology) due to biological, chemical, or physical stimuli. © 2016 The Authors. Cytoskeleton Published by Wiley Periodicals, Inc.
Keywords: live‐imaging, temporal analysis, cytoskeleton rearrangement, mechanobiology, high‐throughput analysis
Introduction
The cytoskeleton is the supporting structure which integrates outward nucleus intracellular signaling and the inward transmission of extracellular mechanobiological cues from the cell's immediate microenvironment [Campbell and Hope, 2003; Huang et al., 2004; Mofrad, 2009; Fletcher and Mullins, 2010; Stricker et al., 2010; Anitei and Hoflack, 2011]. Temporally, the cell's cytoskeleton evolves as a function of many processes, at differing spatial and temporal scales, all of which define the physiological state of the cell. For example, mechanisms of mitosis, cellular proliferation, shape change, motility, and responsiveness to the extracellular environment are all cytoskeleton dependent processes [Pollard and Cooper, 2009; Bezanilla et al., 2015]. Traditionally, cytoskeletal analysis utilizes end‐point fixation and staining of cells, with the advancement of live‐imaging microscopy technology [McKayed and Simpson, 2013; Waters, 2013] combined with molecular chemistry [Riedl et al., 2008; Wang et al., 2008]. Real time studies of cytoskeletal dynamics and subsequent cellular physiology, have gained momentum throughout the last decade. The use of live‐imaging technology plays a fundamental role in furthering our understanding of the cytoskeleton, yielding large amounts of data; however, the lack of analytical tools for further quantifying temporal changes remains a bottleneck.
Previous studies of time‐dependent cytoskeleton changes were confined to specific subcellular space with studies spanning from the peripheral actin‐rich lamellipodium for cell–cell connection formation [Jamora and Fuchs, 2002; Mège et al., 2006; Baum and Georgiou, 2011; Hoelzle and Svitkina, 2012] and migration of various cell types [Yamaguchi and Condeelis, 2007; Bergert et al., 2012; Suraneni et al., 2012] to the perinuclear region, and its involvement in intracellular [Campbell and Hope, 2003; Tian et al., 2010] and extracellular signal transduction [Huang et al., 2004; Li et al., 2014]. At the subcellular scale, intensity values, orientation, structural count, density changes, and actin length changes are a subset of the dynamic parameters used to quantify cytoskeleton changes [Muralidhar et al., 2008]. The field of cell biology lacks computational tools that enable the study of intricate patterns and whole‐cell kinematic rearrangement of the cytoskeleton itself. Studies which utilize image‐based methods for the quantification of whole‐cell cytoskeletal arrangement do exist: (1) Image coherency measures both the quality and quantity of clear structures within an image [Weichsel et al., 2010]; while it has been shown to be successful in detecting the global change in the actin network, the exact location where the changes occur within the cell cannot be determined. (2) Quantification of image intensity gradients can provide a co‐alignment ratio and angular deviation to assess cell orientation distribution as well as cytoskeletal filament organization [Karlon et al., 1999].
We use fractal analysis to quantify cytoskeletal changes temporally, as it is capable of describing complex and irregular patterns [Haidekker, 2013]. This method measures a fractal dimension (D f), a real number that represents pattern complexity, and inner self‐similarity as calculated on different spatial scales [Napolitano et al., 2012; Qian et al., 2012; Al‐Mamun et al., 2014]. Biomedically, D f has also been used as a numerical measure of retinal vascular branching [Liew et al., 2008; Cheung et al., 2014], neuronal branching and extension [Milošević et al., 2007; Shigetomi et al., 2013] and mammary epithelial ducting networks [Fuseler et al., 2014]. Other investigators have also used it to measure cytoskeleton disruptions resulting from drug treatments [Lockett et al., 2014] or external forces[Qian et al., 2012],but is fractal analysis sufficiently sensitive to detect subtle physiological changes? Another approach for cytoskeletal analyses, the coherence method, was unable to differentiate the cytoskeletal arrangement in control cells and cells infected with a virus, but showed significant changes only when cells were treated with anti‐cytoskeletal drugs such as Cytochalasin [Weichsel et al., 2010].
Unlike previous work using D f as a measurement of cytoskeleton complexity [Lockett et al., 2014], our study is not limited to differentiating cytoskeletal arrangements of cells exposed to agents capable of major cytoskeletal disruption. Rather, this study focuses on transgenically‐modified human dermal fibroblasts (HDF, LifeAct.mCherry) cultured on (1) polyacrylamide (PA) gels of different stiffness and (2) PA gels coated with Collagen I (Col) or Fibronectin (Fn) to confirm that fractal analysis is sensitive enough to detect minor differences that are more physiologically relevant. We establish a fully automated method that accurately quantifies the characteristics of the dynamic cytoskeleton from temporal live‐imaging datasets, and is capable of partitioning the cell into perinuclear, cytosolic, and peripheral regions, to extract subcellular space information. The method was validated and proven to be sensitive, while robust enough to accommodate noisy images.
Reagents and Instruments
Table 1.
| Reagents/Instrument | Abbreviation | Company | Cat. or Product number |
|---|---|---|---|
| Axiovert 200, Z1, with motorized stage | ZEISS Microscopy, GmbH, Germany | 3834004900 | |
| Cytochalasin D | CytoD | TOCRIS Bioscience, Bristol, United Kingdom | 1233 |
| Dulbecco's Modified Eagle Medium, high glucose | DMEM HG | Gibco, Invitrogen Corp., Carlsbad, CA | 41965‐039 |
| Dulbecco's Phosphate Buffered Saline 10× | PBS | Sigma Aldrich | D1283 |
| Fetal Bovine Serum | FBS | Gibco | 12483‐020 |
| Homo sapiens Embryonic Kidney | HEK293T | ATCC, Manassas, VA | ATCC® CRL‐3216™ |
| Human Collagen Type I | Col | Advanced Biomatrix, San Diego, CA | 5007 |
| Human Fibronectin | Fn | Advanced Biomatrix | 5080 |
| Human histone H2B | H2B‐GFP | Addgene, Cambridge, MA | 11680 |
| Leibovitz's L‐15 Media | L‐15 | Gibco | 11415‐049 |
| l‐Glutamine | l‐glut | Gibco | 25030‐081 |
| Mcherry‐Lifeact‐7 | Mcherry‐Lifeact | Addgene | 54491 |
| Normal Human Dermal Fibroblast | HDF | ATCC | PCS‐201‐010 |
| Penicillin Streptomycin | PenStrep | Gibco | 15070063 |
| Trypsin 0.05% | Trypsin | Gibco | 25300‐096 |
| Type I bovine collagen | Collagen Type I | Advanced Biomatrix | 5133‐A |
| Softwell hydrogel plates | Matrigen Life Technologies, CA | 96GHTS |
Methods
Cell Culture
Normal human dermal fibroblasts (HDF, ATCC), were cultured in DMEM high glucose, supplemented with 10% FBS, 2% l‐glutamine and 1% PenStrep (All Gibco) under standard tissue culture conditions. Cells were detached at 80% confluence using 0.05% Trypsin (Gibco). Two days prior to imaging, the media for cell culture was changed to L‐15 media (Gibco), supplemented with 1% PenStrep (Gibco) and 2% l‐glutamine (Gibco) and incubated in low CO2 conditions. Cells were imaged using L‐15 media to minimize the effects of fluctuating pH levels.
Transfection for Cytoskeleton Visualization
Cells were stably transfected using second‐generation lentiviral particles. Briefly, LifeAct.mCherry (Addgene) and H2B.GFP (Addgene) were cloned in separate lentiviral expression systems and the viral particles were produced in HEK293T (ATCC) cells using standard protocols (Didier Trono lab, http://tronolab.epfl.ch/). LifeAct was chosen at it has been well characterized and does not alter actin polymerization and depolymerization dynamics [Riedl et al., 2008]. Following concentration of the viral particles, we utilized 5 μL of concentrated supernatant to transfect 100,000 HDF plated in a well of a six‐well plate. Cells initiated expression within 2 days following transfection and continued expressing the transgenes.
Adhering Cells to Biomimetic Substrates
Glass bottom multiwell plates (Matrigen) overlaid with polyacrylamide (PA) gels of varying stiffnesses (12.5, 25, and 50 kPa) and glass substrate itself were coated with cell attachment proteins (Advanced biomatrix) human Collagen Type I (Col, 100 μg/mL) or Fibronectin (Fn, 100 μg/mL) and allowed to incubate at 4°C overnight. To facilitate the capture of single cells, a density of 75 cells per well was placed into each of the multiwells. Prior to seeding, plates were washed twice with 1× PBS. Cells were allowed to recover overnight before imaging experiments.
Time‐Lapse Live‐Imaging Dataset Acquisition
An Axiovert 200 inverted fluorescence microscope with a motorized translation stage (Zeiss Microscopy GmbH) fitted with an enclosed incubation system (Incubation System S, PeCon GmbH) to maintain physiological ambient (temperature: 37°C and CO2: 5%) conditions was used to acquire time‐lapse fluorescence images of both the cytoskeleton and nucleus using a 40× objective to optimize the resolution and capture the whole cell. The resultant image resolution was 0.48 μm per pixel. Cells were imaged every 10 min for > 21 h (minimum stack size of 125 images) and a beam splitter was used to simultaneously acquire separate images of the nucleus (GFP: Exposure: 30 ms, excitation: 493 nm, emission: 517 nm) and the cytoskeleton (mCherry: Exposure: 350 ms, excitation: 580 nm, emission: 618 nm). In total we obtained n > 6 cells (each with > 130 temporal time points or dataset stack size) per condition. To observe the Cytochalasin D (1 μM, CytoD) disruption of the cytoskeleton during live‐imaging acquisition, imaging intervals were reduced to 2 min and the number of cells imaged was, therefore, limited (n = 14). CytoD was added to each well 30 min after the start of the experiment.
Automated Actin Cytoskeleton Pattern and Expression Analyses
Using MATLAB with Image Processing Toolbox (The MathWorks, Natick, MA), we customized the program to automatically parse through paired nuclei and cytoskeleton images, which are then subjected to a series of image processing steps, including image conversion to grayscale, contrast equalization, thresholding for binarization, and filling of voids to generate a mask (Fig. 1A). By selecting the largest binarized area, we eliminate portions of neighboring cells that stray into the image (see Supporting Information SVideo 1) to restrict the analyses to a single cell (see Supporting Information SVideo 2). Next, the program identifies two sets of coordinate points that encompass the mask of the entire cell and the nucleus. The located boundaries are then redefined through an outward offset by a predetermined distance (P). We predefined P as 5 pixels as this provides us coverage of 2.4 μm from the cell edges; typically, investigators interested in the peripheral actin cytoskeleton image approximately 1–5 μm from the edge of the cell [Belin et al., 2015; Johnson et al., 2015]. We further establish that varying P from 3 to 10 did not significantly change the resultant D f significantly (Supporting Information SFig. 1). To clean and smooth the measured regions, repeated pixels within the new boundaries are removed, and a binary mask is generated to extract subcellular regions of interest, namely, the perinuclear, cytosolic, and peripheral regions (Fig. 1C). Concurrently, the contrast adjusted image of the cytoskeleton goes through a “Canny” edge detection process (through MATLAB edge function with default parameters) which uses a multi‐stage algorithm to detect a wide range of edges in the images [Canny, 1986], resulting in a binarized image with a mix of white fragments and lines of varying lengths, bifurcations and loops: the actin cytoskeleton. The image is subsequently divided into sub‐regions using squares of user defined pixel lengths we term as interrogation windows (Fig. 1B). These interrogation windows do not overlap and within each window the cytoskeleton arrangement is assigned a fractal dimension (D f) and the mean of the original gray value. For each pair of nuclei and cytoskeleton images, the final program outputs are two‐dimensional (2D) arrays of D f values and corresponding mean gray value intensities (GVI), giving temporal information regarding the pattern of the cytoskeleton and the amount of actin (Fig. 1C, see Supporting Information SVideos 1–8). Employing 2D interpolation to redefine the 2D D f array back into the original image resolution, the binary masks obtained can then be used to assess the D f and GVI information for each of the subcellular regions of interest. This described algorithm was computationally placed in a loop for automated image processing; sub cellular region segmentation and analysis of each set of time‐lapse datasets result in fast, efficient and temporally dependent cytoskeleton quantification. To measure D f for the cytoskeletal arrangement in each interrogation window, the procedure is as follows [Costa et al., 2011][Costa et al., 2011]: (step 1) The window is padded with zeros such that dimensions are equal and of power 2 (Supporting Information SFig. 2); (step 2) Starting with the largest allowable sized box (square of side length r), a padded interrogation window is chosen; Then (step 3) n(r) is computed, which corresponds to the number of boxes (of size r) containing at least one non‐zero pixel; (step 4) If n > 1 then a new r is calculated and r new = r old/2, and the process (steps 3–4) is repeated until no non‐zero pixel is detected; Finally (step 5), least squares fitting of a line (with slope D f) to the points log (n(r)) versus log (r) returns a single fractal dimension to each sub‐scanned region (Fig. 2). Windows with no features are assigned NaN values, and not included in further analyses. At the edges of the cytoskeleton, where fragments and excessive empty spaces dominate, we did not set quality criteria for an acceptable fit. Even a small value (i.e., 0.1 < R 2 < 0.5) indicates partial box covering of present cytoskeletal objects.
Figure 1.
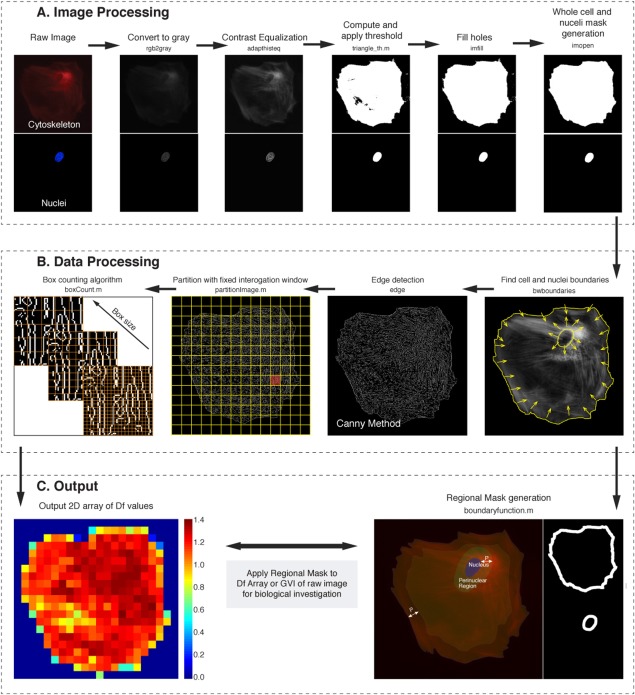
Automated partitioning and analysis of whole cell images for sub cellular quantification of cytoskeleton structure. A custom algorithm automatically partitions cytoskeletal images into the relevant biological regions (perinuclear, cytosolic, and peripheral actin cytoskeleton), from which a mask is generated and data extracted can be specific to these regions. (A) Initially, images of the nuclei and cytoskeleton are imported for processing, which includes a series of segmentation procedures to outline the shape of the cell and nucleus. (B) Each cytoskeleton image is then scanned using non‐overlapping interrogation windows, within each, fractal analysis is performed through a box counting method, quantifying the actin arrangement as defined by an edge detection filter. The regional mask is then used to differentiate perinuclear, cytosolic, and peripheral actin quantity and actin arrangement information from the raw cytoskeleton image and resultant 2D array of fractal dimension values, respectively. (C) A user‐defined set distance is then used to redefine these boundaries, and pixels between the new and original boundaries form the masks required. This is repeated for each paired nuclei cytoskeleton image for the entire live imaging dataset. MATLAB commands used for the entire process are noted under the title of each step and custom codes are further denoted with a “.m”. [Color figure can be viewed in the online issue, which is available at wileyonlinelibrary.com.]
Figure 2.
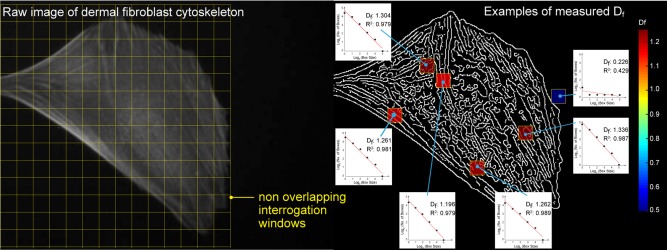
Example of 2D array of Df values from interrogation windows. After edge detection, binarized images that depict the arrangement of the cytoskeleton are partitioned using fixed interrogation window sizes that do not overlap. Subsequently a box counting method is used to obtain D f values for each window and the resultant output is a 2D array of D f. Shown here are some of the D f values obtained for randomly chosen interrogation windows that partitioned an image of the cytoskeleton of a cell and their corresponding least squares linear fits. Empty spaces are assigned a NaN value and not taken into consideration for further analyses. [Color figure can be viewed in the online issue, which is available at wileyonlinelibrary.com.]
Statistical Analysis
Data presented are in the form: mean ± standard deviation. The significance cutoff used for all statistical analyses was alpha < 0.05. Comparison between two conditions was analyzed using Mann‐Whitney T‐test and multiple comparisons were analyzed using Kruskal‐Wallis one‐way ANOVA with Dunn's multiple comparison post‐hoc test (GraphPad Prism, San Diego, CA). Kernel distribution fitting was done in MATLAB with Machine Learning and Statistics Toolbox using the fitdist function with the default parameters, a “normal” kernel smoother type.
Results
Selection of Interrogation Window Size Using Sensitivity Analysis
From the acquired time‐lapse datasets, we randomly selected actin cytoskeleton images that were clearly defined (n = 22) to facilitate the selection of an appropriate interrogation window size. These images were first partitioned using square interrogation windows of edge lengths (or sizes) of 5, 10, 20, 40, and 80 pixels, and the mean D f values of the resultant 2D array were obtained and compared. It is observed that mean D f for each of the images increased with interrogation window size and plateaued at 40 pixels (Supporting Information SFig. 3), indicating that too large of a window size results in overaveraging of the fractal dimension within. Fractal analysis was then performed on the same images but as a whole, without partitioning with interrogation windows. On average, the D f obtained was 1.45, lying in between the D f values of a single line (D f = 1) and a filled 2D space (D f = 2). The gradients between box sizes of 4 to 8, 8 to 16, and 16 to 32 pixels are fairly consistent and lie close to the linear least square fitted line that determined the D f value (Supporting Information SFig. 4), implying that interrogation windows of 5, 10, or 20 pixels could be used. Thus an interrogation window size of 10 pixels is used, a size large enough to provide three levels of refinement during the box counting process, and small enough to provide sufficient resolution to the resultant D f array (Supporting Information SFig. 4).
Fractal Analysis of the Cytoskeleton Is Robust for Image Noise but Not Resolution
We artificially introduced Gaussian white noise (10, 20, 30, 40%, representing the standard deviation of the Gaussian distribution) of increasing severity (Fig. 3A) to images of the cytoskeleton (n = 22), an experimentally common phenomenon when fluorescence probes are used during live‐imaging. Resultant mean D f was only significantly different with the addition of 40% noise (> 5% difference, Fig. 3E) and we measured the relative difference in image quality, using mean squared error (MSE), structural similarity index measurement (SSIM), and peak signal to noise ratio (PSNR), to give an appreciation of the change in image quality. (Fig. 3B). We also deteriorated the image through resampling by factors of 2, 4, 8, and 16 (Fig. 3C). Fractal analysis was then performed and the mean D f values compared against the original base images. A resolution poorer than 1.93 μm/pixels significantly changed the mean D f measured and the average difference was greater than 10% from original baseline images (Fig. 3E).
Figure 3.
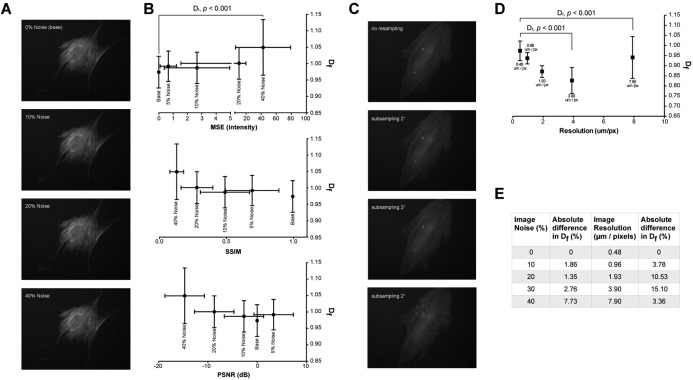
Mean Df is significantly affected by poor resolution but not by noisy images. Using 22 acquired cytoskeleton images of different cells as our baseline (0% noise and resolution of 0.48 μm/pixel), we artificially (A) introduced varying amounts of Gaussian white noise (10%, 20%, and 40% where % is the standard deviation of the noise) and (B) differences in measured D f increased above 5% only when added noise was larger than 30%. We also (C) deteriorated image resolution through resampling of the images (by factors of 2, 4, 8, 16) and conclude that (D) poor image resolution is highly detrimental; a coarsen image resolution of 1.93 μm/pixel resulted in a 10.52% change in measured D f values. (E) Image noise has a lesser effect on D f than resolution. With respect to baseline images, (B) image quality measures of mean squared error (MSE) < 10.67, structural similarity index (SSIM) > 0.29, and peak signal to noise ratio (PSNR) > −10 cannot be tolerated as D f measurements deviate by more than 5%.
Dynamic Decline in Fractal Dimension of Cytochalasin D Treated Cells
To be able to capture the effects of cytoskeletal drugs on fibroblast cytoskeleton, we imaged cells treated with CytoD at a shorter time interval (2 min) and this reduced the number of cells we were able to study (n = 14). The time‐lapse images obtained revealed that the disruption of the cytoskeleton occurs as early as 5 min after the administration of 1 μM of the drug. Using our custom code to perform fractal analysis, we obtained the temporal mean D f values before and after the addition of CytoD (Fig. 4). Between 2 and 30 min D f = 0.987 ± 0.004 and between 32 and 80 min D f = 0.939 ± 0.015. Not only is the difference significant, but also we were able to detect the temporal decline in D f values between 32 and 40 min.
Figure 4.
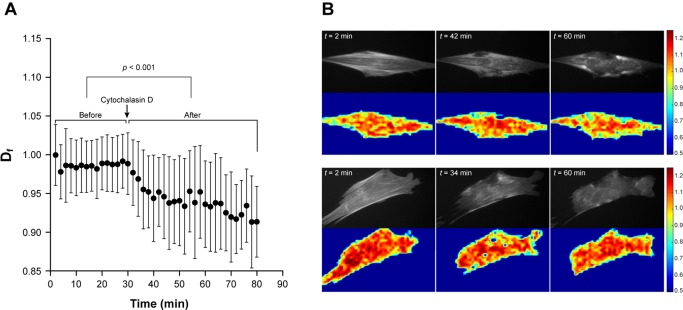
Dynamic detection of change in cytoskeletal rearrangement due to Cytochalasin D. We acquired and analyzed 14 cells subjected to a treatment of 1 μM Cytochalasin D, a drug that blocks actin assembly and disassembly. Cells were imaged for 30 min and then Cytochalasin D was added. (A) Immediately, measured D f significantly declined (p < 0.001), indicating not only a change in cytoskeletal arrangement but a reduction in lengthy actin filaments. (B) Raw images and corresponding D f values from two representative cells are shown before drug administration (top row) and after drug administration (bottom row), when there is visible disruption of the actin cytoskeleton. [Color figure can be viewed in the online issue, which is available at wileyonlinelibrary.com.]
Differences in Cell Cytoskeleton Response to Substrate Type and Substrate Stiffness Can Be Measured Using Fractal Analysis
Fibroblasts were plated on PA gels overlaid on glass, and imaged at a time interval of 10 min for 21 h. PA gels with varying stiffness (12.5, 25, and 50 kPa), were coated with cell attachment proteins (Col or Fn), and gel‐less coated glass (stiffness ∼ GPa) served as a control. To avoid statistical assumptions, extracted data were fit to a kernel distribution (Fig. 5) and means were obtained from temporal whole cell, cytosolic, perinuclear, and peripheral D f and GVI values. While D f gives the spatiotemporal patterning of the actin cytoskeleton (Fig. 6), the corresponding GVI determines the amount of actin protein. For comparative analyses, we first pooled results from cells on different cell attachment ligands and compared the effects of substrate stiffness (Figs. 7A and 7B); we then pooled results from cells on different substrate (stiffness) and compared the effects of cell attachment ligands (Figs. 7C and 7D). Whole cell D f evaluation showed significant and higher differences between glass and PA substrates of 50 kPa (PA50kPA) and marginally with PA25kPA. Inversely and when compared to glass, the amount of actin protein as measured using GVI, was significantly lower in cells cultured on PA25kPA and PA12.5kPA. The same trend was seen within the cytosolic region: low differences in actin cytoskeleton complexity is countered by more actin proteins. However, at the perinuclear region, the relatively low amounts of actin proteins correspond to simpler actin cytoskeleton arrangements, and a trend also exists: the less stiff the substrate, the lower the actin cytoskeletal complexity. D f values at the periphery did not differ significantly, but GVI values differ greatly when compared to those of cells cultured on glass substrates. Whether whole cell, or within each subcellular region, our algorithm picked up significant differences in D f values between cells seeded on collagen or fibronectin, but the differences were insignificant for GVI values.
Figure 5.
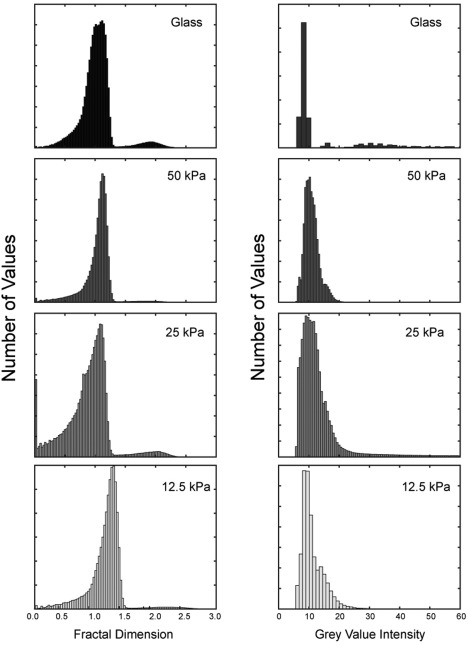
Distribution of measured actin cytoskeleton complexity (fractal dimension, Df) and actin amounts (gray scale intensity, GVI) for dermal fibroblast on substrates of different stiffnesses. Measured D f (left column) and GVI (right column), for all times and cells. Distribution indicates that the dermal fibroblasts are affected by different substrate stiffness. Qualitatively there is also an inverse relationship between D f and GVI. As the shapes of histograms were unique, we made no attempt in assuming a distribution but used kernel fitting to obtain means for statistical comparisons.
Figure 6.
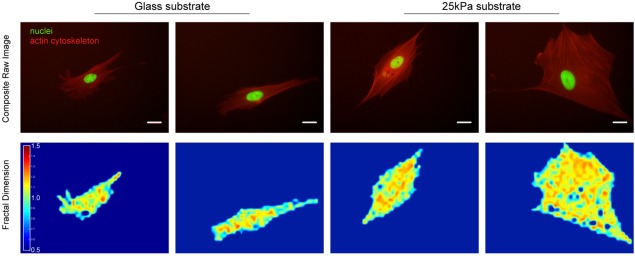
Examples of raw cytoskeleton images and their corresponding Df maps. Representative images of the cytoskeleton (top row) and results form our presented technique which yields a corresponding 2D fractal dimension array (bottom row) on glass substrate (first two columns) and polyacrylamide substrate of 25 kPa (last two columns). The actin cytoskeletons at the cytosolic and perinuclear regions are well represented by the fractal values obtained through the technique presented here. Scale bar shown represents 25 μm. [Color figure can be viewed in the online issue, which is available at wileyonlinelibrary.com.]
Figure 7.
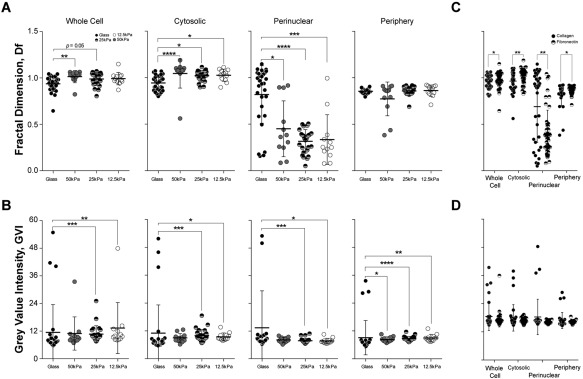
Substrate ligand type and substrate stiffness affects fibroblast actin cytoskeleton. Temporal mean fractal dimension (D f) of fibroblast attached on polyacrylamide (PA) substrates of (i) different stiffness and (ii) coated with attachment ligands Collagen I (Col) or Fibronectin (Fn) were compared to demonstrate sensitivity of the method presented. As measured by our method, (A) Comparing fibroblasts on substrates of different stiffness, differences in both cytosolic D f and perinuclear D f can be detected between glass and PA substrates. (B) Gray value intensity (GVI), signifying the amount of actin, was significantly different between glass and PA substrates at all intracellular regions. (C) The cytoskeleton arrangement (D f) at each subcellular region of interest was significantly different for cells attached on Col versus Fn, (D) but did not differ in terms of the amount of actin. D f < 1 is due to the partial filling of small, principally empty, interrogation windows.
Discussion
The cytoskeleton, with its direct involvement in all cellular processes, with well‐understood roles in maintaining cell shape or migration to the more subtle functions in intracellular signaling, has been dynamically investigated by end‐point assays and live imaging. Live imaging is used for understanding critical biological events missed with end‐point assays, but the massive data output intensifies the need for computational tools for accurate quantification. Measurements of the dynamic cytoskeletal rearrangements have been limited to subcellular regions of interest, and deduced using semi‐automated evaluation on polymerization and depolymerization speeds, extension, and recovery of cytoskeletal components. With many scientists accepting the indirect association of the cell's cytoskeleton with its physiological state [Wirtz, 2009; Di Carlo, 2012], it is surprising that whole cell cytoskeleton pattern measurements have been marginalized, presumably from the lack of a robust yet sensitive analytical approach that is biologically relevant. Through studying Lifeact expressing HDF cultured on collagen substrates of varying stiffness, we validated the sensitivity of fractal analysis to provide temporal changes in the structure of the whole‐cell actin cytoskeleton network (fractal number, D f) under cytoskeletal drug administration (see Supporting Information SVideos 9 and 10). We further demonstrated an approach to isolate subcellular regional results of D f and gray scale intensity values (GVI) to facilitate actin cytoskeleton structure (D f) and actin density (GVI).
The use of fractal analysis is robust for up to 30% noise, relative to the quality of images acquired from our experiments. The excessive addition of noise or large pixel dimensions will both artificially inflate D f as they increase the space filling of the interrogation window and thus require more boxes to cover the cytoskeleton structures found within. We reported several measures of relative image quality, as each parameter provides different forms of measure; MSE is a global measure, PSNR a local error measurement, and SSIM compares structure and not solely based on gray intensity values disparity.
Following others, we first validated our temporal actin cytoskeleton quantification method through the application of cytoskeletal drug, Cytochalasin D (CytoD, 1 μM): a known potent disruptor of actin filament function. Instead of taking “snap‐shots” of the cytoskeletal arrangement following drug administration, our measurement of D f before, during, and after treatment not only presented the expected result of reduced actin arrangement, but also further pointed out the rate of actin disruption. It is noteworthy that CytoD causes an increase in relative uncertainty and a corresponding decrease in D f. This suggests that significant changes in the relative uncertainties could be a signature of stimuli that are causing cytoskeletal response. As can be seen in Supporting Information Fig. 5 when cytosolic D f dropped significantly, actin D f increased in the perinuclear region marginally and the periphery significantly. Together this explains the resultant slight decrease in D f when cell cytoskeleton is treated with CytoD. Although CytoD acts globally, it is observed that the disruption first occurs in the cytosol, causing cell‐spanning actin filaments to break, releasing tension, and retracting towards anchor points: the nuclei and the periphery of the cell. This causes an increase in actin complexity, and results in larger D f at the perinuclear and peripheral regions of the cell. As CytoD prevents depolymerization/polymerization, the initiation of disruptions at the cytosolic region is presumably where actin turnover is greatest.
The actin cytoskeleton is not solely defined by the intricate patterns; we also measured GVI values which signal the amount (or mass) of polymerized actin. Interestingly, the GVI and D f trends in an inverse proportional manner, signifying that the actin cytoskeletons is either in a state of high complexity or in an immensely polymerized phase. We rationalize this observation by noting that cells try to reduce energy expenditure; protein production by a cell should be minimized [Flamholz et al., 2013] and if rearrangements of the cytoskeleton increase in complexity, the mass of polymerized actin should decrease, thereby obeying mass conservation principles. Outside the perinuclear region, our results corroborate this theory, on all substrates; both glass and PA showed lower mean D f, higher mean GVI, and vice versa. Moreover, the distributions of these dynamic parameters are not normally distributed and reporting mean values may mask vital information, further advocating the need for quantitative tools that analyze temporal patterns of the cytoskeleton.
On fixed cells, Prager‐Khoutorsky et al. previously demonstrated that when cultured on stiff substrates, fibroblasts displayed long stress fibers traversing across the entire cell, which contrasts the haphazard cytoskeletal patterns on soft substrates [Prager‐Khoutorsky et al., 2011]. For comparison purposes, at the cytosolic region mean D f was between 1.02 and 1.10 for cells on all substrates, and at the periphery region mean D f was between 0.77 and 0.86. A trend exists at the perinuclear region, where HDF actin cytoskeleton had higher complexity when cultured on hard glass (mean D f = 0.82 ± 0.30), which declines with PA stiffness (PA50kPA, D f = 0.45 ± 0.30; PA25kPA, D f = 0.32 ± 0.10; PA12.5kPA, D f = 0.33 ± 0.30). The mathematical implication of D f < 1 is a Cantor Set, defined by partial space filling of a line. The biophysical implication of D f < 1 is either 1) fragments of actin cytoskeleton or 2) ends of filaments penetrating across (over) the nucleus. In the cases where D f ≪ 1, D f = 0.3, for example, there is no actin crossing over the nucleus, and the low values are due to partial space‐filling from filament ends in the perinuclear region. A temporal change when D f < 1, assuming fixed interrogation window and box size, should signal either assembly/growth (dDf/dt is positive) or disassembly/shortening (dDf/dt is negative) of the fibers. Indeed when we add CytoD, we see a decrease in D f, implying kinetic cytoskeletal disassembly. Monitoring changes in D f below 1 should reveal information on actin polymerization/depolymerization kinetics.
A recent study concentrating on the actin distribution adjacent to the nucleus (perinuclear), showed that on high stiffness substrates stress fibers (long aligned actin) are visible [Vishavkarma et al., 2014]. On low stiffness substrates, an actin mesh (short interwoven actin) is apparent, coinciding with our findings. Intuitively, being in direct contact, peripheral and cytosolic actin, should have different cytoskeletal structures when cultured on substrates of different stiffness. The interconnectivity of the entire actin cytoskeleton involves a mechanical connection with the nuclei. This link allows the cell to direct its behavior, fate and response to the biomechanical cues through mechanotransduction [Wang et al., 2009]. In addition, regardless of stiffness of substrate, mean D f of HDF actin cytoskeleton at the cytosolic region and periphery of cells on Col was significantly lower than when cultured on Fn, but higher at the perinuclear region. Both findings highlight the sensitivity of our technique in measuring subtle D f changes.
Measured D f values were relatively lower than the fractal dimension range proposed by Fuseler et al. for cells responding to substrate stretching or migration [Fuseler et al., 2007; Fuseler and Valarmathi, 2012]. Our approach partitions the cytoskeletons into smaller parts using the interrogation windows and within each window are varying degrees of actin polymerization and/or branching. We also obtain D f of 1 if an actin filament spans the window, and a D f of 2 if an entire window is filled with actin (Supporting Information SFig. 6). There are situations whereby interrogation windows calculate D f values based on poor fits. These low R 2 regions are principally located at the perimeter of the cell. Here, there are artificially low D f regions because the interrogation windows covers unfilled space beyond the cytoskeleton network. Currently, we include the low measures of fractal dimension from the cell edges, which decreases the mean values of D f across the whole cell. If an experimentalist is more interested in questions related to the intracellular fractal structure, they can exclude the perimeter region, which artificially lowers D f. Our method provides analytical flexibility to experimentalists and a wider range of cell biology topics to investigate. The judgment calls of what regions to be included should be driven by the specific biological question(s) the experimentalists are pursuing.
Conclusions
In this work, we demonstrated a method for the quantification of spatiotemporal cytoskeletal patterns. This approach is not limited to whole cell analysis; it is able to focus on and distinguish between subcellular regions of interest. In future work we will discuss the biological implications of our obtained D f and GVI; here we emphasized the sensitivity of the presented method towards detecting differences in actin cytoskeletons for cells cultured on substrates with different stiffnesses. Our analytical approach (fractal analysis and partitioning) is neither computationally intensive in time nor resource (a 512 × 512 image typically requires < 5 s for D f and GVI analysis), and could become a mainstream technique for high throughput screening of kinematic cytoskeletal rearrangement.
Supporting information
Supporting Information Movie S1
Supporting Information Movie S2
Supporting Information Movie S3
Supporting Information Movie S4
Supporting Information Movie S5
Supporting Information Movie S6
Supporting Information Movie S7
Supporting Information Movie S8
Supporting Information Movie S9
Supporting Information Movie S10
Supporting Information Figure 1
Supporting Information Figure 2
Supporting Information Figure 3
Supporting Information Figure 4
Supporting Information Figure 5
Supporting Information Figure 6
Supporting Information Figures
Supporting Information Movies
Acknowledgments
This work is made possible by a grant from Terry Fox Foundation (2014–2015): “High‐throughput Mechanobiological Assessment of Cancer Cell Cytoskeleton Dynamics after Drug Treatment,” Khalifa University Internal Research Fund (210034), Al Jalila Foundation, UAE National Research Foundation, and the Abu Dhabi Education Council. The authors hereby declare that there is no conflict of interest.
Monitoring Editor: Prof. Manuel Théry
References
- Al‐Mamun MA, Ravenhill L, Hossain MA, Farid D, Bass R. 2014. Fractal and image analysis of cytoskeletal changes in tumour cells due to the effects of maspin. In: Biomedical and Health Informatics (BHI), 2014 IEEE‐EMBS International Conference, Valencia. pp 209–212.
- Anitei M, Hoflack B. 2011. Bridging membrane and cytoskeleton dynamics in the secretory and endocytic pathways. Nat Cell Biol 14:11–19. [DOI] [PubMed] [Google Scholar]
- Baum B, Georgiou M. 2011. Dynamics of adherens junctions in epithelial establishment, maintenance, and remodeling. J Cell Biol 192:907–917. [DOI] [PMC free article] [PubMed] [Google Scholar]
- Belin BJ, Goins LM, Mullins RD. 2015. Comparative analysis of tools for live cell imaging of actin network architecture. Bioarchitecture 1–14. [DOI] [PMC free article] [PubMed] [Google Scholar]
- Bergert M, Chandradoss SD, Desai RA, Paluch E. 2012. Cell mechanics control rapid transitions between blebs and lamellipodia during migration. Proc Natl Acad Sci USA 109:14434–14439. [DOI] [PMC free article] [PubMed] [Google Scholar]
- Bezanilla M, Gladfelter AS, Kovar DR, Lee W‐L. 2015. Cytoskeletal dynamics: a view from the membrane. J Cell Biol 209:329–337. [DOI] [PMC free article] [PubMed] [Google Scholar]
- Campbell EM, Hope TJ. 2003. Role of the cytoskeleton in nuclear import. Adv Drug Deliv Rev 55:761–771. [DOI] [PubMed] [Google Scholar]
- Canny J. 1986. A computational approach to edge detection. IEEE Trans Pattern Anal Mach Intell 8:679–698. [PubMed] [Google Scholar]
- Di Carlo D. 2012. A mechanical biomarker of cell state in medicine. J Lab Autom 17:32–42. [DOI] [PubMed] [Google Scholar]
- Cheung CY, Ong S, Ikram MK, Ong YT, Chen CP, Venketasubramanian N, Wong TY. 2014. Retinal vascular fractal dimension is associated with cognitive dysfunction. J Stroke Cerebrovasc Dis 23:43–50. [DOI] [PubMed] [Google Scholar]
- Costa AF, Tekli J, Juci A, Traina M, Carlos S. 2011. Fast fractal stack: fractal analysis of computed tomography scans of the lung. Proceeding MMAR '11 Proceedings of the 2011 international ACM workshop on Medical multimedia analysis and retrieval, pp. 13–18, ACM New York, NY, USA.
- Flamholz A, Noor E, Bar‐Even A, Liebermeister W, Milo R. 2013. Glycolytic strategy as a tradeoff between energy yield and protein cost. Proc Natl Acad Sci USA 110:10039–10044. [DOI] [PMC free article] [PubMed] [Google Scholar]
- Fletcher DA, Mullins RD. 2010. Cell mechanics and the cytoskeleton. Nature 463:485–492. [DOI] [PMC free article] [PubMed] [Google Scholar]
- Fuseler JW, Valarmathi MT. 2012. Modulation of the migration and differentiation potential of adult bone marrow stromal stem cells by nitric oxide. Biomaterials 33:1032–1043. [DOI] [PubMed] [Google Scholar]
- Fuseler JW, Millette CF, Davis JM, Carver W. 2007. Fractal and image analysis of morphological changes in the actin cytoskeleton of neonatal cardiac fibroblasts in response to mechanical stretch. Microsc Microanal 13:133–143. [DOI] [PubMed] [Google Scholar]
- Fuseler JW, Robichaux JP, Atiyah HI, Ramsdell AF. 2014. Morphometric and fractal dimension analysis identifies early neoplastic changes in mammary epithelium of MMTV‐cNeu mice. Anticancer Res 34:1171–1177. [PubMed] [Google Scholar]
- Haidekker M. 2013. Fractal approaches to image analysis. Adv Biomed Image Anal 310–349. [Google Scholar]
- Hoelzle MK, Svitkina T. 2012. The cytoskeletal mechanisms of cell‐cell junction formation in endothelial cells. Mol Biol Cell 23:310–323. [DOI] [PMC free article] [PubMed] [Google Scholar]
- Huang H, Kamm RD, Lee RT. 2004. Cell mechanics and mechanotransduction: pathways, probes, and physiology. Am J Physiol Cell Physiol 287:C1–C11. [DOI] [PubMed] [Google Scholar]
- Jamora C, Fuchs E. 2002. Intercellular adhesion, signalling and the cytoskeleton. Nat Cell Biol 4:E101–E108. [DOI] [PubMed] [Google Scholar]
- Johnson HE, King SJ, Asokan SB, Rotty JD, Bear JE and Haugh JM. 2015. F‐actin bundles direct the initiation and orientation of lamellipodia through adhesion‐based signaling. J Cell Biol 208:443–455. [DOI] [PMC free article] [PubMed] [Google Scholar]
- Karlon WJ, Hsu PP, Li S, Chien S, McCulloch AD, Omens JH. 1999. Measurement of orientation and distribution of cellular alignment and cytoskeletal organization. Ann Biomed Eng 27:712–720. [DOI] [PubMed] [Google Scholar]
- Li Q, Kumar A, Makhija E, Shivashankar GV. 2014. The regulation of dynamic mechanical coupling between actin cytoskeleton and nucleus by matrix geometry. Biomaterials 35:961–969. [DOI] [PubMed] [Google Scholar]
- Liew G, Wang JJ, Mitchell P, Wong TY. 2008. Retinal vascular imaging: a new tool in microvascular disease research. Circ Cardiovasc Imaging 1:156–161. [DOI] [PubMed] [Google Scholar]
- Lockett S, Verma C, Brafman A, Gudla P, Nandy K, Mimaki Y, Fuchs PL, Jaja J, Reilly KM, Beutler J, Turbyville TJ. 2014. Quantitative analysis of F‐actin redistribution in astrocytoma cells treated with candidate pharmaceuticals. Cytometry A 85:512–521. [DOI] [PMC free article] [PubMed] [Google Scholar]
- McKayed KK, Simpson JC. 2013. Actin in action: imaging approaches to study cytoskeleton structure and function. Cells 2:715–731. [DOI] [PMC free article] [PubMed] [Google Scholar]
- Mège RM, Gavard J, Lambert M. 2006. Regulation of cell‐cell junctions by the cytoskeleton. Curr Opin Cell Biol 18:541–548. [DOI] [PubMed] [Google Scholar]
- Milošević NT, Ristanović D, Gudović R, Rajković K, Marić D. 2007. Application of fractal analysis to neuronal dendritic arborisation patterns of the monkey dentate nucleus. Neurosci Lett 425:23–27. [DOI] [PubMed] [Google Scholar]
- Mofrad MRK. 2009. Rheology of the cytoskeleton. Annu Rev Fluid Mech 41:433–453. [Google Scholar]
- Muralidhar GS, Channappayya SS, Slater JH, Blinka EM, Bovik AC, Frey W, Markey MK. 2008. Comparison of pre‐processing techniques for fluorescence microscopy images of cells labeled for actin. In: AMIA Annual Symposium Proceedings, Valencia. 1044 p. [PubMed]
- Napolitano A, Ungania S, Cannata V. 2012. Fractal dimension estimation methods for biomedical images In: Katsikis V, editor. MATLAB ‐ A Fundamental Tool for Scientific Computing and Engineering Applications. Rijeka, Croatia, Vol. 3 InTech. [Google Scholar]
- Pollard TD, Cooper JA. 2009. Actin, a central player in cell shape and movement. Science 326:1208–1212. [DOI] [PMC free article] [PubMed] [Google Scholar]
- Prager‐Khoutorsky M, Lichtenstein A, Krishnan R, Rajendran K, Mayo A, Kam Z, Geiger B, Bershadsky AD. 2011. Fibroblast polarization is a matrix‐rigidity‐dependent process controlled by focal adhesion mechanosensing. Nat Cell Biol 13:1457–1465. [DOI] [PubMed] [Google Scholar]
- Qian AR, Li D, Han J, Gao X, Di SM, Zhang W, Hu LF, Shang P. 2012. Fractal dimension as a measure of altered actin cytoskeleton in MC3T3‐E1 cells under simulated microgravity using 3‐D/2‐D clinostats. IEEE Trans Biomed Eng 59:1374–1380. [DOI] [PubMed] [Google Scholar]
- Riedl J, Crevenna AH, Kessenbrock K, et al. 2008. Lifeact: a versatile marker to visualize F‐actin. Nat Methods 5:605–607. [DOI] [PMC free article] [PubMed] [Google Scholar]
- Shigetomi E, Bushong EA, Haustein MD, Tong X, Jackson‐Weaver O, Kracun S, Xu J, Sofroniew MV, Ellisman MH, Khakh BS. 2013. Imaging calcium microdomains within entire astrocyte territories and endfeet with GCaMPs expressed using adeno‐associated viruses. J Gen Physiol 141:633–647. [DOI] [PMC free article] [PubMed] [Google Scholar]
- Stricker J, Falzone T, Gardel ML. 2010. Mechanics of the F‐actin cytoskeleton. J Biomech 43:9–14. [DOI] [PMC free article] [PubMed] [Google Scholar]
- Suraneni P, Rubinstein B, Unruh JR, Durnin M, Hanein D, Li R. 2012. The Arp2/3 complex is required for lamellipodia extension and directional fibroblast cell migration. J Cell Biol 197:239–251. [DOI] [PMC free article] [PubMed] [Google Scholar]
- Tian T, Wang Y, Wang H, Zhu Z, Xiao Z. 2010. Visualizing of the cellular uptake and intracellular trafficking of exosomes by live‐cell microscopy. J Cell Biochem 111:488–496. [DOI] [PubMed] [Google Scholar]
- Vishavkarma R, Raghavan S, Kuyyamudi C, Majumder A, Dhawan J. 2014. Role of actin filaments in correlating nuclear shape and cell spreading. PLoS One 10:e0119076. [DOI] [PMC free article] [PubMed] [Google Scholar]
- Wang N, Tytell JD, Ingber DE. 2009. Mechanotransduction at a distance: mechanically coupling the extracellular matrix with the nucleus. Nat Rev Mol Cell Biol 10:75–82. [DOI] [PubMed] [Google Scholar]
- Wang Y, Shyy JY‐J, Chien S. 2008. Fluorescence proteins, live‐cell imaging, and mechanobiology: seeing is believing. Annu Rev Biomed Eng 10:1–38. [DOI] [PubMed] [Google Scholar]
- Waters JC. 2013. Live‐cell fluorescence imaging. Methods Cell Biol 114:125–150. [DOI] [PubMed] [Google Scholar]
- Weichsel J, Herold N, Lehmann M, Krausslich H, Schwarz U. 2010. A quantitative measure for alterations in the actin cytoskeleton investigated with automated high‐throughput microscopy. Cytometry A 77:52–63. [DOI] [PubMed] [Google Scholar]
- Wirtz D. 2009. Particle‐tracking microrheology of living cells: principles and applications. Annu Rev Biophys 38:301–326. [DOI] [PubMed] [Google Scholar]
- Yamaguchi H, Condeelis J. 2007. Regulation of the actin cytoskeleton in cancer cell migration and invasion. Biochim Biophys Acta 1773:642–652. [DOI] [PMC free article] [PubMed] [Google Scholar]
Associated Data
This section collects any data citations, data availability statements, or supplementary materials included in this article.
Supplementary Materials
Supporting Information Movie S1
Supporting Information Movie S2
Supporting Information Movie S3
Supporting Information Movie S4
Supporting Information Movie S5
Supporting Information Movie S6
Supporting Information Movie S7
Supporting Information Movie S8
Supporting Information Movie S9
Supporting Information Movie S10
Supporting Information Figure 1
Supporting Information Figure 2
Supporting Information Figure 3
Supporting Information Figure 4
Supporting Information Figure 5
Supporting Information Figure 6
Supporting Information Figures
Supporting Information Movies