

Abstract
Quantification of blood levels of antipsychotic drugs may be useful for managing medication therapy. This open‐label, parallel‐group study was performed to compare finger‐stick‐based capillary with corresponding venous plasma concentrations for risperidone, paliperidone, quetiapine, olanzapine, and aripiprazole and their major metabolites after repeated dosing in patients with schizophrenia or related illnesses. Finger‐stick‐based capillary and venous blood samples were collected at various times within a dosing interval. All drug concentration measurements in the derived plasma samples were performed with validated liquid chromatography–tandem mass spectrometry methods. Finger‐stick‐based capillary and venous plasma drug concentrations after repeated dosing were generally similar. Olanzapine capillary plasma concentrations, however, were on average approximately 20% higher than venous concentrations, with a trend for a relatively greater difference occurring shortly after dosing. In addition, smaller capillary–venous differences were observed for extended‐release and long‐acting intramuscular formulations and for aripiprazole, a drug with a long half‐life, compared with drugs administered as an immediate‐release formulation (risperidone, olanzapine). After repeated dosing, plasma derived from finger‐stick‐based blood was observed to be predictive of the venous concentrations. Capillary sampling may be an appropriate alternative to venous sampling to readily evaluate systemic drug concentrations.
Keywords: antipsychotic drug monitoring, capillary concentrations, venous concentrations, risperidone, paliperidone, quetiapine, olanzapine, aripiprazole, antipsychotics
Over the last few decades, therapeutic drug monitoring (TDM) has been proven useful to optimize the risk/benefit balance of some drugs, in particular, drugs with a narrow safety margin, a narrow therapeutic concentration window, or high interindividual variation in systemic clearance. However, measurement of systemic drug concentrations may be useful for reasons beyond the classic TDM objectives.1
Currently, there are a variety of antipsychotic drugs approved for treating psychiatric disorders. Poor adherence to antipsychotic treatment is a major challenge, particularly in chronic disorders like schizophrenia, for which lack of adherence results in increased risk of relapse and rehospitalization.2, 3, 4, 5 Nonresponse to medication may be a result of many causes, and clinicians working with patients with schizophrenia or bipolar disorders have no objective test to determine whether lack of response is related to breakthrough symptoms of the underlying illness, the medication regimen itself, or lack of adherence.6, 7, 8, 9, 10
Classic TDM is considered less useful in treatment with antipsychotics because of high interindividual variation in the concentration–response relationship; the same drug concentration may be efficacious in one patient while leading to no or limited effect in another patient. However, at the individual level such a concentration–response relationship, almost by definition for a systemically acting drug, does exist. Knowledge of the systemic drug concentrations when the patient is doing well versus when the patient is not doing well may help to obtain insight in an individual's optimal (target) exposure, enabling patient‐matched TDM, that is, tailoring blood concentrations to the patient's “individual therapeutic range.”
Analysis of systemic drug concentrations is recognized as a valuable tool for patient‐matched psychopharmacotherapy.1 Evaluation of medication adherence can be done using an individual's antipsychotic drug blood or plasma concentrations.11, 12 The relationships between commonly used clinical doses of antipsychotics and the associated plasma concentrations established in the typical population under controlled intake can be used as a reference when interpreting antipsychotic drug levels observed in individual patients.1 Establishing a patient baseline under conditions of controlled drug intake (eg, when hospitalized) may increase the sensitivity of the approach to detect nonadherence.10 In addition, antipsychotic drug blood monitoring may be useful in evaluating reasons for poor tolerability, nonresponse at therapeutic doses, or pharmacokinetic drug–drug interactions.1
Finger‐stick‐based capillary sampling to estimate systemic drug concentrations of antipsychotics may be an easier (in the office setting) and patient‐preferred alternative13, 14 than venous blood sampling provided that both are well correlated. Therefore, a feasibility study was performed15 in which the capillary and venous sampling sites were compared after administration of a single dose of the antipsychotics risperidone, paliperidone, quetiapine, olanzapine, or aripiprazole to healthy volunteers. The study overall showed a good correlation between venous and capillary drug concentrations but also showed a time‐dependent difference, in particular for paliperidone and olanzapine. Based on the findings in the single‐dose study, it was anticipated that the difference between capillary and venous plasma concentrations would be less at steady state, when drug distribution between blood and tissue compartments is stabilized. In the literature, finger‐stick‐based capillary and venous concentrations were reported to be similar after repeated dosing for a number of antipsychotics16 and for other medications (eg, theophylline,17 cyclosporin,18 and tobramycin19). The current study was performed to compare finger‐stick‐based capillary with the corresponding venous plasma concentrations for the same antipsychotics and their major metabolites in patients after repeating dosing of these medications. In parallel with the study presented here, a similar study was initiated by another group of researchers, the results of which were recently published.16
Materials and Methods
The study protocol was reviewed by an independent ethics committee or institutional review board, as applicable for the study site and country (see list in Appendix) in accordance with the ethical principles originating in the Declaration of Helsinki and in accordance with International Conference on Harmonisation Good Clinical Practice guidelines and applicable regulatory requirements and in compliance with the protocol. All participants provided written informed consent. The study is registered at clinical trials.gov as NCT02087579.
Study Design
This parallel‐group, open‐label study was conducted between February and October 2014. Randomization was not used in this study: patients continued to take their prior antipsychotic drug(s), as an oral or long‐acting injectable (LAI) formulation, at the same dose and regimen as before the study.
For patients who received an oral formulation, the antipsychotic drug was administered in the same manner and in the same relation to food as before the study. The daily dose of the patients’ drugs were not to be changed from at least 2 weeks (aripiprazole) or 1 week (risperidone, paliperidone, quetiapine, and olanzapine) before day ‐1 up to the end of the study. For patients who received an LAI formulation (risperidone or paliperidone), the stay in the study center was scheduled such that no LAI injection was due during the study. Blood samples were collected during a 3‐day observation period. The study was conducted in 18 centers across 7 countries.
Study Population and Drug Treatment
Patients with a diagnosis of a psychiatric disorder that was an approved indication for the medication, of either sex, aged 18 to 70 years (inclusive), with a body mass index between 17 and 40 kg/m2 and a body weight not less than 47 kg were enrolled. The patients were being treated with 1 of the 5 antipsychotic drugs (or a combination) as therapy for the treatment of their disease. They continued to take the same formulation and brand name of the medication as prescribed by their regular clinician. Allowed formulations included all available oral formulations, for example, immediate‐release (IR) tablets or capsules, orally disintegrating tablets, extended release (ER) tablets, oral solutions. A subset of patients in the risperidone and paliperidone groups were treated with an LAI formulation. Patients were enrolled such that the full range of approved dose levels for each antipsychotic drug was covered.
Women of childbearing potential enrolled in the study were not pregnant or breast‐feeding and agreed to take appropriate precautions to avoid pregnancy before entry and throughout the study. The use of concomitant medication was allowed within the limitations of the respective approved drug labels and the criteria in the protocol, on condition that doses remained stable throughout the study. Metabolic inducers or strong inhibitors of hepatic enzymes or transporters that could potentially influence the pharmacokinetics of these antipsychotic drugs were not to be changed from 14 days (inducer) or 7 days (inhibitor) before day ‐1 to the time of the last sample collection.
The study was performed in patients (instead of in healthy subjects) for reasons of potential intolerability of the medications in healthy subjects (ie, the risk for extrapyramidal symptoms), especially because the full range of dose levels of the antipsychotics was to be covered. In addition, the subjects received multiple dosing to obtain steady‐state metabolite information.
Blood Collection
Venous blood samples were collected for population pharmacokinetic (PK) modeling from all patients in the aripiprazole, olanzapine, and quetiapine cohorts at 8 scheduled times within the dosing interval. The results of population PK modeling will be reported elsewhere. Three milliliters of venous blood was collected and centrifuged at 1300 g.
In a subset of these patients and for subjects in the risperidone and paliperidone cohorts, finger‐stick‐based capillary blood samples were collected at 6 of the 8 scheduled times within 10 minutes after the venous sample (ie, at predose and 1, 2, 4, 6, and 12 hours postdose for oral formulations and at predefined clock times for LAI formulations). A safety lancet was used for puncturing the site, and at least 0.375 mL and up to 0.5 mL of capillary blood was collected. Capillary blood was centrifuged for a minimum of 3 minutes at 2000 g.
The derived venous and capillary plasma aliquots were stored at –20°C or lower within 2 hours of collection, and were shipped frozen for later drug concentration measurements of the antipsychotic drugs.
Analytical Methods
For patients taking paliperidone, quetiapine, or olanzapine, concentrations of the parent compound and for patients taking risperidone or aripiprazole, concentrations of the parent compound and the major metabolite (9‐hydroxyrisperidone [paliperidone] and dehydroaripiprazole, respectively) were determined in plasma using validated liquid chromatography–tandem mass spectrometry methods.20 In addition, for patients taking aripiprazole or risperidone, the sum of parent drug and measured metabolite was calculated (“aripiprazole active moiety” and “risperidone active moiety”).
Using 0.025‐mL aliquots of sample for analysis, the lower limits of quantification for plasma assays were as follows: 0.100 ng/mL for risperidone, paliperidone (9‐hydroxyrisperidone), and olanzapine; 2.00 ng/mL for quetiapine, and 1.00 ng/mL for aripiprazole and dehydroaripiprazole.
For the plasma assays, the intrabatch accuracy ranged from 88.6% to 117.3%, the interbatch accuracy ranged from 94.1% to 106.4%, and the interbatch precision ranged from 1.7% to 7.4%.
Safety Assessments
Safety assessments throughout the study included monitoring treatment‐emergent adverse events (TEAEs), clinical laboratory tests, vital sign measurements, physical examinations, and Columbia Suicide Severity Rating Scale.
Statistical Methods
Data were excluded from the statistical analyses if capillary and venous samples were collected more than 20 minutes apart.
To evaluate the relationship for each analyte, Deming regression models were fitted to the individual log‐transformed capillary concentrations with corresponding individual log‐transformed venous concentration as a predictor and assuming that the ratio of the analytical standard deviations of the capillary and venous concentrations equal 1 (λ = 1). The 95% confidence intervals (CIs) were calculated for the intercept and slope.21 Deming regression is an extension of ordinary linear regression to handle random measurement errors in independent or explanatory variable (X) as well as dependent variable (Y). Deming regression considers both X and Y subject to measurement error, whereas ordinary linear regression assumes that only the Y measurements are associated with random measurement errors.
Concordance correlation coefficients between the 2 sample types were calculated for each group.
Percentage differences (%difference) for capillary versus corresponding venous concentrations were calculated at each time as follows: ([concentration capillary/concentration venous] × 100%) – 100%, and descriptive statistics were calculated per analyte and time.
All patients for whom at least 1 sample was taken for drug concentration measurement were included in the safety analysis.
Statistical analyses were performed using SAS Software version 9.2 (SAS Institute Inc., Cary, North Carolina).
Results
Study Population
Three hundred and five patients (risperidone, 21 patients; paliperidone, 24 patients; quetiapine, 82 patients; olanzapine, 95 patients; and aripiprazole, 83 patients) were enrolled in this study, of whom 304 patients completed the study. One patient in the quetiapine group was withdrawn from the study because of an adverse event. The demographic and baseline characteristics were comparable across the different groups. The majority of the patients were white (n = 184), and there were more men (n = 198) than women (n = 107). Patients had a median age of 46.0 years (range, 18 to 67 years), a median body weight of 87.0 kg (range, 50.9 to 145.3 kg), and a median body mass index of 29.6 kg/m2 (range, 17.8 to 40.5 kg/m2).
Both capillary and venous samples were collected in 179 of these patients. Some subjects were treated with more than 1 of the studied antipsychotics such that plasma concentration data were included in the analyses from patients in the risperidone (n = 21), paliperidone (n = 22), quetiapine (n = 40), olanzapine (n = 73), and aripiprazole (n = 25) groups. The sample size in the quetiapine and olanzapine groups had been increased based on the results of an interim analysis showing higher variability than anticipated for these 2 medications.
Drug Concentrations
In the risperidone group, 1 patient was identified with consistently aberrant drug concentrations: capillary levels of the risperidone active moiety in this subject were much higher (up to 18‐fold) than the venous levels for unknown reason. Data from this patient were therefore excluded from the statistical analysis. Contamination of the finger or finger‐stick‐derived plasma sample by drug in saliva may be a possible explanation; for this subject a high level of fluctuation in capillary risperidone concentrations was observed, whereas this was not the case for venous risperidone concentrations. In addition, for 9‐hydroxyrisperidone, capillary‐venous differences were in the same range as for the other subjects.
For all analytes there was close agreement between capillary and venous plasma concentrations (Figure 1, Figure 2, and, as supplementary online information, Supplementary Figure S1 to Supplementary Figure S3). There were no statistically significant differences between capillary and venous drug concentrations except for olanzapine (Table 1): capillary olanzapine plasma concentrations were on average approximately 20% higher than venous concentrations, with a wide range of individual %difference values, mostly within 50% (Figure 4). The regression analyses confirmed a linear correlation between capillary and venous plasma concentrations for all analytes. Estimated slopes of the Deming regression analyses are presented in Table 1. Concordance correlation coefficients were close to 1 for all parent drugs, the measured metabolites, and the sums of parent drug and metabolite (range between 0.95 and 0.99; olanzapine, 0.92).
Figure 1.
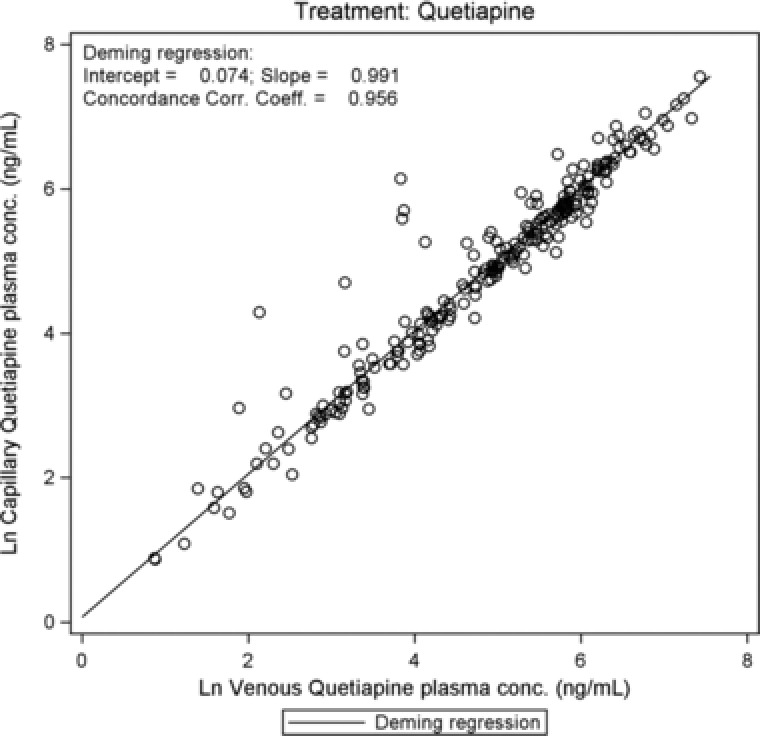
Quetiapine: scatterplot of log‐transformed capillary versus venous plasma concentrations with regression line.
Figure 2.
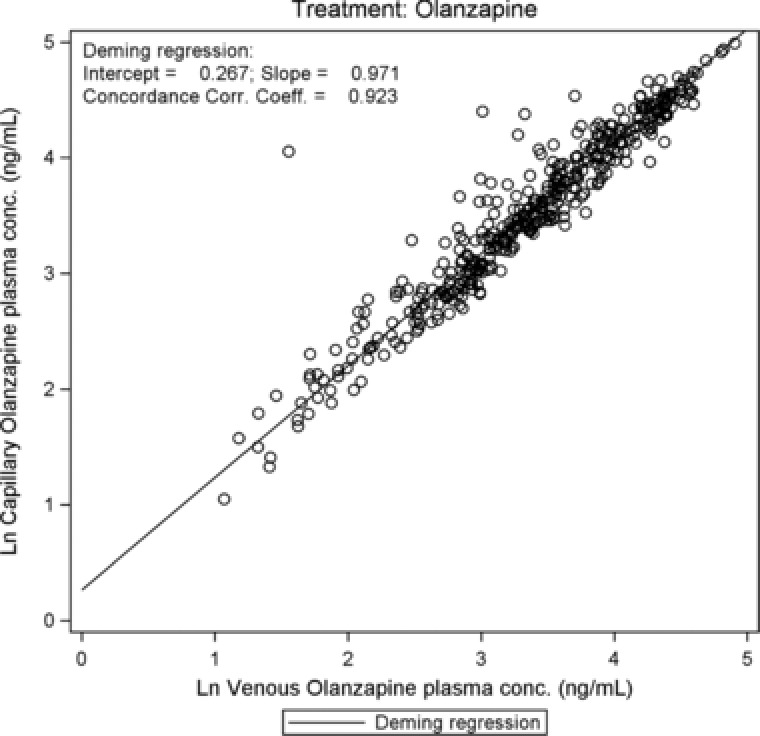
Olanzapine: scatterplot of log‐transformed capillary versus venous plasma concentrations with regression line.
Table 1.
Results of Deming Regression Analyses on Natural Log‐Transformed Capillary and Venous Plasma Concentrations
| Group | Analyte | Coefficient | Number of Paired Samples | Estimate | SE | 95%CI |
|---|---|---|---|---|---|---|
| Risperidone | Risperidone | Intercept | 114 | 0.069 | 0.058 | (–0.046 to 0.183) |
| Slope | 114 | 0.976 | 0.019 | (0.938–1.015) | ||
| CCC | 114 | 0.974 | — | (0.963–0.982) | ||
| Risperidone active moietya | Intercept | 117 | 0.001 | 0.034 | (–0.065 to 0.068) | |
| Slope | 117 | 1.001 | 0.009 | (0.984–1.019) | ||
| CCC | 117 | 0.992 | — | (0.989–0.994) | ||
| Paliperidone | Paliperidone | Intercept | 130 | 0.020 | 0.028 | (–0.036 to 0.075) |
| Slope | 130 | 0.994 | 0.009 | (0.976–1.012) | ||
| CCC | 130 | 0.989 | — | (0.986–0.992) | ||
| Quetiapine | Quetiapine | Intercept | 229 | 0.074 | 0.082 | (–0.087 to 0.236) |
| Slope | 229 | 0.991 | 0.015 | (0.962–1.020) | ||
| CCC | 229 | 0.956 | — | (0.944–0.966) | ||
| Olanzapine | Olanzapine | Intercept | 419 | 0.267 | 0.049 | (0.171–0.363) |
| Slope | 419 | 0.971 | 0.013 | (0.945–0.996) | ||
| CCC | 419 | 0.923 | — | (0.907–0.936) | ||
| Aripiprazole | Aripiprazole | Intercept | 141 | –0.018 | 0.044 | (–0.104 to 0.068) |
| Slope | 141 | 1.004 | 0.009 | (0.987–1.020) | ||
| CCC | 141 | 0.989 | — | (0.984–0.992) | ||
| Aripiprazole active moietyb | Intercept | 141 | –0.038 | 0.045 | (–0.128 to 0.051) | |
| Slope | 141 | 1.006 | 0.008 | (0.990–1.022) | ||
| CCC | 141 | 0.989 | — | (0.985–0.992) |
95%CI, 95% confidence interval; CCC, concordance correlation coefficient; SE, standard error.
Risperidone active moiety: risperidone + 9‐hydroxyrisperidone.
Aripiprazole active moiety: aripiprazole + dehydroaripiprazole.
Figure 4.
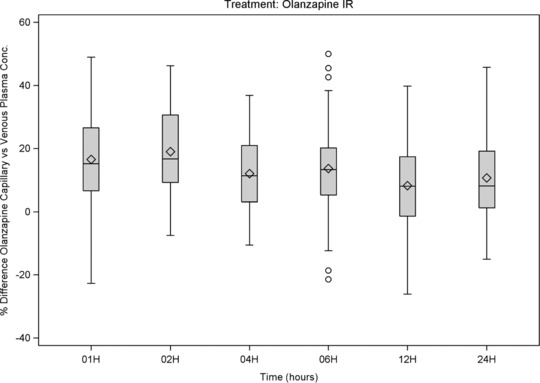
Olanzapine: box‐and‐whiskers plots of %differences (capillary vs venous plasma concentration) versus time of sampling, showing interquartile range (box), mean (diamond), median (horizontal line), 1.5 × the interquartile range (whiskers), and outlying values up to ±50% (circle).
Median %differences were below 10% for most and below 22% for all compounds and times (Figure 3, Figure 4, and, as supplementary online information, Supplementary Figure S4 to Supplementary Figure S6). No clear relationships were observed between %differences and time after dosing. A trend for lower %differences was observed for ER and LAI formulations and for aripiprazole, a drug with a long half‐life. These results confirm that the equilibrium between capillary and venous plasma drug concentrations is generally present at steady state.
Figure 3.
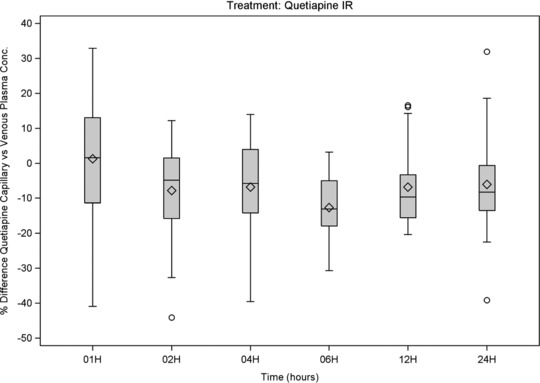
Quetiapine: box‐and‐whiskers plots of %differences (capillary vs venous plasma concentration) versus time of sampling, showing interquartile range (box), mean (diamond), median (horizontal line), 1.5 × the interquartile range (whiskers), and outlying values up to ±50% (circle).
For some individual sample pairs, a %difference of more than 100% was observed, but only for IR formulations and at various times, and in all these cases the capillary concentration was greater than the venous concentration. For paliperidone, a drug that is only available as ER formulation, and for aripiprazole, a drug with a half‐life of 60 to 80 hours,1 no %differences of >100% were observed. The highest %differences were generally observed at low venous concentrations, such that even though the %difference was high, the absolute difference was small.
Safety
No deaths were reported. Two patients were reported with serious adverse events (SAEs), one of whom was a screen failure who was reported with SAEs of psychiatric disorder and convulsions, and the other (paliperidone cohort) was reported with an event of psychotic disorder 2 days after the completion of the study. In the quetiapine group, 1 patient with increased blood pressure was withdrawn from the study because of this adverse event. A total of 22 patients reported at least 1 TEAE during the study. Most of the TEAEs were considered by the investigator to be mild in intensity. All the TEAEs were considered by the investigator to be unrelated to the antipsychotic drugs being monitored, except for an event of dry mouth, considered probably related.
Discussion
The present study was performed to compare capillary and venous plasma concentrations of risperidone, paliperidone, quetiapine, olanzapine, and aripiprazole and selected metabolites after repeated dosing in patients. Based on the results of a similar single‐dose study in healthy volunteers,15 it was anticipated that capillary drug concentrations would be more similar to the corresponding venous concentrations after repeated dosing, that is, when an equilibrium was reached between systemic and tissue drug concentrations. This was indeed confirmed in the current study, as well as in another study that was performed in parallel by another research group. In that study using samples taken from subjects receiving stable doses of their antipsychotics for at least 7 days, concentrations in dried blood spots obtained from finger‐stick‐based capillary sampling were similar to those in dried blood spots obtained from venous sampling.16
In the current study, there was a close agreement between the capillary and venous concentrations in plasma: the regression analyses confirmed a linear correlation between (log‐transformed) capillary and venous plasma concentrations for all measured parent drugs, metabolites, and sums of parent drug and metabolite. Except for olanzapine, no statistical differences were found between the capillary and venous drug concentrations. For olanzapine, the intercept (0.267; 95%CI, 0.171–0.363) and slope (0.971; 95%CI, 0.945–0.996) estimates of the regression line were slightly though statistically significantly different from 0 and 1, respectively. As in the single‐dose study,15 but to a lesser extent, the capillary plasma concentrations of olanzapine were in general higher than the venous plasma concentrations. This difference may need to be taken into consideration when interpreting results using reference ranges that are based on venous drug concentrations. However, given the large therapeutic window and the large variation in concentration/dose ratios across the population, such difference is not considered clinically meaningful by the authors.15 The median difference was below 10% for most compounds and below 22% for all compounds at the indicated times, with no clear relationship between the %difference and the time after dosing or the drug formulation. However, a tendency for lower %differences was observed for drugs with less fluctuation, that is, for the ER and LAI formulations and for aripiprazole, a drug with a long half‐life.
The average %difference on drug administration was smaller in the multiple‐dose study compared with the single‐dose study,15 that is, under conditions when equilibrium was reached between drug concentrations in tissue and blood. Likewise, in the literature, finger‐stick‐based capillary and venous concentrations were reported to be similar after repeated dosing for a number of antipsychotics16 and for, for example, theophylline,17 cyclosporin,18 and tobramycin.19
Finally, variability (in %difference) was evaluated. When comparing 2 results obtained with a bioanalytical assay exhibiting acceptable performance (eg, 10% to 15% precision), one could expect a relatively wide distribution of the %difference for the individual samples; the distribution of %differences in the present multiple‐dose study overlapped with the distributions obtained through a trial simulation that assumed that the assays were subject to a precision (%CV) of 10% to 15% (Figure 5). To illustrate this, a data set of 5000 true values was simulated (Minitab 16). For each true value an assay 1 and assay 2 result was simulated by assigning a random error to each of the 2 assay results, sampling from a normal distribution. Each assay was assumed to have an imprecision of either 10% or 15%. For each data pair the %difference was calculated ([assay 2 – assay1/assay 1] × 100%), and the 2 distributions of the %errors were presented (Figure 5) in addition to the %difference observed for olanzapine (as worst case) in this study. However, given the assay precision (5% to 13%) in the present multiple‐dose and previous single‐dose studies,15 it is clear that the capillary sampling contributed to the variability to some extent. Also, individual cases of a higher %difference value were observed in the multiple‐dose study. These were only present for patients taking IR formulations and at low venous concentrations, and in all these cases the capillary concentration was greater than the venous concentration. The differences observed are considered clinically irrelevant given the typical intra‐ and interpatient variability in drug plasma concentrations and given that the absolute differences in capillary versus venous concentrations were relatively low.
Figure 5.
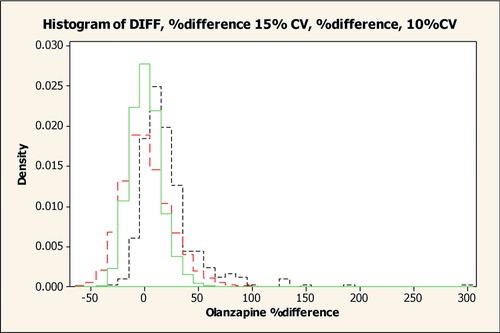
Observed and simulated distribution of olanzapine %differences with different assay precision. Black line, observed distribution of olanzapine %differences; green line, simulated distribution of olanzapine %differences with assay precision of 10%CV; red line, simulated distribution of olanzapine %differences with assay precision of 15%CV.
According to Chiou,22, 23 the arteriovenous difference is dependent on physicochemical (tissue distribution), pharmacokinetic (clearance, volume of distribution), and physiological (blood flow) factors. Therefore, the %difference between capillary and venous drug concentration may differ, for example, dependent on blood flow. However, given the demographics of the study population, the study is considered representative of the patient population.
In general, the antipsychotic medications were well tolerated, which was to be expected because patients were to be stable on medications before entering the study. Despite the relatively large capillary sampling, the procedures were generally well tolerated.
Conclusions
For risperidone, paliperidone, quetiapine, and aripiprazole, close agreement was observed between finger‐stick‐based capillary and venous concentrations following repeated dosing. For olanzapine capillary plasma concentrations were on average approximately 20% higher than venous concentrations, and these differences should be considered when interpreting olanzapine data based on capillary sampling. Therefore, taking the observed differences for olanzapine into account, plasma derived from finger‐stick‐based blood is expected to be predictive of the venous concentrations and can be used for therapeutic drug monitoring for these drugs to evaluate patient adherence and to tailor the blood concentrations to the patient's “individual therapeutic range” to better achieve the best balance of efficacy and tolerability.
Supporting information
Disclaimer: Supplementary materials have been peer‐reviewed but not copyedited.
Supporting information
Supporting information
Supporting information
Supporting information
Supporting information
Supporting information
Supporting information
Acknowledgments
The authors thank the investigators, staff, and volunteers for their participation in the study and W&D Consulting bvba for assistance with article preparation.
Declaration of Conflicting Interests
The authors are or were employees of Janssen Research & Development and potentially own stock and/or stock options in the company.
Contributorship
All authors met ICMJE criteria for authorship, and anyone who met those criteria is listed as an author. Bart Remmerie and Adam Savitz supervised the study design, analysis, reporting, and data interpretation of the study results. Marc De Meulder supervised the bioanalytical analysis. Jay Ariyawansa supervised the statistical analysis. All authors critically revised and approved the final article and gave permission to submit for publication.
Funding
The study was funded by Janssen Research & Development, LLC, Raritan, New Jersey.
American College of Clinical Pharmacology
None of the authors are fellows of the American College of Clinical Pharmacology.
The study protocol was reviewed by an independent ethics committee or institutional review board, as applicable for the study site and country: Comité de Ética CER Investigaciones Clínicas CECIC, Buenos Aires, Argentina; Comité de Ética del Instituto Médico Platense—CEDIMP, Buenos Aires, Argentina; CIEIS Sanatorio Morra, Córdoba, Argentina; Comité de Ética IPEM, Buenos Aires, Argentina; Ethisch Comité O.L. Vrouwenziekenhuis, Aalst, Belgium; Commissie voor Medische Ethiek—ZNA/OCMW Antwerpen, Antwerpen, Belgium; Commissie Medische Ethiek UPC St‐Jozef, Psychiatrisch Centrum Kortenberg, Belgium; Commissie Medische Ethiek AZ‐VUB, Jette, Belgium; Comité de Ética em Pesquisa do Hospital Pro Cardiaco, Rio de Janeiro, Brazil; Comité de Ética em Pesquisa da Faculdade de Medicina de Jundiai, Jundiai, Brazil; CONEP—Comissao Nacional de Ética em Pesquisa, Brasilia, Brazil; Local Ethics Committee at Mental Health Center Prof. Ivan Temkov, Bourgas, Bulgaria; Landesamt fuer Gesundheit und Soziales Berlin, Geschaeftsstelle der EK des Landes Berlin, Berlin, Germany; Ethik‐Kommission der Aerztekammer Hamburg, Hamburg, Germany; Ethik‐Kommission der Aerztekammer Schleswig‐Holstein, Bad Segeberg, Germany; CEIC Hospital Gral. Universitario Gregorio Maranon, Madrid, Spain; EC of Hospital Infanta Cristina, Badajoz, Spain; CEIC Área de Salud de Zamora Hospital Virgen de la Concha, Zamora, Spain; CEIC Parc de Salut Mar, Barcelona, Spain; CEIC Hospital de Torrevieja, Torrevieja, Spain; Sterling Institutional Review Board, Atlanta, Georgia, USA). This study was conducted at multiple study centers: Clinica Privada Banfield, Buenos Aires, Argentina; Clínica Témpora (Instituto Psicoterapéutica Tempora Srl), Buenos Aires, Argentina; Clínica Privada de Salud Mental Santa Teresa de Avila, La Plata, Argentina; Sanatorio Prof. Leon Morra, Córdoba, Argentina; O.L.V. Ziekenhuis, Aalst, Belgium; SGS Life Science Services, Antwerpen, Belgium; Universitair Ziekenhuis St.‐Jozef, Kortenberg, Belgium; UZ Brussel, Brussel, Belgium; Centro de Psiquiatria e Pesquisas Sandra Ruschel, Rio de Janeiro, Brazil; Lal Clínica Pesquisa e Desenvolvimento Ltda, Valinhos, Brazil; Mental Health Center Prof. Ivan Temkov, Bourgas, Bulgaria; Charité Research Organisation GmbH, Berlin, Germany; CTC North GmbH & Co. KG, Am Universitätsklinikum Hamburg‐Eppendorf, Hamburg, Germany; CRS Clinical Research Services Kiel GmbH‐am Universitätsklinikum Schleswig‐Holstein Campus Luebeck, Luebeck, Germany; Complejo Asistencial de Zamora, Zamora, Spain; Centro Asistencial Dr. Emili Mira I Lopez, Barcelona, Spain; Hospital de Torrevieja, Torrevieja, Spain; Neurobehavioral Research, Inc, Cedarhurst, New York, USA; Alexian Behavioral Health Hospital, Hoffman Estates, Illinois, USA; Atlanta Center for Medical Research, Atlanta, Georgia, USA; Collaborative NeuroScience Network, Inc., Garden Grove, California, USA; Accurate Clinical Trials, Inc., Kissimmee, Florida, USA; FutureSearch Clinical Trials LP, Austin, Texas, USA.
References
- 1. Hiemke C, Baumann P, Bergemann N, et al. AGNP Consensus Guidelines for Therapeutic Drug Monitoring in Psychiatry: update 2011. Pharmacopsychiatry. 2011;44:195–235. [DOI] [PubMed] [Google Scholar]
- 2. Coppola D, Liu Y, Gopal S, et al. A one‐year prospective study of the safety, tolerability and pharmacokinetics of the highest available dose of paliperidone palmitate in patients with schizophrenia. BMC Psychiatry. 2012;12:26. [DOI] [PMC free article] [PubMed] [Google Scholar]
- 3. Gopal S, Vijapurkar U, Lim P, Morozova M, Eerdekens M, Hough D. A 52‐week open‐label study of the safety and tolerability of paliperidone palmitate in patients with schizophrenia. J Psychopharmacol. 2011;25:685–697. [DOI] [PubMed] [Google Scholar]
- 4. Haddad PM, Brain C, Scott J. Nonadherence with antipsychotic medication in schizophrenia: challenges and management strategies. Patient Relat Outcome Meas. 2014;5:43–62. [DOI] [PMC free article] [PubMed] [Google Scholar]
- 5. Schennach R, Obermeier M, Meyer S, et al. Predictors of relapse in the year after hospital discharge among patients with schizophrenia. Psychiatr Serv. 2012;63:87–90. [DOI] [PubMed] [Google Scholar]
- 6. Velligan DI, Weiden PJ, Sajatovic M, et al. The expert consensus guideline series: adherence problems in patients with serious and persistent mental illness. J Clin Psychiatry. 2009;70(Suppl 4):1–46;quiz 47–48. [PubMed] [Google Scholar]
- 7. Marder SR. Overview of partial compliance. J Clin Psychiatry. 2003;64(Suppl 16):3–9. [PubMed] [Google Scholar]
- 8. Byerly M, Fisher R, Whatley K, et al. A comparison of electronic monitoring vs. clinician rating of antipsychotic adherence in outpatients with schizophrenia. Psychiatry Res. 2005;133:129–133. [DOI] [PubMed] [Google Scholar]
- 9. Bitter I, Feher L, Tenyi T, Czobor P. Treatment adherence and insight in schizophrenia. Psychiatr Hung. 2015;30:18–26. [PubMed] [Google Scholar]
- 10. Schirmer UB, Steinert T, Flammer E, Borbe R. Skills‐based medication training program for patients with schizophrenic disorders: a rater‐blind randomized controlled trial. Patient Prefer Adherence. 2015;9:541–549. [DOI] [PMC free article] [PubMed] [Google Scholar]
- 11. Perry PJ, Sanger T, Beasley C. Olanzapine plasma concentrations and clinical response in acutely ill schizophrenic patients. J Clin Psychopharmacol. 1997;17:472–477. [DOI] [PubMed] [Google Scholar]
- 12. Bowskill SV, Handley SA, Fisher DS, Flanagan RJ, Patel MX. Risperidone and total 9‐hydroxyrisperidone in relation to prescribed dose and other factors: data from a therapeutic drug monitoring service, 2002‐2010. Ther Drug Monit. 2012;34:349–355. [DOI] [PubMed] [Google Scholar]
- 13. Bogers JP, Bui H, Herruer M, Cohen D. Capillary compared to venous blood sampling in clozapine treatment: patients and healthcare practitioners experiences with a point‐of‐care device. Eur Neuropsychopharmacol. 2015;25:319–324. [DOI] [PubMed] [Google Scholar]
- 14. Woods K, Douketis JD, Schnurr T, Kinnon K, Powers P, Crowther MA. Patient preferences for capillary vs. venous INR determination in an anticoagulation clinic: a randomized controlled trial. Thromb Res. 2004;114:161–165. [DOI] [PubMed] [Google Scholar]
- 15. Remmerie B, De Meulder M, Weiner S, Savitz A. Comparison of capillary and venous drug concentrations after administration of a single dose of risperidone, paliperidone, quetiapine, olanzapine or aripirazole. Clin Pharmacol Drug Dev. 2016. [Epub ahead of print]. [DOI] [PMC free article] [PubMed] [Google Scholar]
- 16. Patteet L, Maudens KE, Stove CP, et al. Are capillary DBS applicable for therapeutic drug monitoring of common antipsychotics? A proof of concept. Bioanalysis. 2015;7:2119–2130. [DOI] [PubMed] [Google Scholar]
- 17. Umstead GS, Rosen JP. Comparison of theophylline concentrations in venous blood and capillary blood in asthmatic children. Clin Chem. 1979;25:1837–1839. [PubMed] [Google Scholar]
- 18. Merton G, Jones K, Lee M, Johnston A, Holt DW. Accuracy of cyclosporin measurements made in capillary blood samples obtained by skin puncture. Ther Drug Monit. 2000;22:594–598. [DOI] [PubMed] [Google Scholar]
- 19. Lewis AS, Taylor G, Williams HO, Lewis MH. Comparison of venous and capillary blood sampling for the clinical determination of tobramycin serum concentrations. Br J Clin Pharmacol. 1985;20:597–601. [DOI] [PMC free article] [PubMed] [Google Scholar]
- 20. De Meulder M, Waldron MP, Li L, et al. Development and validation of HILIC–ESI/MS/MS methods for simultaneous quantitation of several antipsychotics in human plasma and blood. Bioanalysis. 2016;8(8):765–794. [DOI] [PubMed] [Google Scholar]
- 21. Linnet K. Performance of Deming regression analysis in case of misspecified analytical error ratio in method comparison studies. Clin Chem. 1998;44:1024–1031. [PubMed] [Google Scholar]
- 22. Chiou WL. The phenomenon and rationale of marked dependence of drug concentration on blood sampling site. Implications in pharmacokinetics, pharmacodynamics, toxicology and therapeutics (Part I). Clin Pharmacokinet. 1989;17:175–199. [DOI] [PubMed] [Google Scholar]
- 23. Chiou WL. The phenomenon and rationale of marked dependence of drug concentration on blood sampling site. Implications in pharmacokinetics, pharmacodynamics, toxicology and therapeutics (Part II). Clin Pharmacokinet. 1989;17:275–290. [DOI] [PubMed] [Google Scholar]
Associated Data
This section collects any data citations, data availability statements, or supplementary materials included in this article.
Supplementary Materials
Disclaimer: Supplementary materials have been peer‐reviewed but not copyedited.
Supporting information
Supporting information
Supporting information
Supporting information
Supporting information
Supporting information
Supporting information