

Abstract
Purpose
To examine possible hemodynamic alterations in adolescent to adult Marfan syndrome (MFS) patients with aortic root dilatation.
Materials and Methods
Four‐dimensional flow MRI was performed in 20 MFS patients and 12 age‐matched normal subjects with a 3T system. The cross‐sectional areas of 10 planes along the aorta were segmented for calculating the axial and circumferential wall shear stress (WSSaxial, WSScirc), oscillatory shear index (OSIaxial, OSIcirc), and the nonroundness (NR), presenting the asymmetry of segmental WSS. Pearson's correlation analysis was performed to present the correlations between the quantified indices and the body surface area (BSA), aortic root diameter (ARD), and Z score of the ARD. P < 0.05 indicated statistical significance.
Results
Patients exhibited lower WSSaxial in the aortic root and the WSScirc in the arch (P < 0.05–0.001). MFS patients exhibited higher OSIaxial and OSIcirc in the sinotubular junction and arch, but lower OSIcirc in the descending aorta (all P < 0.05). The NR values were lower in patients (P < 0.05). The WSSaxial or WSScirc exhibited moderate to strong correlations with BSA, ARD, or Z score (R2 = 0.50–0.72) in MFS patients.
Conclusion
The significant differences in the quantified indices, which were associated with BSA, ARD, or Z score, in MFS were opposite to previous reports for younger MFS patients, indicating that altered flows in MFS patients may depend on the disease progress. The possible time dependency of hemodynamic alterations in MFS patients strongly suggests that longitudinal follow‐up of 4D Flow is needed to comprehend disease progress. J. Magn. Reson. Imaging 2016;44:500–508.
Keywords: Marfan syndrome, aorta, 4D flow, dilatation, wall shear stress
Marfan syndrome (MFS) is an autosomal dominant condition exhibiting complete penetrance, but with a variable expression.1, 2 In the majority of cases a mutation in the fibrillin 1 (FBN1) gene, discovered at chromosome 15, promotes fibrillinopathy.3 In the aorta, the defective tissues showed increased alcianophilic glycosominoglycans, vacuoles secondary to the loss of smooth muscle cells, and disordered adhesive proteins.4 This makes patients more susceptible to shear stress, leading to aortic dilatation and dissection over time.4 At present, FBN1 molecular analysis is a valuable diagnostic method for obtaining information regarding MFS in clinical practice, especially for children who may not present initially with aortic dilatation.5
The aorta is a critical area for interactions between structural microfibril matrix abnormalities heightened by the failure of standard maintenance programs by TGF‐β and beat‐to‐beat hemodynamic stressors.1 A dangerous environment for abnormal connective tissue emerges following endothelial shear stress, wall strain, torsion, and intrinsic wall stress, resulting in thinning of the aortic wall that progressively dilates and loses distensibility, thereby increasing the risks of aneurysm and dissection throughout its length, particularly at the root.1 In clinical practice, the aortic root diameter (ARD) usually is measured through transthoracic echocardiography at the level of the aortic annulus, sinus of Valsalva, sinotubular junction, and ascending aorta (AAo), according to a report by the American Society of Echocardiography.6 The mortality and event rates are significantly higher in adults with MFS when the absolute ARD is >5 cm.1, 7
The entire aorta can be imaged using time‐resolved 3D (4D) flow MRI acquired with phase‐contrast imaging,8 and complications including aneurysm formations, dissection, and previous operations are usually well visualized, rendering it suitable for longitudinal follow‐ups. Several previous studies have qualitatively and quantitatively identified abnormal flow patterns or have reported flow‐related indices in MFS patients. Groenink et al indicated decreased aortic distensibility and increased flow wave velocity at specified levels of normal‐sized aorta for patients with a dilated aortic root.9 Geiger et al investigated MFS flow patterns and reported that local helix flow in the AAo, which can be observed in young asymptomatic MFS patients, was closely associated with an enlarged aortic sinus.10 Geiger et al also reported that young asymptomatic MFS patients had a mild reduction in peak systolic velocity as well as a significant increase in regional wall shear stress (WSS) in specific segments in the AAo.11 The aortic characteristics of MFS patients may change, possibly leading to different alterations in aortic hemodynamics.
At present, quantitative analysis of hemodynamic parameters, WSS, and oscillatory shear index (OSI) for relatively young MFS patients has been performed.11 However, systematic investigations on adolescent to adult MFS patients are lacking. Moreover, the association of the WSS and OSI with body surface area (BSA), dilated ARD, and Z score remains deficient, resulting in difficulties in evaluating the risk of aortic dissection in this group of patients. Therefore, the purpose of this study was to examine the possible hemodynamic alterations in adolescent to adult MFS patients with aortic root dilatation. We analyzed the WSS, OSI, and other hemodynamic parameters from aortic root to descending aorta (DAo) through noninvasive 4D Flow MRI.
Materials and Methods
Study Cohort
We recruited 20 MFS patients (age = 30 ± 12 [range = 12–54, median = 26] years, male:female = 14:6) who had no history of aortic dissection and 12 normal subjects who had no history of cardiovascular disease (age = 26 ± 8 [range = 20–48, median = 23] years, male:female = 6:6). The BSA of each participant was calculated using the method proposed by Du Bois et al.12 This study was approved by the local ethics board, and informed consent was obtained from all participants, including their parents if subjects were younger than 18 years old. Table 1 lists a summary of the demographics of MFS patients and normal subjects.
Table 1.
Characteristics of the Study Cohort
| Normal (n = 12) | MFS (n = 20) | P value | |
|---|---|---|---|
| Number (male:female) | 12 (6:6) | 20 (14:6) | |
| Age (years) | 26 ± 8 (range: 20 ‐ 48) (median = 23) | 30 ± 12 (range: 12 ‐ 54) (median = 26) | 0.149 |
| Height (cm) | 170.2 ± 8.7 | 178.9 ± 11.0 | 0.013 |
| Weight (kg) | 60.5 ± 10.4 | 70.0 ± 17.5 | 0.038 |
| BSA (m2) | 1.7 ± 0.2 | 1.9 ± 0.2 | 0.013 |
| Systolic pressure (mmHg) | 122.3 ± 14.3 | 125.8 ± 10.1 | 0.241 |
| Diastolic pressure (mmHg) | 75.4 ± 7.1 | 70.6 ± 11.8 | 0.085 |
| Heart rate (bpm) | 81.8 ± 9.2 | 72.8 ± 14.8 | 0.031 |
| Aortic root diameter (cm) | 2.5 ± 0.4 (median = 2.6) | 3.9 ± 0.9 (median = 3.7) | < 0.001 |
| Z score (a.u.) | ‐1.7 ± 1.0 (median = ‐1.8) | 2.9 ± 3.0 (median = 2.0) | < 0.001 |
BSA = body surface area; bpm = beats per minute.
MRI Acquisition
All images were acquired on a 3T system (Tim Trio, Siemens, Erlangen, Germany). To reliably measure the ARD, cine images with retrospective ECG‐gating and breath‐hold were acquired in the left ventricular outflow track (LVOT) view.13 The imaging sequence was balanced steady‐state free‐precession (SSFP): repetition time (TR) = 16.1 msec, echo time (TE) = 1.57 msec, flip angle = 50°, and spatial resolution = 1.17 × 1.17 × 6 mm3.
Aortic blood flow was measured by using 4D Flow MRI with three‐directional velocity encoding in a sagittal oblique volume covering the entire thoracic aorta. Prospective ECG‐triggering (sampling 90% of the cardiac cycle) and respiratory navigator‐echo gating were used to synchronize cardiac and breathing motions, respectively. The scanning parameters were: TR = 10 msec, TE = 2.7 msec, flip angle = 7°, temporal resolution = 40 msec, spatial resolution = (1.36–1.44) × (1.36–1.44) × 3.5 mm3, 32–40 slices/slab, acceleration factor = 5, and velocity sensitivity encoding (VENC) = 1.5 m/s in three directions. No contrast agent was administered. The total 4D Flow MRI scanning time was ∼15 minutes.
Data Processing
The ARD was determined manually at the end‐systolic phase at the midpoint between the sinotubular junction and the sinus of Valsalva in LVOT view (see Supplementary Information Fig. S1). The Z score, describing the aortic diameter with minimal relation of residuals to age, gender, and BSA, was calculated according to the regression model proposed by Devereux et al.14
The acquired 4D Flow MRI datasets were corrected for eddy currents, Maxwell terms, and velocity aliasing, as described previously.15, 16 The 3D blood flow visualization was achieved by reconstructing a 3D PC MR angiogram from 4D Flow MRI data by using commercial software (EnSight 9.2, CEI, Apex, NC). This program enables the placement of different cut‐planes in the areas of interest along the aorta, allowing subsequent quantification of hemodynamic flow data for each plane. Ten 2D planes were placed manually according to the landmarks listed in Table 2 on the 3D MRA; the planes were perpendicular to the long axis of the aorta. These locations were determined according to the Stanford and De Bakey classification of aortic dissection.4 We placed 10 planes along the thoracic aorta, including three in the AAo (Planes 1–3, including two planes in the aortic root and one plane in the middle AAo), three in the aortic arch (AA: Planes 4–6), and four in the descending aorta (DAo: Planes 7–10). The cross‐sectional area of each plane was segmented manually with an in‐house analysis tool programmed with MatLab (MathWorks, Natick, MA).
Table 2.
Positions of 10 Transaxial Planes Along the Aorta
| Plane | Position |
|---|---|
| 1 | Sinus of Valsalva |
| 2 | Sinotubular junction |
| 3 | Middle of Planes 2 and 4 |
| 4 | Proximal aortic arch |
| 5 | Middle of innominate artery and left common carotid artery |
| 6 | Middle of left common carotid artery and left subclavian artery |
| 7 | 2 cm distal to left subclavian artery |
| 8 | Middle of Planes 7 and 9 |
| 9 | At the level of diaphragm |
| 10 | 2 cm distal to diaphragm |
In this study we calculated several hemodynamic indices to describe the aortic flow in MFS patients. The vorticity was an index describing the vortex flow and was calculated using the curl of velocity 17:
| (1) |
where r and t denote the space and time coordinates of the velocity field, respectively.
An index of relative helicity was estimated from the angle between the velocity and vorticity vectors:
| (2) |
where Ø is the angle between the velocity and vorticity vector.18 Angle Ø ranged from 0° to 180°, resulting in relative helicity values that were between +1 (maximum clockwise rotation when viewed in the direction of the flow) and –1 (maximum counterclockwise rotation). We report the mean relative helicity averaged over the cardiac cycle.
The WSS vector was evaluated by an analysis tool developed in a previous study19 and was defined as:
| (3) |
where η represented blood viscosity, is the inward unit normal, and is the deformation tensor. The WSS vector could be divided into axial (WSSaxial) and circumferential (WSScirc) components. As described in a previous study,19 if a 1D problem was considered, was simplified to:
| (4) |
where h is the height of the boundary. In this study we report WSS values averaged over the cardiac cycle to compare the different WSS values between MFS and normal groups.
To evaluate temporal oscillations in the WSS, the OSI, the WSS deviated from its averaged direction during one cardiac cycle, was defined as:
| (5) |
where T is the duration of the cardiac cycle. The innermost curvature was determined as the reference point and the circumference of each vessel plane was divided equally into 12 segments along the lumen circumference, starting at the reference point, as described in the previous study.19 Subsequently, the segmental WSS and OSI could be calculated.19
The nonroundness (NR), describing the asymmetry of the 12 segmental WSS values of each plane, was defined as:
| (6) |
where τ represents the WSS, and N = 12.
Statistical Analysis
A Student's t‐test was performed to compare the differences between two groups. The correlations between quantified flow‐related indices and BSA, ARD, or Z score were evaluated by Pearson's correlation analysis for MFS patients and normal subjects with age >18 years. P < 0.05 indicated statistical significance.
Results
As listed in Table 1, the MFS group had a significantly increased ARD (3.9 ± 0.9 cm vs. 2.5 ± 0.4 cm, P < 0.001) and higher Z scores (2.9 ± 3.0 vs. –1.7 ± 1.0, P < 0.001), indicating that the patients had substantially dilated aortic roots.
Hemodynamic Indices of the Aortic Flow
The MFS group had a substantially reduced flow velocity during systole compared with the normal group in Plane 2 (Fig. 1). The MFS group generally had a smaller vorticity compared with the normal group (Fig. 2a), particularly in the sinotubular junction (Plane 2) (0.24 ± 0.06 s−1 vs. 0.31 ± 0.06 s−1, P < 0.01). In addition, normal subjects typically had a counterclockwise flow (helicity <0) in the AAo and DAo, but presented a clockwise flow (helicity >0) in the AA (Fig. 2b). In MFS patients, however, approximately zero relative helicity was found in the aortic root. Significant differences between the MFS and normal groups were particularly evident in Plane 1 (0.0005 ± 0.05 vs. –0.04 ± 0.04, P < 0.05) and Plane 2 (0.001 ± 0.06 vs. –0.05 ± 0.06, P < 0.05).
Figure 1.
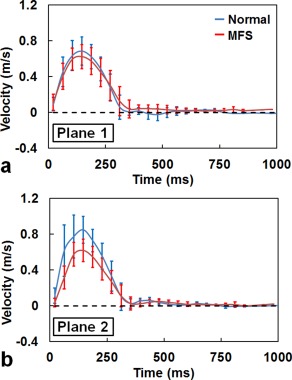
Time courses of the mean blood flow velocity of MFS (red) and normal (blue) groups in Planes 1 (a) and 2 (b).
Figure 2.
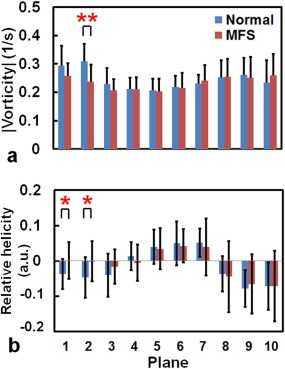
(a) Vorticity and (b) relative helicity in 10 planes along the aorta of normal subjects (blue bar) and MFS patients (red bar). *P < 0.05, **P < 0.01.
WSS and OSI
In general, MFS patients had lower WSS values compared with normal subjects, particularly in the AAo (Fig. 3a) and AA (Fig. 3b). For the WSSaxial, MFS patients exhibited significantly lower values in Plane 1 (0.24 ± 0.08 N/m2 vs. 0.31 ± 0.12 N/m2, P < 0.05) and Plane 2 (0.19 ± 0.08 N/m2 vs. 0.32 ± 0.11 N/m2, P < 0.001). For the WSScirc, the MFS group had significantly lower values in the AA compared with the normal group, particularly in Planes 4 and 5 (both P < 0.01). This tendency was also noted in Plane 6 (P < 0.05).
Figure 3.
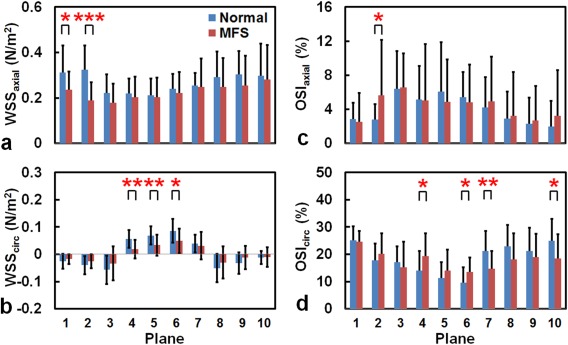
The WSS (a,b) and OSI (c,d) in 10 planes along the aorta of normal subjects (blue) and MFS patients (red). *P < 0.05, **P < 0.01, ***P < 0.001.
Compared with the normal group, the MFS group exhibited heterogeneous changes in the OSI values, depending on the OSI direction and plane positions. The OSIaxial values in Plane 2 were higher in MFS patients (5.6% ± 6.5% vs. 2.8% ± 1.8%, P < 0.05) (Fig. 3c). The MFS group had a significant increase in the OSIcirc values in the AA (Planes 4 and 6, both P < 0.05), but lower values in the DAo (Plane 7: 14.7% ± 6.6% vs. 21.2% ± 7.3%, P < 0.01; Plane 10: 18.4% ± 9.0% vs. 25.0% ± 7.9%, P < 0.05) (Fig. 3d).
Regional Analysis of the WSS
We used spider charts to display the regional distribution of the WSS values in 12 segments along the circumference of the aortic wall in each plane. Figure 4a illustrates the WSSaxial results of two groups. The MFS patients generally had lower segmental WSSaxial values compared with the normal subjects, particularly in Plane 2 in the aortic root. In the visualization of the spider charts for the normal group, the distribution of the segmental WSSaxial values formed an ellipse, with the long axis extended in the direction parallel to the Segments 5–11 direction in the AAo. The direction of the long axis rotated gradually to the Segments 3–9 direction in the DAo. By contrast, the spider charts of the MFS patients presented as relatively symmetric circles in Planes 2–4, as reflected in their smaller NR values.
Figure 4.
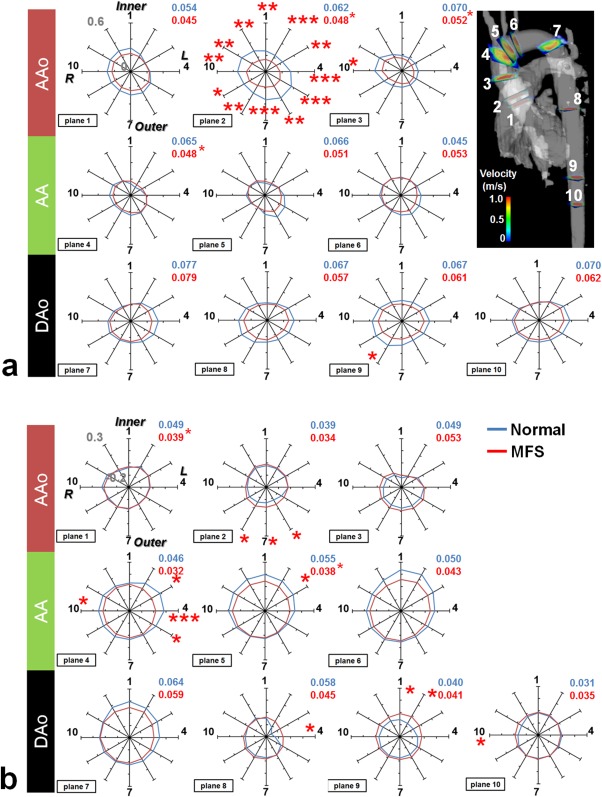
Comparison of segmental (a) WSSaxial and (b) WSScirc for MFS patients (red line) and normal subjects (blue line). The numbers in the upper‐right corner of each plot indicate the NR values, detailing the asymmetry of the WSS in the spider charts. Inner and Outer indicate the inner and outer curvatures of the aorta, respectively; R and L represent the right and left orientations of the aorta. *P < 0.05, **P < 0.01, ***P < 0.001.
Figure 4b illustrates lower segmental WSScirc values in MFS patients compared with those of normal subjects, particularly in the left segments of Planes 4 and 5 in the AA. Moreover, in the aortic root MFS patients had lower segmental WSScirc values in the outer segments of Plane 2. Because the segmental WSScirc values of a single plane were similar, both the MFS and normal groups exhibited symmetrically circular spider charts for the WSScirc.
The NR values indicate the asymmetry of the WSS distribution along the circumference of the aortic wall of each plane, and the values are shown in the upper‐right corner of each spider chart for the normal group (blue) and MFS groups (red) in Fig. 4. The MFS group had lower NRaxial values in Planes 2–4 (all P < 0.05) and lower NRcirc values in Planes 1 and 5 (both P < 0.05).
Correlation Analysis
In the MFS group there was a moderate correlation between vorticity and BSA in Plane 2 (R2 = 0.41, P = 0.007). No correlation was found between helicity and BSA, ARD, or Z score. Figure 5 illustrates that the WSSaxial and BSA exhibited strong correlations in Plane 1 (R2 = 0.72, P < 0.001) and Plane 2 (R2 = 0.59, P = 0.001) in the MFS group. The WSSaxial also displayed moderate correlation with ARD in Plane 1 in the MFS (R2 = 0.50, P = 0.002) and normal (R2 = 0.57, P = 0.005) groups. As shown in Fig. 6, the WSScirc in Plane 6 in both of MFS and normal groups showed moderate correlations with ARD (MFS: R2 = 0.53, P = 0.001; Normal: R2 = 0.42, P = 0.022) and with Z score (MFS: R2 = 0.58, P = 0.001; Normal: R2 = 0.54, P = 0.007).
Figure 5.
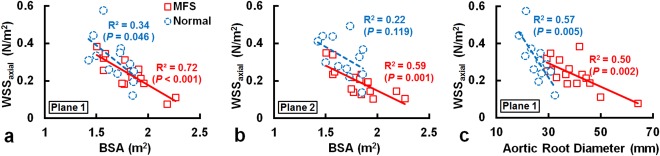
The WSSaxial and BSA exhibited strong correlations in Planes 1 (a) and 2 (b) in MFS group. The WSSaxial also displayed moderate correlation with ARD in Plane 1 in the MFS and normal groups (c).
Figure 6.
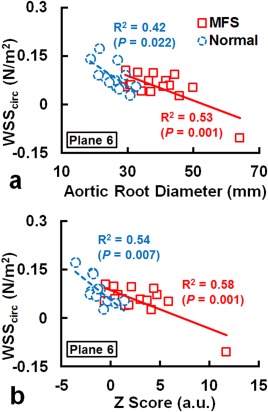
The WSScirc displayed moderate correlations with ARD (a) and with Z score (b) in Plane 6 in the MFS and normal groups.
Discussion
This study made a systematic survey of vorticity, relative helicity, the WSS and its regional distribution along the circumference of the aortic wall, and the OSI of the aortic flow in MFS patients with aortic root dilatation. Several quantified indices were found to indicate altered aortic flow in patients with MFS. In addition, the WSSaxial and WSScirc exhibited correlations with BSA, ARD, or Z score in the MFS and normal groups.
Geiger et al investigated hemodynamic indices in asymptomatic MFS patients, 18 ± 12 (median = 15) years, who did not present with endoplasmic reticulum aortic aneurysm, dissections, or aortic valve insufficiency.10, 11 They reported similar velocity–time curves in the MFS and normal groups, except for a mild reduction of peak systolic velocity in the AAo in patients. Our patients were somewhat older and had aortic root dilatation. Substantially reduced velocity during systole in Plane 2 was observed. Note that Plane 2 corresponds to the sinotubular junction where aortic dissection is encountered frequently, as reported in one previous study.4 These results demonstrated that the altered systolic velocity in patients might be associated with the changes in the aortic characteristics, possibly reflecting the disease progression in MFS.
By assessing the vortex strengths using a grading method, Geiger et al reported that patients exhibited a more common local vortex in the DAo.10 Geiger et al also identified an association between the increased sinus diameter and the development of the vortex flow in the DAo in the 2‐year follow‐up examinations. This finding highlights the demand of establishing a quantitative index for longitudinal follow‐up. In this study we calculated plane‐wise vorticity and relative helicity values in order to provide quantitative indices for evaluating the altered flow in the follow‐up examinations. Substantially reduced vorticity values were observed in the sinotubular junction. The moderate correlation between vorticity and BSA in the MFS group further implied that the older MFS patients, who had larger BSA (possibly related to larger ARD), could exhibit a more obvious abnormal flow pattern and reduced vorticity in the dilated aortic root. Compared with the normal group, MFS patients exhibited lower relative helicity values (close to zero) in the AAo, which reflects the altered helical flow in the AAo. Thus, the evaluation of vorticity and relative helicity enables an objective assessment for flow analysis. Consequently, performing a follow‐up on the vorticity and relative helicity for patients with MFS can further depict the changes in flow by which we might monitor the development of various types of aortopathy, such as aortic dissection.
Previous studies have indicated that shear stress induced by laminar blood flow plays an essential role in standard vascular functioning, which includes regulating the vascular caliber as well as inhibiting the proliferation, thrombosis, and inflammation of the vessel wall.20, 21, 22, 23, 24 Butler et al report that a disturbed blood flow and associated low shear stress may upregulate the expression of genes and proteins involved in vessel remodeling.25 Therefore, the reduced WSS observed in the current work might involve in the alteration of gene expression, potentially reflecting the changes of vascular characteristics in the aorta.
Geiger et al previously reported similar absolute WSS time courses in the AAo of younger asymptomatic patients compared with normal subjects, and a higher peak systolic WSS at specific segments in the AAo.11 However, our study found inconsistent changes of WSS in the older MFS group. The decreased segmental WSSaxial values were found at all segments in Plane 2 in the MFS group. For the WSScirc, lower values were observed in the outer segments in Plane 2 and in the left segments (Segments 3 to 5) in Plane 4. The inconsistency might imply that the progression of the aortic wall may lead to different degrees of disturbed flow and WSS values in specific segments. In an initial state, younger MFS patients might exhibit larger WSS values in certain segments in the AAo, as reported by Geiger et al.11 As they grow up, the disease may progress with age. Therefore, more disturbed flow, lower velocity gradient, and WSS values may emerge in the older patient group, as reported in the current work.
Noticeably, Geiger et al previously reported generally lower OSI either in AAo, AA, or DAo in a younger asymptomatic MFS group.11 However, our results were opposite to those reported by Geiger et al. As compared with normal subjects, our recruited older patients showed higher OSIaxial and OSIcirc in the AAo and AA, indicating an increased temporal oscillation of the WSS. By contrast, lower OSIcirc was found in the DAo of MFS patients, indicating fewer temporal variations in the WSScirc. We speculate that the discrepancy of the altered OSI is owing to the different stages of aortopathy as disease progresses, resulting in the different temporal variation of segmental WSScirc in the MFS group.
The inferences stated above are supported by the data found by Hope et al, who reported lower estimated WSS in the MFS patient with aortic dissection.26 Furthermore, the current study demonstrated strong to moderate correlations between WSSaxial or WSScirc and BSA, ARD, or Z score in MFS group, illustrating that the changes of WSS may be associated with disease progress. The possible time dependency of hemodynamic alterations in MFS patients suggests the need for longitudinal follow‐up using 4D Flow MRI.
The causal relationship between WSS alterations and aortic dissection remains unclear. Previous cell studies showed that shear stress induced by laminar blood flow plays an essential role in standard vascular functioning.22, 23 Therefore, WSS alterations may lead to abnormal cellular expression and diseased vascular wall. On the other hand, the diseased vascular wall can result in altered flow velocity and WSS. In such situations a reduction in WSS could be an outcome of genetic influences at the cellular level. Either case suggests that WSS changes in MFS patients are likely a dynamic process that should ideally be monitored by longitudinal imaging examinations.
In this study we observed a rotating pattern of the long axis of segmental WSSaxial in the spider chart of the normal group. The absence of this rotating pattern in the MFS group may imply that the symmetric distribution of segmental WSS values along the circumference of aorta can be viewed as a sign of the development of altered flow patterns. On the other hand, patients with MFS demonstrated a significant decreased NR, particularly in Planes 2–4 for NRaxial and in Planes 1 and 5 for NRcirc, indicating that an altered NR index can reveal abnormalities in MFS patients. Geiger et al previously also investigated the eccentricity of the segmental WSS,11 which is similar to the NR index in our study. However, they reported increased eccentricity in the MFS group. The inconsistency regarding the skewness of segmental WSS is likely associated with the more obvious altered flow due to substantial dilated aortic root in our recruited older patients. A systematic investigation of WSS, OSI, NR, and the rotating pattern of long‐axis of segmental WSS distribution in a long‐term follow‐up fashion is needed to comprehend the interaction between the altered flow and vascular characteristics.
This study has four main limitations. First, the use of prospective ECG triggering in the 4D Flow MRI sequence results in different lengths of acquisition windows in subjects with different heart rates, thus obtaining different numbers of cardiac frames for each participant. The acquisition window is typically set to 90% of the R‐to‐R interval, leaving the late diastolic phase unmeasured. The above‐mentioned factors may lead to variation for evaluating temporal averaged indices, eg, vorticity, relative helicity, WSS, and so on. Second, the intra‐/interobserver variability of estimating WSS was not performed in this study. Nevertheless, a previous study has shown good test–retest reliability on observer variability of WSS and OSI.27 Therefore, the quantified WSS were reliable to present the abnormality of aortic wall in patients with MFS. On the other hand, it is important for validating the interstudy variability of the established indices, especially for the potential usage in longitudinal follow‐ups. In future work, the interstudy variability will be conducted in the normal group. Third, prescribing the 2D planes along the aorta is subject to intra‐/interobserver variability, even though distinct anatomic landmarks have been defined for the 2D planes. Analysis of intra‐/interobserver variability will be conducted to determine the discrepancies that occur because of the 2D plane locations. Finally, the flow velocity near vascular wall is close to zero and is much lower than the VENC (=1.5 m/s in the current study). The noise of the estimating velocity can introduce inaccuracy in calculating WSS. As mentioned by Stalder et al,19 the velocity measurement error can be estimated for different VENC and the signal‐to noise ratio (SNR) of the magnitude image. In our study, the error% of WSS can be estimated as 1% and is acceptable in the current study. Nevertheless, spatial resolution can also impact SNR and the estimated errors. A more systematic investigation can be performed to investigate the velocity errors with different VENC and SNR.
In this study we demonstrated altered hemodynamic indices, WSS/segmental WSS, and OSI in patients with MFS. The results revealed statistically significant differences in the analysis indices in several aortic planes of MFS patients. The regional distributions of the WSSaxial and WSScirc as well as the quantified NR indices for the WSS distribution could together reflect chaotic flows at specific sites of the aorta, which may indicate abnormal vascular characteristics in the aorta. The WSSaxial and WSScirc exhibited moderate to strong correlations with BSA, ARD, or Z score in MFS patients, suggesting that the quantified indices were associated with the demographic changes because of disease progress.
In conclusion, 4D Flow MRI could be useful in understanding disease progress in patients with MFS. Based on our results, longitudinal follow‐up using 4D Flow MRI is potentially useful for thoroughly understanding the disease progress in MFS patients.
Supporting information
This article includes Supplementary Material available via the Internet at http://www.interscience.wiley.com/jpages/xxxx-xxxx/suppmat
Supporting Information
Acknowledgment
The authors thank Aurelien Stalder for assistance in developing the analysis tool.
Parts of the work were presented in part at the 21st and 22nd Annual Meetings of the International Society for Magnetic Resonance in Medicine.
References
- 1. Keane MG, Pyeritz RE. Medical management of Marfan syndrome. Circulation 2008;117:2802–2813. [DOI] [PubMed] [Google Scholar]
- 2. Pyeritz RE, McKusick VA. The Marfan syndrome: diagnosis and management. N Engl J Med 1979;300:772–777. [DOI] [PubMed] [Google Scholar]
- 3. Kainulainen K, Pulkkinen L, Savolainen A, Kaitila I, Peltonen L. Location on chromosome 15 of the gene defect causing Marfan syndrome. N Engl J Med 1990;323:935–939. [DOI] [PubMed] [Google Scholar]
- 4. Dormand H, Mohiaddin RH. Cardiovascular magnetic resonance in Marfan syndrome. J Cardiovasc Magn Reson 2013;15:33. [DOI] [PMC free article] [PubMed] [Google Scholar]
- 5. Faivre L, Collod‐Beroud G, Child A, et al. Contribution of molecular analyses in diagnosing Marfan syndrome and type I fibrillinopathies: an international study of 1009 probands. J Med Genet 2008;45:384–390. [DOI] [PubMed] [Google Scholar]
- 6. Gautier M, Detaint D, Fermanian C, et al. Nomograms for aortic root diameters in children using two‐dimensional echocardiography. Am J Cardiol 2010;105:888–894. [DOI] [PubMed] [Google Scholar]
- 7. Kornbluth M, Schnittger I, Eyngorina I, Gasner C, Liang DH. Clinical outcome in the Marfan syndrome with ascending aortic dilatation followed annually by echocardiography. Am J Cardiol 1999;84:753–755, A759. [DOI] [PubMed] [Google Scholar]
- 8. Dyverfeldt P, Bissell M, Barker AJ, et al. 4D flow cardiovascular magnetic resonance consensus statement. J Cardiovasc Magn Reson 2015;17:72. [DOI] [PMC free article] [PubMed] [Google Scholar]
- 9. Groenink M, de Roos A, Mulder BJ, et al. Biophysical properties of the normal‐sized aorta in patients with Marfan syndrome: evaluation with MR flow mapping. Radiology 2001;219:535–540. [DOI] [PubMed] [Google Scholar]
- 10. Geiger J, Markl M, Herzer L, et al. Aortic flow patterns in patients with Marfan syndrome assessed by flow‐sensitive four‐dimensional MRI. J Magn Reson Imaging JMRI 2012;35:594–600. [DOI] [PubMed] [Google Scholar]
- 11. Geiger J, Arnold R, Herzer L, et al. Aortic wall shear stress in Marfan syndrome. Magn Reson Med 2013;70:1137–1144. [DOI] [PubMed] [Google Scholar]
- 12. Du Bois D, Du Bois EF. A formula to estimate the approximate surface area if height and weight be known. 1916. Nutrition (Burbank, CA) 1989;5:303–311; discussion 312–313. [PubMed] [Google Scholar]
- 13. Burman ED, Keegan J, Kilner PJ. Aortic root measurement by cardiovascular magnetic resonance: specification of planes and lines of measurement and corresponding normal values. Circ Cardiovasc Imaging 2008;1:104–113. [DOI] [PubMed] [Google Scholar]
- 14. Devereux RB, de Simone G, Arnett DK, et al. Normal limits in relation to age, body size and gender of two‐dimensional echocardiographic aortic root dimensions in persons >/=15 years of age. Am J Cardiol 2012;110:1189–1194. [DOI] [PMC free article] [PubMed] [Google Scholar]
- 15. Bock J, Frydrychowicz A, Stalder AF, et al. 4D phase contrast MRI at 3 T: effect of standard and blood‐pool contrast agents on SNR, PC‐MRA, and blood flow visualization. Magn Reson Med 2010;63:330–338. [DOI] [PubMed] [Google Scholar]
- 16. Walker PG, Cranney GB, Scheidegger MB, Waseleski G, Pohost GM, Yoganathan AP. Semiautomated method for noise reduction and background phase error correction in MR phase velocity data. J Magn Reson Imaging JMRI 1993;3:521–530. [DOI] [PubMed] [Google Scholar]
- 17. Schnell S, Ansari SA, Vakil P, et al. Three‐dimensional hemodynamics in intracranial aneurysms: influence of size and morphology. J Magn Reson Imaging JMRI 2014;39:120–131. [DOI] [PMC free article] [PubMed] [Google Scholar]
- 18. Lorenz R, Bock J, Barker AJ, et al. 4D flow magnetic resonance imaging in bicuspid aortic valve disease demonstrates altered distribution of aortic blood flow helicity. Magn Reson Med 2014;71:1542–1553. [DOI] [PMC free article] [PubMed] [Google Scholar]
- 19. Stalder AF, Russe MF, Frydrychowicz A, Bock J, Hennig J, Markl M. Quantitative 2D and 3D phase contrast MRI: optimized analysis of blood flow and vessel wall parameters. Magn Reson Med 2008;60:1218–1231. [DOI] [PubMed] [Google Scholar]
- 20. Zarins CK, Giddens DP, Bharadvaj BK, Sottiurai VS, Mabon RF, Glagov S. Carotid bifurcation atherosclerosis. Quantitative correlation of plaque localization with flow velocity profiles and wall shear stress. Circ Res 1983;53:502–514. [DOI] [PubMed] [Google Scholar]
- 21. Chien S. Mechanotransduction and endothelial cell homeostasis: the wisdom of the cell. Am J Physiol Heart Circ Physiol 2007;292:H1209–1224. [DOI] [PubMed] [Google Scholar]
- 22. Chiu JJ, Usami S, Chien S. Vascular endothelial responses to altered shear stress: pathologic implications for atherosclerosis. Ann Med 2009;41:19–28. [DOI] [PubMed] [Google Scholar]
- 23. Cunningham KS, Gotlieb AI. The role of shear stress in the pathogenesis of atherosclerosis. Lab Invest 2005;85:9–23. [DOI] [PubMed] [Google Scholar]
- 24. Efstathopoulos EP, Patatoukas G, Pantos I, Benekos O, Katritsis D, Kelekis NL. Wall shear stress calculation in ascending aorta using phase contrast magnetic resonance imaging. Investigating effective ways to calculate it in clinical practice. Phys Med 2008;24:175–181. [DOI] [PubMed] [Google Scholar]
- 25. Butler PJ, Weinbaum S, Chien S, Lemons DE. Endothelium‐dependent, shear‐induced vasodilation is rate‐sensitive. Microcirculation (New York) 2000;7:53–65. [PubMed] [Google Scholar]
- 26. Hope TA, Kvitting JP, Hope MD, Miller DC, Markl M, Herfkens RJ. Evaluation of Marfan patients status post valve‐sparing aortic root replacement with 4D flow. Magn Reson Imaging 2013;31:1479–1484. [DOI] [PubMed] [Google Scholar]
- 27. Markl M, Wallis W, Harloff A. Reproducibility of flow and wall shear stress analysis using flow‐sensitive four‐dimensional MRI. J Magn Reson Imaging JMRI 2011;33:988–994. [DOI] [PubMed] [Google Scholar]
Associated Data
This section collects any data citations, data availability statements, or supplementary materials included in this article.
Supplementary Materials
This article includes Supplementary Material available via the Internet at http://www.interscience.wiley.com/jpages/xxxx-xxxx/suppmat
Supporting Information