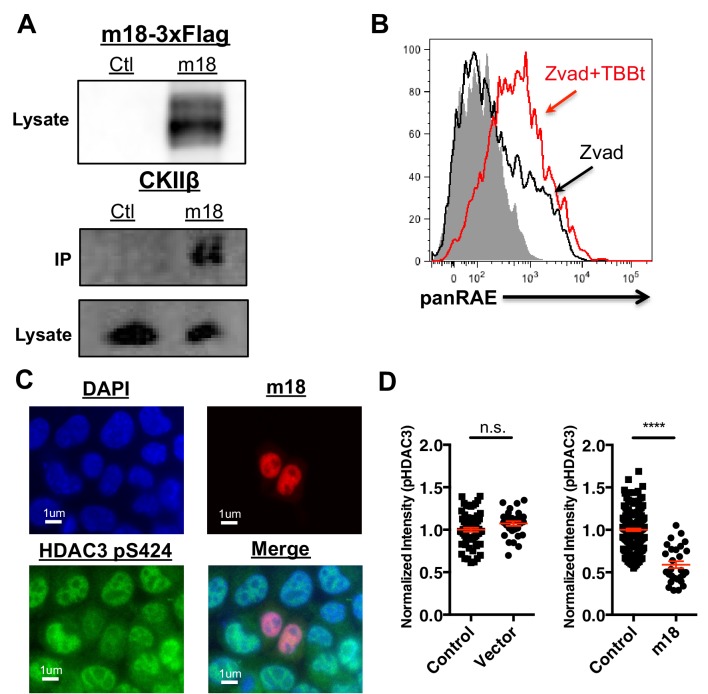
Figure 6. CK2 directly interacts with m18 and represses HDAC function.
(A) Immunoprecipitation (IP) of m18 was performed in lysates of cells expressing m18-3xFlag or empty 3xFlag vector, and the products were analyzed for FLAG and CK2β by western blot. Data are representative of three independent experiments. (B) Mouse fibroblasts were treated with CK2 inhibitor TBBt in conjunction with zVAD or zVAD alone and analyzed for RAE-1 expression by flow cytometry. Data is representative of three independent experiments. (C) Representative image of fibroblasts expressing m18-RFP and stained for HDAC3 pS424. (D) Quantification of HDAC3 pS424 levels in cells expressing m18-RFP or RFP control vector from compared to non-transfected controls in same field of view. Red bars are representative of mean±SEM. Data are representative of three independent experiments. ****p<0.00005. n.s., not significant. (Student’s T-test).


