Abstract
Background
The aim of this study was to investigate the potential contribution of acoustic radiation force impulse (ARFI) elastography to the determination of the severity of benign prostate hypertrophy (BPH) by performing shear wave velocity (SWV) measurements of the prostate using ARFI technology.
Material/Methods
Sixty BPH patients and 40 healthy volunteers were included in this study. SWV measurements of the prostate were performed by transabdominal ultrasonography (US), both in the BPH patients and control subjects. The BPH patients also underwent uroflowmetry measurements. Using the International Prostate Symptom Score (IPSS), the BPH patients were divided into two subgroups, a mild-to-moderate BPH group and a severe BPH group, to compare SWV values.
Results
The BPH patients had higher SWV values for the central area of the prostate compared to the control subjects (2.52±0.59 m/s and 1.47±0.42 m/s, p<0.01). The SWV values of the central area of prostate were higher in the severe BPH group compared to the mild-to-moderate BPH group (2.62±0.58 and 2.25±0.55, p=0.02).
Conclusions
Our ARFI elastography results indicated that the central prostate SWV values of BPH patients were significantly higher relative to those of a healthy control group. The central prostate SWV values increased in proportion to the increased severity of BPH. Measurement of SWV by ARFI technology constitutes a non-invasive alternative to other methods for the determination of BPH severity.
MeSH Keywords: Elasticity Imaging Techniques, Prostatic Hyperplasia, Ultrasonography
Background
Benign prostate hyperplasia (BPH), which is accompanied by lower urinary tract symptoms (LUTS) such as voiding (feeling of incomplete emptying and straining) and storage (nocturia and urgency), is quite common among middle- and advanced-aged men [1]. Considering the fact that prostate volume increases with age, BPH and moderate-to-severe LUTS exhibit an increasing incidence, especially in developed countries, which enjoy increased life expectancies [2]. A diagnosis of BPH is particularly important because of its impact on the patient’s quality of life. For example, BPH might cause significant LUTS even without manifesting identifiably increased prostate volume. Despite the fact that prostate volume does not correlate directly with the severity of symptoms, an enlarged prostate might increase the chance of progression of both LUTS and BPH [3]. The prevalence of BPH is quite high among men; however, men with BPH do not experience the same level of risk for progression [4,5]. There are studies in the literature that demonstrate that anatomical factors related to the prostate, such as transitional zone volume (TZV), transitional zone index (TZI), intravesical prostatic protrusion (IPP), and presumed circle area ratio (PCAR), are more influential on progression than total prostate volume in urodynamically obstructed patients [6–8].
Histology-visible irregular proliferation of smooth muscles, connective tissues, and glandular epithelial cells in the transitional zone of the prostate causes increased prostate stiffness in BPH [9]. Therefore, the fact that the clinical progression does not solely depend on total prostate volume, and that various histologic components are involved in the development of BPH, might justify the use of elastography to reveal changes in tissue stiffness [10,11]. In this respect, acoustic radiation force impulse (ARFI) elastography can be considered a non-invasive and cost-effective elasticity imaging technology quantifying the shear wave velocity (SWV) of tissues [12,13]. Many organs, including the liver, breast, thyroid, and kidney, can be examined with ARFI elastography to reveal their elasticity properties. There are a few recent studies in the literature investigating the contribution of ARFI elastography to the establishment of diagnoses of BPH and prostate cancer [14–17]. An enlarged prostate (prostate volume >20 mL), a maximum urinary flow rate (Qmax) <10 mL, and an International Prostate Symptom Score (IPSS) >7 are accepted as important criteria for the diagnosis of BPH and the determination of its clinical progression [18].
The present study aimed to evaluate the difference in SWV between a BPH group and a group without BPH, to analyze the relationship between the severity of BPH assessed by the IPSS and ARFI elastography with SWV measurements.
Material and Methods
Patient selection
This prospective study included a total of 105 consecutive male patients who were admitted to the urology clinic between August 2014 and May 2015. The BPH group consisted of 60 patients. Forty-five patients were excluded from the study. Forty healthy volunteers exhibiting no BPH and no evidence of urinary system pathology were enrolled in the study to constitute the control group. In addition, the BPH group was divided into two subgroups, based on their IPSS results: a mild-to-moderate BPH group (IPSS range: 1–19) and a severe BPH group (IPSS range: 20–35). The study was undertaken after receiving Ethics Committee approval. Both the patients and the control group participants signed an informed consent form prior to the study. The exclusion criteria included the following: a prostatic depth more than 8 cm from the skin, uncontrolled diabetes mellitus, neurologic diseases that could affect the voiding function, bladder and prostate cancers, history of lower urinary tract surgery and urinary tract infection, and a measured voided volume <125 mL.
IPSS and uroflowmetry
The urinary symptoms of the patients were evaluated using the IPSS. The total IPSS score was calculated by adding the two sub-scores together, namely the voiding and storage symptoms sub-scores [19]. The IPSS asks the patient to score seven symptoms on a scale ranging from 1 to 5, considering the last 30 days of their lives. The IPSS also includes one question that assesses the encumbering nature of the patient’s symptoms. The answer given to this particular question informs the decision to begin therapy. Symptoms can have a maximum score of 5, which makes the highest possible score 35. A score of 0 indicates the absence of symptoms of BPH. A score of 1–7 is regarded as mildly symptomatic, 8–19 as moderately symptomatic, and 20–35 as severely symptomatic. The question about the encumbering nature of the symptoms is scored separately, on a scale ranging from 0 to 6 [20].
Uroflowmetry measurements, including Qmax and average urinary flow rate (Qave), were performed in a standing position using Bluetooth uroflowmetry (urodyn+, MMS, Flowmaster, NL). Post-void residual (PVR) urine volumes were measured in supine position. A measured voided volume < 125 mL was excluded from the study. PVR measurements were performed by means of a bladder scanner (LOGIQ C3, Premium, GE, China).
ARFI elastography
All ultrasound (US) examinations were performed using the Acuson S2000 ultrasound system (Siemens Solutions, Mountain View, CA, USA) with the convex probe (4 C1, frequency range: 1–4 MHz). ARFI measurements (Virtual Touch™ Tissue Quantification package) were performed by the same radiologist (B.A.), who had 15 years of abdominal US experience and two years of elastography experience, and was blind to the patients’ clinical data. First, prostate volume was obtained by means of B-mode US. The prostate volume was calculated using the following formula: π/6×(transverse diameter × anteroposterior diameter × cephalocaudal diameter) [21].
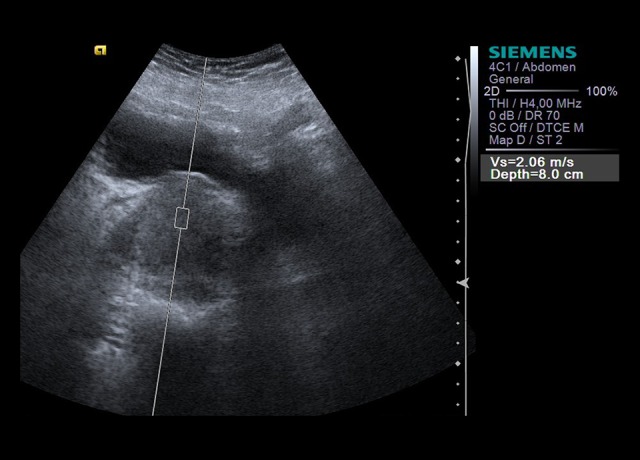
Shear wave velocity (SWV) was recorded from a 10×6 mm rectangular region of interest (ROI). Then, a total of ten valid SWV measurements were taken for each of the five central and five peripheral areas. The ROI is placed in the peripheral area and central area of the prostate gland. Measurements were made of non-calcified areas. In cases of invalid measurement (expressed as X.XX m/s), the measurement was repeated. SWV values in meters per second (m/s), which provide numerical measurements and quantitative data on parenchymal elasticity properties, were expressed in mean (±SD) and range (Figure 1).
Figure 1.

Measurement of SWV in the central area of the prostate.
Statistical analysis
SPSS 16.0 (Statistical Package for the Social Sciences version 16.0 for Windows, SPSS Inc., Chicago, IL, USA) was used for the statistical analysis. The Kolmogorov-Smirnov test was used for the distribution of data. Data were expressed as mean ± standard deviation. For the evaluation of the continuous variables, we used Student’s t-test for parametric data and the Mann-Whitney U test for nonparametric data; the categorical valuables were analyzed with the chi-square test. The relation between the parameters was analyzed with the Spearman and Pearson correlation test. In order to predict the severity of BPH, we calculated the areas under the ROC curves for the prostate shear wave speed. A value of p<0.05 was accepted as significant.
Results
A total of 100 subjects were included in this study, 60 constituting the BPH group and 40 constituting the control group. The BPH group had a mean age of 60.5±6 years (range 50–73 years) while the control group had a mean age of 58.5±4 years (range 50–65 years); there was no significant difference between the two groups (p=0.09). The mean prostate volumes of the BPH and control groups were 66.6±26 mL (range: 21–131) vs. 41.9±6 mL (range 25–48), respectively, which also indicated a significant difference between the two groups (p<0.01).
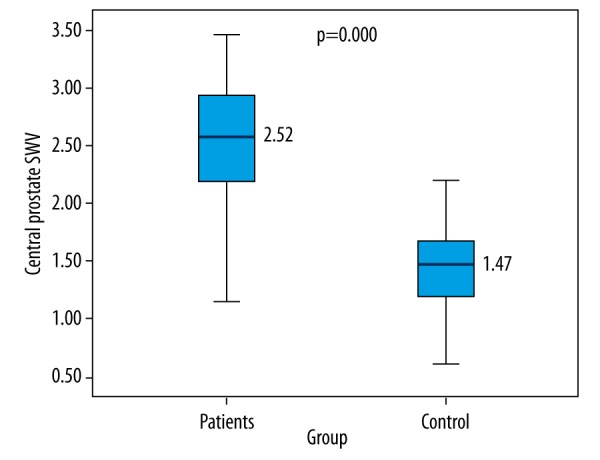
There were significant differences between the BPH and control groups with regards to SWV of the central area [2.52±0.59 (1.15–3.46) m/s vs. 1.47±0.42 (0.61–2.74) m/s, p<0.01] (Figure 2). On the other hand, there was no significant difference between the two groups in SWV of the peripheral area [(1.49±0.44 m/s, range 0.72–2.47) and (1.36±0.37 m/s, range 0.59–2.11), respectively, p=0.1]
Figure 2.

Comparison of SWV levels between BPH patients and control group.
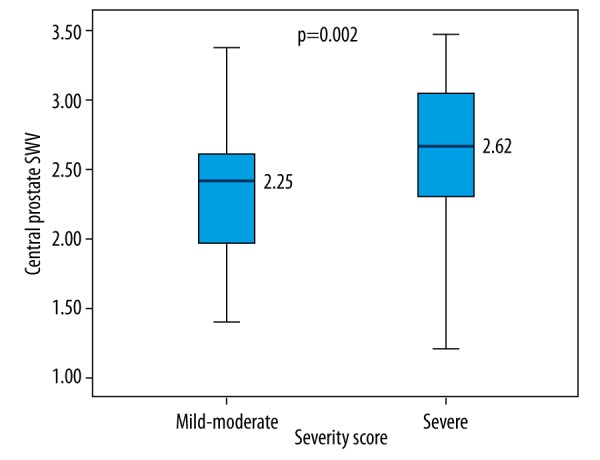
The BPH group, which was divided into two subgroups based on the IPSS results as a mild-to-moderate BPH group (range 1–19) and a severe BPH group (range 20–35), had 19 mild-to-moderate BPH patients and 41 severe BPH patients. There were no significant differences between the two subgroups in terms of age, prostate volume, or SWV of the peripheral area (Table 1). However, there was a significant difference between the two subgroups in SWV of the central area (p=0.02) (Table 1, Figure 3). Furthermore, there was a significant difference between the two subgroups in some of the uroflowmetric parameters, namely Qmax and Qave (Table 1).
Table 1.
Comparison of patients with mild-to-moderate and severe BPH subgroups.
| Mild-to-moderate** BPH (n=19) | Severe BPH* (n=41) | P** | |
|---|---|---|---|
| Age, year | 61±5 (50–73) | 60.4±6 (50–73) | 0.7 |
| Central prostate SWV, m/s | 2.25±0.55 (1.39–3.37) | 2.62±0.58 (1.15–3.46) | 0.02 |
| Periferic prostate SWV, m/s | 1.38±0.40 (0.90–2.47) | 1.53±0.45 (0.72–2.40) | 0.2 |
| Prostate volume, ml | 62.7±30.6 (21–114) | 67.4±26.2 (25–131) | 0.6 |
| IPSS | 15.2±3.8 (7–19) | 27.8±5.1 (20–35) | <0.01 |
| Qave, ml/s | 4.42±2.06 (1–9) | 4.72±5.20 (1–21) | 0.1 |
| Qmax, ml/s | 11.4±4.44 (3–21) | 8.55±5.48 (2–33) | 0.01 |
| Voiding volume, ml | 158.6±92.6 (28–363) | 157.4±157.2 (13–931) | 0.5 |
| Voiding time, s | 40.5±20.5 13–83) | 61.02±34.49 (12–138) | 0.05 |
| PVR, ml | 70.07±40.7 (15–160) | 76.7±65.7 (0–226) | 0.8 |
Values are mean ±SD;
Mann-Whitney U test;
BPH – benign prostate hypertrophy; SWV – shear wave velocity; IPSS – International Prostate Symptom Score; Qave – average urinary flow rate; Qmax – maximum urinary flow rate; PVR – post-void residual.
Figure 3.

Comparison of SWV levels between patients with mild-to-moderate BPH and severe BPH.
A significant positive correlation was observed between the IPSS results and the SWV of the central area (r=0.466, p<0.01). A significant negative correlation was found between the Qmax and SWV of the central area (r=−0.420, p=0.02). In addition, significant negative correlation was found between the voiding time and SWV of the central area (r=−0.357, p=0.01) (Table 2).
Table 2.
Correlation between SWV of the central area and IPSS, voiding time, Maximum urinary flow rate.
| Parameters | r | P* |
|---|---|---|
| IPSS | 0.466 | <0.01 |
| Voiding time | −0.357 | 0.01 |
| Qmax | −0.320 | 0.02 |
Pearson correlation test;
SWV – shear wave velocity; IPSS – International Prostate Symptom Score; Qmax – maximum urinary flow rate.
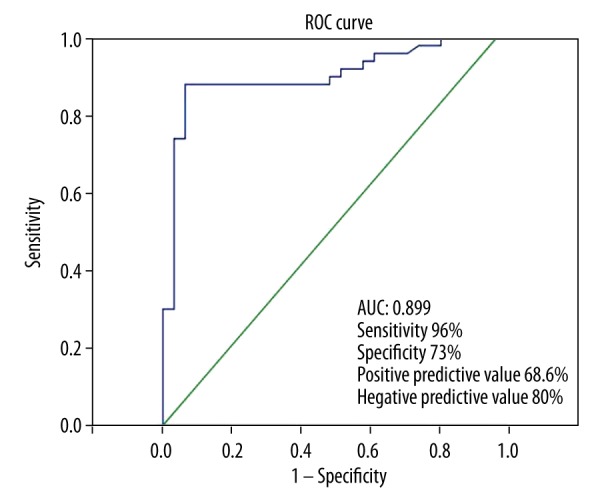
For predicting BPH severity, SWV values of the prostate central area had a sensitivity of 96%, a specificity of 73%, positive predictive value of 68.6%, negative predictive value of 80% (area under the ROC curve, 0.899, for a cutoff value of 1.125 m/s or less) (Figure 4).
Figure 4.

Performance of prostate central area SWV.
Discussion
The cellular proliferation observed in BPH causes increased stromal smooth muscle tonus and prostate volume. First, an increase occurs in BPH nodules in the periurethral zone, followed by enlargement of the glandular nodules [22]. Increased prostate volume, which represents the static component of BPH, and increased stromal smooth muscle tone, which represents the dynamic component of BPH, cause LUTS as well as urinary tract infections, acute urinary retention, renal failure, hematuria and bladder calculi [23]. Increased prostate volume does not have a direct correlation with the severity of LUTS or the stage of bladder outlet obstruction (BOO). In the present study, we aimed to investigate the potential contribution of SWV measurement by ARFI elastography to determining the severity of LUTS in BPH patients by taking ARFI elastography measurements of the prostate and comparing the measured values to the patients’ IPSS and uroflowmetry results.
In this study, BPH patients were compared to healthy volunteers in terms of SWV prostate values. As a result, the SWV of the central area was found to be significantly higher in the BPH patients. However, there was no significant difference between the two groups in the SWV of the peripheral area. Furthermore, the SWV of the peripheral area was lower than that of the central area. Similarly, Zheng et al. [24] performed ARFI imaging of the prostate by transabdominal US and reported a higher SWV value for the inner gland compared to the outer gland of the prostate in BPH patients; also, the SWV values (m/s) were significantly greater in BPH patients than with a normal prostate. Zheng et al. also found a SWV value of 1.98 m/s in the normal group, which is in agreement with our results, but our SWV values for BPH patients were higher than the patient group of Zheng et al.
In the present study, BPH patients were divided into mild-to-moderate and severe BPH groups based on their IPSS results, and severe BPH patients were found to have a higher SWV of the central area than mild-to-moderate BPH patients. In their experimental study involving canines, Fu et al. detected a strong correlation between urodynamic parameters and prostate elasticity [25]. In another study, Zhang et al. reported a strong correlation between the SWV of the transitional area measured by transrectal US and the BOO stage in BPH patients. In addition, they found the elastic modulus of the transitional area to be significantly higher than that of the peripheral area [17].
The present study demonstrates a correlation between the SWV of the central area and the severity of BPH. A significant negative correlation was found between the Qmax, voiding time, and SWV of the central area, but there was no correlation between PVR and SWV of the central area. BPH patients exhibit significant differences in elastic fibers, collagen fibers, and smooth muscle cells. Previous studies reported a higher rate of stromal hyperplasia than epithelial hyperplasia in symptomatic patients [10,26,27]. In this respect, observation of changes in prostate stiffness caused by differences in prostatic tissue components might help determine the severity of BPH. ARFI imaging by transabdominal US, a non-invasive means compared to transrectal US, ensures a more objective assessment of prostate stiffness by providing numerical SWV measurements.
This study had some limitations. First, deeply located prostates could not be examined because the ROI could go no deeper than 8 cm from the skin. Second, the study lacked a detailed zonal evaluation, because the SWV measurements were made by transabdominal US. Third, our hospital is a center for complicated cases; unfortunately, many patients with more complicated cases had to be excluded.
Conclusions
In conclusion, our ARFI elastography results indicated that the central prostate SWV values of BPH patients were significantly higher relative to those of a healthy control group. The central prostate SWV values increased in proportion to the increased the severity of BPH. Measurement of SWV by ARFI technology constitutes a non-invasive alternative to other methods for the determination of BPH severity.
Footnotes
Conflict of interest
The authors declare that they have no competing interests
Source of support: Departmental sources
Statement
There was no outside financial support or other financial or personal relationships in this study.
References
- 1.McVary KT, Roehrborn CG, Avins AL, et al. Update on AUA guideline on the management of benign prostatic hyperplasia. J Urol. 2011;185:1793–803. doi: 10.1016/j.juro.2011.01.074. [DOI] [PubMed] [Google Scholar]
- 2.McVary KT. BPH: Epidemiology and comorbidities. Am J Manag Care. 2006;12:122–28. [PubMed] [Google Scholar]
- 3.Bosch JL, Bangma CH, Groeneveld FP, Bohnen AM. The long-term relationship between a real change in prostate volume and a significant change in lower urinary tract symptom severity in population-based men: The Krimpen study. Eur Urol. 2008;53:819–25. doi: 10.1016/j.eururo.2007.08.042. [DOI] [PubMed] [Google Scholar]
- 4.Anderson JB, Roehrborn CG, Schalken JA, et al. The progression of benign prostatic hyperplasia: Examining the evidence and determining the risk. Eur Urol. 2001;39:390–99. doi: 10.1159/000052475. [DOI] [PubMed] [Google Scholar]
- 5.Slawin KM, Kattan MW. The use of nomograms for selecting BPH candidates for dutasteride therapy. Rev Urol. 2004;6:40–45. [PMC free article] [PubMed] [Google Scholar]
- 6.Kurita Y, Ushiyama T, Suzuki K, et al. Transition zone ratio and prostate-specific antigen density: The index of response of benign prostatic hypertrophy to an alpha blocker. Int J Urol. 1996;3:361–66. doi: 10.1111/j.1442-2042.1996.tb00554.x. [DOI] [PubMed] [Google Scholar]
- 7.Kaplan SA, Te AE, Pressler LB, Olsson CA. Transition zone index as a method of assessing benign prostatic hyperplasia: Correlation with symptoms, urine flow and detrusor pressure. J Urol. 1995;154:1764–69. [PubMed] [Google Scholar]
- 8.Ku JH, Ko DW, Cho JY, Oh SJ. Correlation between prostatic urethral angle and bladder outlet obstruction index in patients with lower urinary tracttable symptoms. Urology. 2010;75:1467–71. doi: 10.1016/j.urology.2009.08.049. [DOI] [PubMed] [Google Scholar]
- 9.Auffenberg GB, Helfand BT, McVary KT. Established medical therapy for benign prostatic hyperplasia. Urol Clin North Am. 2009;36:443–59. doi: 10.1016/j.ucl.2009.07.004. [DOI] [PubMed] [Google Scholar]
- 10.Costa WS, de Carvalho AM, Babinski MA, et al. Volumetric density of elastic and reticular fibers in transition zone of controls and patients with benign prostatic hyperplasia. Urology. 2004;64:693–97. doi: 10.1016/j.urology.2004.05.017. [DOI] [PubMed] [Google Scholar]
- 11.Sugimoto K, Matsumoto S, Uemura H, Ito H. [Distribution of elastic fiber on prostate]. Hinyokika Kiyo. 2008;54:321–24. [in Japanese] [PubMed] [Google Scholar]
- 12.Garra BS. Imaging and estimation of tissue elasticity by ultrasound. Ultrasound Q. 2007;23:255–68. doi: 10.1097/ruq.0b013e31815b7ed6. [DOI] [PubMed] [Google Scholar]
- 13.Palmeri ML, Nightingale KR. Acoustic radiation force-based elasticity imaging methods. Interface Focus. 2011;1:553–64. doi: 10.1098/rsfs.2011.0023. [DOI] [PMC free article] [PubMed] [Google Scholar]
- 14.Zhai L, Madden J, Foo WC, et al. Acoustic radiation force impulse imaging of human prostates ex vivo. Ultrasound Med Biol. 2010;36:576–88. doi: 10.1016/j.ultrasmedbio.2009.12.006. [DOI] [PMC free article] [PubMed] [Google Scholar]
- 15.Zhai L, Madden J, Foo WC, et al. Characterizing stiffness of human prostates using acoustic radiation force. Ultrason Imaging. 2010;32:201–13. doi: 10.1177/016173461003200401. [DOI] [PMC free article] [PubMed] [Google Scholar]
- 16.Zhai L, Polascik TJ, Foo WC, et al. Acoustic radiation force impulse imaging of human prostates: initial in vivo demonstration. Ultrasound Med Biol. 2012;38:50–61. doi: 10.1016/j.ultrasmedbio.2011.10.002. [DOI] [PMC free article] [PubMed] [Google Scholar]
- 17.Zhang M, Fu S, Zhang Y, et al. Elastic modulus of the prostate: A new non-invasive feature to diagnose bladder outlet obstruction in patients with benign prostatic hyperplasia. Ultrasound Med Biol. 2014;40:1408–13. doi: 10.1016/j.ultrasmedbio.2013.10.012. [DOI] [PubMed] [Google Scholar]
- 18.Homma Y, Gotoh M, Yokoyama O, et al. Japanese Urological Association. Outline of JUA clinical guidelines for benign prostatic hyperplasia. Int J Urol. 2011;18:741–56. doi: 10.1111/j.1442-2042.2011.02860.x. [DOI] [PubMed] [Google Scholar]
- 19.Abrams P, Cardozo L, Fall M, et al. The standardisation of terminology of lower urinary tract function: report from the Standardisation Sub-committee of the International Continence Society. Standardisation Sub-committee of the International Continence Society. Neurourol Urodyn. 2002;21:167–78. doi: 10.1002/nau.10052. [DOI] [PubMed] [Google Scholar]
- 20.Abrams P, Chapple C, Khoury S, et al. International Scientific Committee. Evaluation and treatment of lower urinary tract symptoms in older men. J Urol. 2009;181:1779–87. doi: 10.1016/j.juro.2008.11.127. [DOI] [PubMed] [Google Scholar]
- 21.Myschetzky PS, Suburu RE, Kelly BS, Jr, et al. Determination of prostate gland volume by transrectal ultrasound: Correlation with radical prostatectomy specimens. Scand J Urol Nephrol Suppl. 1991;137:107–11. [PubMed] [Google Scholar]
- 22.McNeal J. Pathology of benign prostatic hyperplasia. Insight into etiology. Urol Clin North Am. 1990;17:477–86. [PubMed] [Google Scholar]
- 23.McVary KT, Roehrborn CG, Avins AL, et al. Update on AUA guideline on the management of benign prostatic hyperplasia. J Urol. 2011;185:1793–803. doi: 10.1016/j.juro.2011.01.074. [DOI] [PubMed] [Google Scholar]
- 24.Zheng X, Ji P, Mao H, Hu J. A comparison of virtual touch tissue quantification and digital rectal examination for discrimination between prostate cancer and benign prostatic hyperplasia. Radiol Oncol. 2012;46:69–74. doi: 10.2478/v10019-011-0026-3. [DOI] [PMC free article] [PubMed] [Google Scholar]
- 25.Fu S, Zhang M, Wang Y, et al. Prostatic elasticity: A new non-invasive parameter to assess bladder outlet obstruction caused by benign prostatic hyperplasia (a canine experiment) Urology. 2013;82:1114–19. doi: 10.1016/j.urology.2013.07.042. [DOI] [PubMed] [Google Scholar]
- 26.Sugimoto K, Matsumoto S, Uemura H, Ito H. [Distribution of elastic fiber on prostate]. Hinyokika Kiyo. 2008;54:321–24. [in Japanese] [PubMed] [Google Scholar]
- 27.Shapiro E, Becich MJ, Hartanto V, Lepor H. The relative proportion of stromal and epithelial hyperplasia is related to the development of symptomatic benign prostate hyperplasia. J Urol. 1992;147:1293–97. doi: 10.1016/s0022-5347(17)37546-8. [DOI] [PubMed] [Google Scholar]


