Abstract
A PET detector featuring a pseudo-monolithic crystal is being developed as a more cost-effective alternative to a full monolithic crystal PET detector . This work evaluates different methods to localize the scintillation events in quartered monolithic crystals that are optically coupled.
A semi-monolithic crystal assembly was formed using four 26 × 26 × 10 mm3 LYSO crystals optically coupled together using optical adhesive, to mimic a 52 × 52 × 10 mm3 monolithic crystal detector. The crystal assembly was coupled to a 64-channel multi-anode photomultiplier tube using silicon grease. The detector was calibrated using a 34 × 34 scan grid. Events were first filtered and depth separated using a multi-Lorentzian fit to the collected light distribution. Next, three different techniques were explored to generate the look up tables for the event positioning. The first technique was 'standard interpolation' across the interface. The second technique was 'central extrapolation', where a bin was placed at the midpoint of the interface and events positioned within the interface region were discarded. The third technique used a 'central overlap' method where an extended region was extrapolated at each interface. Events were then positioned using least-squares minimization and maximum likelihood methods.
The least-squares minimization applied to the look up table generated with the standard interpolation technique had the best full width at half maximum (FWHM) intrinsic spatial resolution and the lowest bias. However, there were discontinuities in the event positioning that would most likely lead to artifacts in the reconstructed image. The central extrapolation technique also had discontinuities and a 30% sensitivity loss near the crystal-crystal interfaces. The central overlap technique had slightly degraded performance metrics, but it still provided ~2.1 mm intrinsic spatial resolution at the crystal-crystal interface and had a symmetric and continuously varying response function. Results using maximum likelihood positioning were similar to least-squares minimization for the central overlap data.
Keywords: monolithic scintillator, light sharing, boundaries, statistical event positioning
1. INTRODUCTION
Monolithic scintillator crystals represent an attractive alternative to standard detectors for positron emission tomography (PET) composed of pixelated crystals (Del Guerra et al. 2016). It has been shown that, using monolithic crystals coupled to photomultiplier tubes (PMTs) or to silicon-photomultipliers (SiPMs), a spatial resolution close to 1 mm can be reached (Llosa et al. 2010, Miyaoka et al. 2011, España et al. 2014, Mendes et al. 2011) and that the information about the depth of interaction of the 511 keV photon can be obtained (Lerche et al. 2005, Ling et al. 2007, Morrocchi et al. 2016) and used in the reconstruction algorithm to increase the spatial resolution (Staelens et al. 2004). Another advantage of continuous crystals is the higher detection efficiency at 511 keV, due to the higher fraction of volume covered by the scintillator. Several methods can be found in literature to achieve a high spatial resolution in the whole volume of the monolithic scintillator crystal, both with black or reflective lateral surfaces. It has been shown that a high resolution in the spatial positioning of the events can be achieved (Seifert et al. 2013) by using a digital silicon photomultiplier array (Frach et al. 2009) coupled to a monolithic crystal and by estimating the interaction position using a k-NN (nearest neighbor) (Van Dam et al. 2011). Furthermore, high performances have also been obtained using neural networks composed of one or two hidden layers (Bruyndonckx et al. 2004). The inputs of the networks are the signals collected on the arrays and the output is the 3D position of the scintillation event. Spatial information can be obtained also by fitting the light distribution with an analytic function. In this case, to achieve a high resolution, the optical properties like scattering, absorption and transmission coefficients through the interfaces need to be properly modeled (Li et al. 2010, Cabello et al. 2013). Finally, statistic based positioning methods based on the light response function of the detector as a function of the scintillation position have also been employed for a three-dimensional reconstruction of the interaction position (Hunter et al. 2009).
Even if these methods can model the response of the detector as a function of the detected position, a degradation in the resolution close to the edges is usually observed due to partial sampling of the light distribution at the edges. This results in a loss of specificity in the response of the detector (Ling et al. 2008) or in a wider response function of the detector. While it was originally thought that large area monolithic LYSO crystals would be significantly less expensive than pixelated crystals, the cost advantage has turned out to be less than expected due to challenges in growing large and uniform crystal boules and associated waste from cutting the boules.
A possible solution to reduce the edge effect and to obtain a more cost-effective PET system has been proposed by Vinke and Levin (Vinke et al. 2014), who simulated a detector composed of two SiPM matrices coupled to two monolithic crystals coupled together by an optically transmissive resin. The adoption of optically coupled crystals overcomes the difficulties in the fabrication of large area scintillators and potentially increases the uniformity in the response of the detector. In this paper an experimental analysis of this proposed solution was performed by developing a module composed of 2 × 2 crystals. The cost is reduced using four 26 × 26 × 10 mm3 LYSO crystals instead of one 52 × 52 × 10 mm3 crystal because the yield is higher cutting an LYSO boule into 26 × 26 × 10 mm3 than in 52 × 52 × 10 mm3 pieces. The adoption of optically coupled crystals also allows the sampling of a larger portion of the light distribution at the edge between two different scintillators, avoiding the absorption of part of the profile by the blackened lateral surfaces. Even if several types of glue and melt-mount are available on the market, it is not possible to match perfectly the refractive index of the glue and of the scintillator, thus affecting the light transmission through the interface. The main effect of this partial transmission is a discontinuity in the collected light distribution that needs to be properly modeled in the calibration of the detector.
To consider the local response of the detector, event positioning methods based on the statistic based positioning algorithm (Joung et al. 2002) were used in this study. These methods are based on the comparison of the light distribution collected in the channels of the photo-detector with a set of data stored in look-up tables (LUT) representing the response at different interaction positions. The identification of the data in the LUTs closer to the detected event is performed by means of Least Square and Maximum Likelihood algorithms (Gray et al. 1976, Clinthorne et al. 1987). LUT were constructed mainly starting from a scan of the detector at several positions with a collimated radioactive source and characterizing the data to obtain a model of the light response in two or three dimensions (Miyaoka et al. 2010). The presence of the optical interface in the scintillator requires modifications in the algorithm to construct the LUTs to take into account this discontinuity and to avoid artifacts in the reconstructed distribution of the events. Three methods to construct the calibration LUTs were proposed and studied here.
2. MATERIALS AND METHODS
We studied a module composed of four monolithic crystals optically coupled together in a 2-by-2 array to effectively behave as a single larger monolithic crystal covering the whole surface of a position sensitive PMT (Fig. 1). This work analyzed the effect of a semi-transmissive interface between monolithic crystals and the best way to recover spatial information close to that region. The performances in different regions of the detector were compared to determine the degradation of spatial and energy resolution due to the optical interfaces between the crystals. To estimate the interaction position of the annihilation photon, a preliminary calibration was performed on a 34 × 34 point scan on the front surface of the detector. Both Least Squares and Maximum Likelihood (Hunter et al. 2009) methods were used. A test set of data was then positioned for each scan location.
Figure 1.
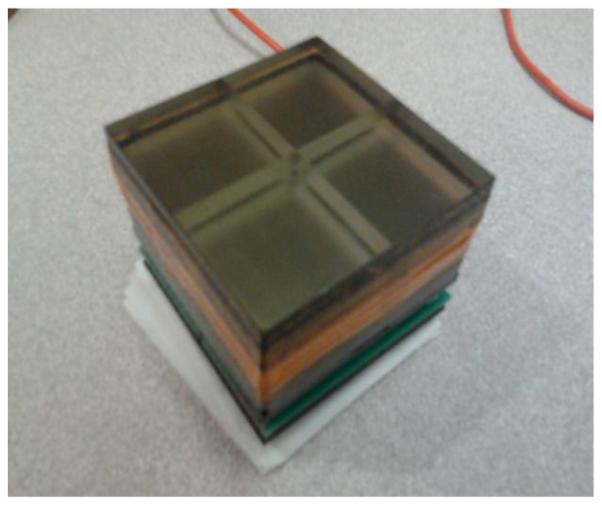
Picture of the pseudo-monolithic crystal optically coupled to the PMT.
A module composed of 4 LYSO scintillator crystals coupled to a HamamatsuTM H8500C multi-anode photomultiplier tube (MAPMT) was developed. The size of each crystal was 26 mm × 26 mm × 10 mm, and they were optically coupled together using 'Cargille Meltmount Quick Stick' (with refractive index n=1.704). This four-crystal assembly was coupled to the PMT surface using 'BC-630 Saint Gobain' optical grease (refractive index n=1.465). All lateral faces of the crystals were roughened with 1000-grit sand paper and the outward-facing lateral surfaces were painted black to avoid internal reflections of the scintillation light. Edge reflection can cause the detector response to flatten near the edges, decreasing the spatial resolution (near the edge). The crystal surface coupled to the PMT was diffusive to maximize the light collection, while the opposite side was polished and covered with 4 layers of Teflon and then with a specular 3MTM VM200 mirror film layer on top. A specular reflective layer was added to maximize the light collection and to avoid a loss of light due to a minimal transparency of the Teflon layers. Since the light that reaches the specular reflector travels through the Teflon layers, the final effect is still a diffuse reflection.
For the calibration a point flux was produced using a 22Na source with a 0.5 mm diameter read in coincidence with a single 4 mm × 4 mm × 20 mm LYSO crystal (the coincidence crystal) coupled to one anode of a second Hamamatsu H8500C PMT. Both MAPMTs were read out using two copies of an FPGA-based data acquisition electronics developed in house (Lewellen et al. 2010). Each UW-DAQ board samples up to 64 channels at 60 MHz (Signal channels) and 1 channel at 300 MHz (Fast channel - used for coincidence processing). The last dynode stages of the H8500s were used for coincidence timing.
The distance between the entrance surface of the coincidence crystal and the radioactive source was about 100 mm, while the distance between the entrance surface of the 4-crystal assembly and the source was about 10 mm. This geometry produced a point flux of approximately 0.5 mm diameter on the entrance surface of the detector being calibrated. The PMT coupled to the coincidence crystal was mounted on a 5-micron-precision 2-dimensional (2D) mechanical translator to scan the whole surface of the assembly. A bias voltage of 850 V was applied to both H8500C PMTs. Data were collected on a 34-by-34 grid of calibration points. The positions of the scan points with respect to the PMT anodes and to the scintillator are represented in Fig. 2. The edges of the crystal were found with a 0.2 mm scan on the four edges of the detector. Since the scan time on each point is constant, the number of events measured under the photopeak depends on the position of the beam, and the edges can be found by fitting the number of events as a function of the position with an S-curve. The center of the module was assigned to the mid-point between the inflection points at the two sides. The centre of the grid corresponded to the centre of the detector and the step of the grid was 1.52 mm, corresponding to 1/4 of the anode pitch of the H8500C. In particular, positions 17 and 18 in both directions were the two positions closest to the optical interface. A total of 50.16 mm × 50.16 mm was covered in the scan. Calibration data were filtered and used to reconstruct the Look-Up Tables of the mean and the standard deviation needed for the Least Squares and for the Maximum Likelihood positioning methods.
Figure 2.
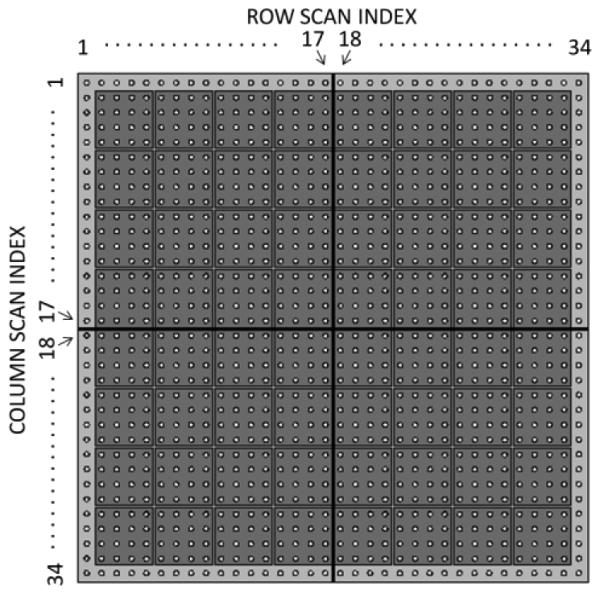
Collimated beam positions in the scan respect to the PMT anode and to the scintillator interfaces. Dots in the figure represent the beam position, soft gray represents the scintillator and the darker gray squares represents the 64 anodes of the PMT.
2.1 Investigated Performance
The energy resolution for each beam position was evaluated by dividing the FWHM of the peak distribution by the value of the peak position. The resolution obtained close to the inner interfaces was compared with the spatial resolution at the centre of each crystal.
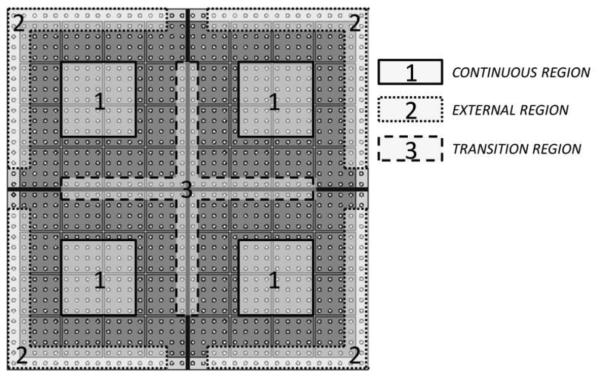
The resolution and bias of the position estimates were analyzed separately in three regions, as represented in Fig. 3: at the centre of a crystal (CONTINUOUS REGION), in the region close to the internal boundaries (TRANSITION REGION) and at the external edges (EXTERNAL REGION). In each quadrant of the semi-monolithic crystal, the CONTINUOUS REGION was composed of a subset of beam positions corresponding to the central part (positions from 6 to 12 and from 23 to 29 in both directions in Fig. 2). The TRANSITION REGION was the subset in which the beam is close to the optical interface (i.e., positions 17 and 18 in both directions). The 5 rows and columns closest to the external boundary were discarded to avoid artifacts due to the black external surface. The EXTERNAL REGION of the detector was defined as the first two and the last two scan positions (positions 1 and 2 and positions 33 and 34 in both directions). In this external region, the acquisitions close to the optical interfaces (positions 16 to 19 in both directions) were not used to avoid the effect of the optical coupling. The scan points close to both inner optical interfaces and external absorber surface were excluded from the analysis to decouple their effects. These points were rejected, even if no significant evidence of artifact was found, to have a more robust comparison of the behavior in the different regions.
Figure 3.
Representation of the three different regions of the detector taken into account in the analysis.
For each beam position, the contours corresponding to the half maximum and to the tenth maximum of the distribution were found. A circular fit was applied to each contour. The full width at half max (FWHM) and full width at the tenth max (FWTM) of the distribution were then expressed as the diameter of each circle. Due to partial reflection at the inner and external interfaces, the spatial distribution of the reconstructed events can be asymmetric. Therefore, for each single reconstructed point, the mean and median distance from the centre of the corresponding distribution were also considered. Furthermore, the sum in quadrature of bias and median distance from the centre of the reconstructed distribution were also evaluated for each region.
Finally, an additional metric "r" was considered, combining the bias and the spread of the estimate distribution, defined as the value at which the distance of the reconstructed positions for the beam positions x=x0−r and x=x0+r is equal to the mean spread of the distribution on these two points. In the X and Y direction rx and ry were obtained as:
| (3) |
The value r was obtained as the sum in quadrature of rx and ry.
In the results, the contribution of the beam spot size was not subtracted, but from geometrical considerations we estimate a diameter between 1.0 and 1.2 mm FWHM.
2.2 Position Estimation
For the three-dimensional positioning of the scintillation events in the crystal the signal distribution on the 64 channels of the PMT is compared with the distributions stored in the LUTs. The methods of Least Squares and Maximum Likelihood were used. The Least Squares method is faster, because it is based only on the mean signal collected on each point of the scan. The Maximum Likelihood also takes into account the variance of each value collected in the calibration process and therefore it should be able to provide better spatial resolution. Therefore the two methods were tested. In addition, a DOI separation of the calibration data-set was performed to obtain 3-D LUTs.
In the least squares analysis, the position of the events was estimated by searching the LUTs for the position that minimized the Least-Squares difference between observation and mean response. In this case the position was found by minimizing the distance between the value of the position in the LUT and the collected signals:
| (1) |
where μi is the value recorded in the mean LUT and ai are the measured values, and the sum runs over the 64 channels of the PMT. To speed-up the process, a hierarchical search was used. The first search used 5 points in the x and y direction and all 4 possible depths of interaction positions. The search was then refined in the neighborhood of the selected position. No evidence of loss in resolution using the hierarchical search was found with respect to using an exhaustive search. No difference in the least squares search was implemented for the three different sets of LUTs. Energy filtering of the photo-peak events in each acquisition was done using the integrated signal (200-ns gate) collected from the Fast channel. The energy window used was [5/6, 3/2] of the photo-peak energy; this window equates to 425 keV lower and 765 keV upper thresholds. The lower energy threshold was chosen to be half way between the photo-peak and the Compton back-scatter peak. The upper threshold was used to reject Compton scatter of the simultaneous 1274 keV gamma ray produced by 22Na. A high value was chosen to avoid cutting of the distribution, broadened by the increasing light collection efficiency with depth of interaction.
The third LUT method (Central Overlap) was also tested using a Maximum Likelihood search. It was assumed an independently distributed normal (i.d. normal) signal probability model as in (Ling et al. 2007), the Likelihood function is then expressed as:
| (2) |
In this case, position is reconstructed minimizing the negative logarithm of the likelihood:
| (3) |
where σi is the value of the standard deviation, collected in a set of LUTs.
2.3 Calibration for LUTs generation
The steps performed for the calibration of the module are shown in Fig. 4 and described in this section. The method adopted here is similar to that reported in (Li et al. 2012, Ling et al. 2007), but modifications were applied to model the response of the detector at the optical interfaces and to avoid artifacts.
Figure 4.
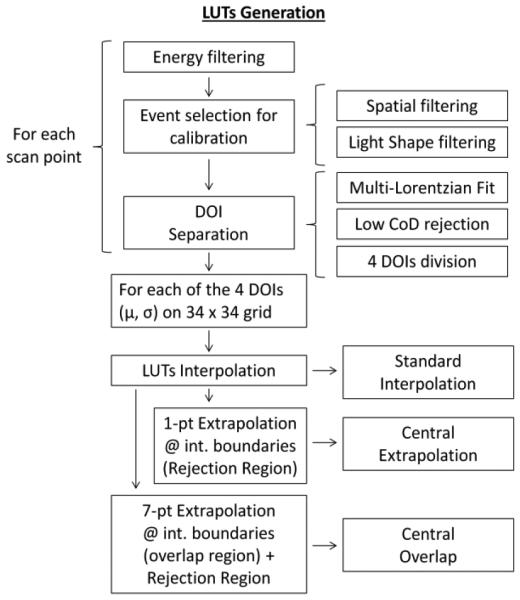
Diagram of the steps performed in the LUTs generation. DOI stands for depth of interaction and CoD stands for coefficient of determination.
2.3.1 Event selection
Two filtering steps were performed to reduce the impact of multiple interactions and random coincidences in the value of the LUTs, filtering is based on the estimated position of the event and on the light distribution on the 64 channels of the PMT.
Spatial filtering
We ignored event position estimates far from the centre of the ensemble distribution in each acquisition. Events outside of a contour (i.e., 5% of the peak ensemble distribution) obtained with Anger logic positioning were rejected as these events have Compton scattered in the crystal before being photoelectrically absorbed and therefore are not useful for calibrating the detector light response function (Li et al. 2012, Ling et al. 2006). A fraction between 25% to 30% of the events were discarded with this selection method. For points closer to the central interface the fraction of the rejected events increased up to 40%.
Filtering of the events
An event was discarded if the channel with the maximum signal collected less than 15% of the total amount of light (i.e., to reject Compton scatter in the detector) or if the channel with the maximum value differed from that in front of the collimated beam. This second selection is particularly useful close to the optical interfaces because the lateral tail of the collimated beam can interact in a neighboring crystal and generate events with a very different light distribution. Between 5% and 8% of the events were discarded during this step. As in the previous case, the fraction increased close to the central interface to about 14%.
2.3.2 DOI separation using a Multi-Lorentzian fit
Methods to separate the calibration events in terms of depth of interaction are available in literature (see i.e. Ling et al. 2007), in this case the effect of the inner interface has to be taken into account and some modifications to the available algorithm are required to properly model the discontinuity at the inner interfaces.
The depth separation was performed by fitting the light distribution collected for each event and by sorting the events using the width of the obtained distribution. The light spread is assumed to increase monotonically with distance of interaction from the anodes. In particular, a Lorentz function was considered to model the spatial distribution of light on the PMT, additional Lorentzians were used to model the reflected light, using two different parameters for the reflection probabilities from internal (Rint) and external (Rext) surfaces. Compared to the non-segmented case, the image sources due to the reflections at the optical interface are also considered and the coefficient related to the internal transmission and reflection at the internal boundary is taken into account. A uniform background was used to model light diffused from the Teflon on the top surface. This contribution is weighted considering the number of inner interfaces between the scintillation point and the detection point. The number of image sources needed to take into account the inner and lateral reflections depends on the position of the detection point with respect to the position of the scintillation point. Only light coming from no more than one reflection and no more than two transmissions was considered. This choice was done to avoid too high a number of image sources and because we expected a high transmission coefficient for the inner surfaces (Tint = 1 − Rint, assuming negligible absorption at the interfaces) and a low reflection probability at the edge of the crystal. The equation adopted to fit the light distribution is then the following:
| (4) |
The number of reflections and transmissions at the optical interfaces (NIR and NIT) and the number of reflections at the external interfaces (NER) depends on the x-y position and on the centre of each Lorentzian curve. The Lorentzian with j=0 corresponds to the curve centered in the scintillation point (x0, y0), while Lorentzians with j>0 corresponds to image sources.
Being that the number of reflections and transmission through the interface as well as the number of image sources depends on the x-y position in which the function is evaluated, a discontinuity is present in the function at the boundaries between crystals. A total of 8 parameters were used to describe the function:
A0: contribution of diffused light.
A: amplitude of the Lorentzian representing the direct light
x0 and y0: coordinates of the centre of the scintillation
wX and wY: width of the Lorentzian in the two directions
Rint: internal surfaces reflection probability
Rext: external surfaces reflection probability
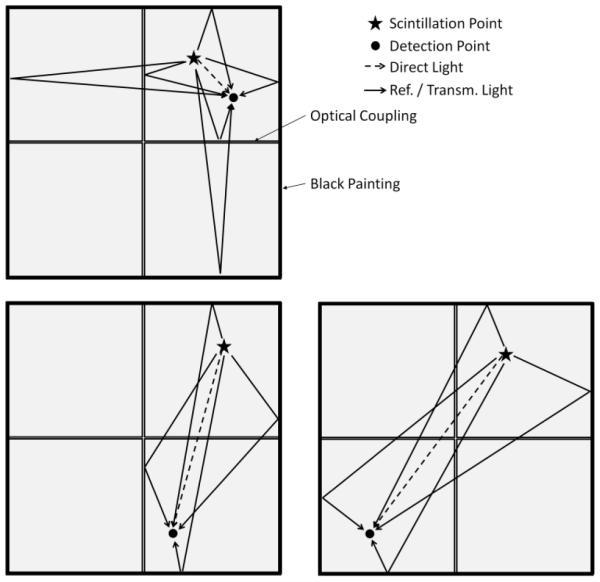
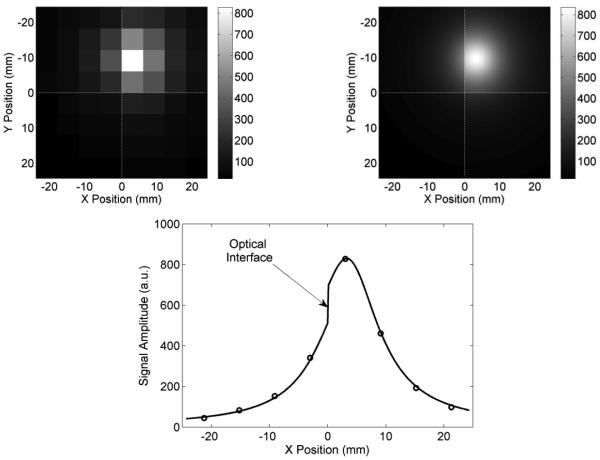
The contribution of image sources for three different sets of scintillation and detection points are shown in Fig. 5. An example of the light distribution on the PMT and the curve obtained by Lorentzian fit are shown in Fig. 6. The mean value and the standard deviation of the internal and external reflectivity and of the curve width obtained in the fit are shown in Table 1 for each depth of interaction and for three different regions of the detector described in 2.2 and represented in Fig. 3.
Figure 5.
Contribution of image sources for three different positions of the scintillation (star) and detection points (black points in figure): with both points in the same quadrant (top), with the two points separated by a single optical interface (bottom-left) and with the two points at two opposite quadrants of the module (bottom-right). The lines between the quadrants represent the optical interfaces between monolithic crystals while external frames represent the lateral surfaces, painted black. Arrows represent direct light (dashed) and reflected light (continuous).
Figure 6.
(top-left) example of the light distribution on the 64 channel of the PMT, (top-right) multi-Lorentzian curve obtained by the fit of the distribution on the left, (bottom) profile of the light distribution on the third row of the PMT and profile of the fit on the same Y position. Note the discontinuity due to crystal-crystal interface (arrow).
Table 1.
mean value of width, internal reflectivity and external reflectivity for each DOI and for three regions of the detector: close to the internal interface, close to the centre of each crystal and close to the external edges.
|
TRANSITION
REGION |
CONTINUOUS
REGION |
EXTERNAL
REGION |
|||||
|---|---|---|---|---|---|---|---|
| μ | σ | μ | σ | μ | σ | ||
| Width (mm) | DOI 1 | 3.1 | 0.6 | 2.8 | 0.8 | 2.4 | 0.7 |
| DOI 2 | 6.5 | 0.5 | 6.6 | 0.6 | 6.1 | 0.6 | |
| DOI 3 | 8.5 | 0.5 | 8.9 | 0.6 | 8.4 | 0.5 | |
| DOI 4 | 11.0 | 0.7 | 11.2 | 0.7 | 10.7 | 0.6 | |
|
Internal
Reflectivity |
DOI 1 | 0.25 | 0.04 | 0.15 | 0.04 | 0.30 | 0.08 |
| DOI 2 | 0.25 | 0.03 | 0.16 | 0.03 | 0.22 | 0.04 | |
| DOI 3 | 0.27 | 0.03 | 0.16 | 0.03 | 0.19 | 0.04 | |
| DOI 4 | 0.31 | 0.03 | 0.18 | 0.03 | 0.19 | 0.05 | |
|
External
Reflectivity |
DOI 1 | 0.17 | 0.10 | 0.06 | 0.05 | 0.25 | 0.10 |
| DOI 2 | 0.14 | 0.11 | 0.06 | 0.04 | 0.27 | 0.12 | |
| DOI 3 | 0.08 | 0.07 | 0.04 | 0.03 | 0.16 | 0.10 | |
| DOI 4 | 0.04 | 0.03 | 0.02 | 0.01 | 0.07 | 0.05 | |
An acceptance window was applied both to the scintillation position (X0, Y0) and to the external reflectivity (Rext) to discard the events that did not have realistic fit results for the calibration. In particular, only events with the scintillation centre reconstructed closer than 5 millimeter in both directions to the real beam position were used, and fits that gave a Rext higher than 0.9 were discarded. Fit results that had a low Coefficient of Determination (CoD below 0.90) were also discarded. Here, the CoD is defined as 1 minus the sum of the squares fit residuals divided by the measured light-distribution variance. The fraction of events discarded was always lower than 15%. Even if a high transparency is expected, no limitations were applied to the internal reflectivity (Rint) because the behavior of the light at this internal interface was part of the study and the introduction of constraints could bias the evaluation. Even if the width of the Lorentzian (wX and wY) was expected to be the same in both directions, the two parameters were left independent and they were summed in quadrature to estimate the width of the curve.
Accepted events were divided into 4 groups according to the 2D geometric-average width of the Lorentzian bell. The number of events in each group was imposed to be the same. In this way, by using the attenuation coefficient of the LYSO and the exponential attenuation law, the boundaries of the 4 depth of interaction intervals were obtained, the thickness of the intervals increase with depth in the crystal. Considering an attenuation length of the scintillator of 12 mm (Lopes et al. 2004), the four DOIs corresponded to the intervals [0 mm, 1.83 mm], [1.83 mm, 3.99 mm], [3.99 mm, 6.62 mm] and [6.62 mm, 10 mm] (assuming a value of DOI = 0 mm at the entrance of the scintillator). Four Depth of Interaction intervals were chosen according to the results obtained in DOI resolution with the cMiCE detector in (Ling et al. 2007). The DOI separation is useful to obtain the DOI information and also to increase the specificity of the LUTs and the performance in the other two directions.
2.3.3 Look up Table (LUT) Generation
Events selected and divided in groups according to the width of the fitted curve were then used to evaluate the value of the LUT on each of the 34 × 34 points of the scan grid. For each group, signals collected far from the median of the distribution in the acquisition were discarded. The tail of the signal distribution was truncated and not included in the construction of the LUTs because these signals tend to be quite noisy. The median of the distribution of the signals was calculated, and data farther than N times the median distance from the median of the distribution were rejected. A value of N equal to 12 was chosen, since a low value of N reduces the estimation of the standard deviation of the signal, while too high a value reduces the precision in the estimation of the mean. Considering the overall calibration process only 20-25% of the acquired events were kept for the generation of the LUTs.
The values of mean and standard deviation of the distribution of the selected events were obtained for each channel, for each position and for each depth of interaction. These values were then interpolated to obtain the calibration of the response of the detector of a denser grid. Compared to monolithic scintillators, in which values can be simply interpolated, with optically coupled crystals the generation of the LUTs close to the optical coupling needs some modifications to avoid artifacts due to the discontinuous response of the detector across the interfaces.
Three different methods were tested to generate the LUTs:
- Standard interpolation. Inside each crystal volume, four interaction points were interpolated between measured calibration points of the grid using a bi-cubic fit. Each quadrant was interpolated separately to avoid the introduction of artifacts and oscillations in the interpolated trend due to the discontinuity of the mean value at interfaces. At the inner interfaces, the four interpolation points that connect each pair of quadrants (between the 17th and 18th point in each direction as shown in Fig. 2) were obtained by means of a linear extrapolation of two points from each side. At the external borders, four points were linearly extrapolated: the first three corresponded to real positions inside the crystal between the first or the last scan position and the crystal edge, while the last point was used to collect and discard the events that did not converge to any possible value of the LUT. The size of the LUT in both X or Y direction for each depth and each channel using this approach was:
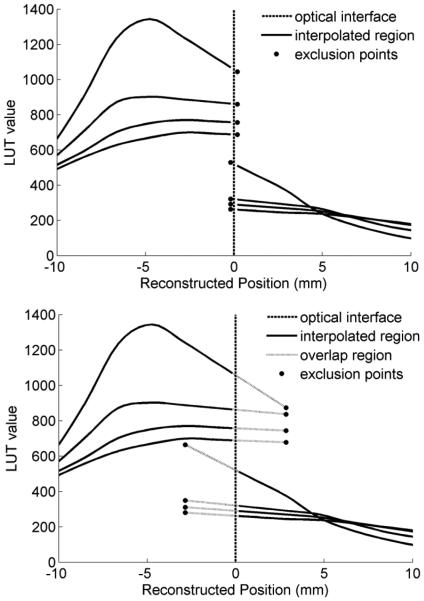
where Npt = 34 is the number of calibration points, Ninter = 4 is the number of interpolated points between each step of the initial grid and Nextrap = 8 is the number of extrapolated points at the boundaries in the x and y directions. The attractiveness of this technique is that it is simple. Its shortcoming is that it can lead to hot spots in a uniform flood crystal map which in turn can lead to artifacts in a reconstructed PET image. Central Extrapolation. In this second case, the LUTs were built as in the previous one, but one row and one column of extrapolated points were added between each quadrant. This new region that separates each pair of crystals did not correspond to any real physical position in the detector and was used to collect and discard events that in the previous case were arbitrarily positioned closer to the optical interfaces even if that was not their optimal position. In principle, this kind of event can also be selected in the previous case based on the value of the likelihood in the estimated position, but that method requires choosing an optimal threshold for the likelihood, that could be position-dependent. The artifact introduced in the previous method by the accumulation of events at the boundary, due to the discontinuity in the mean LUTs, was partially solved with this approach, at the expense of a lower sensitivity close to the crystals connections. The size of the LUT in each direction is now Size2 = 176, because two extrapolated points were added in the x and y directions. An example of LUT behavior with this method is shown in Fig. 7-top: the black dots at the centre of the LUT represent the positions in which the events were discarded. The central part of the LUT for one of the 64 channels, for a single X position and for all the 4 possible depths is shown.
Central Overlap. In this third approach an additional region was linearly extrapolated at the boundary between each couple of crystals. Each additional extrapolated point had a physical position in the detector in the neighbor crystal so that each position close to the optical interface corresponded to more than one position in the LUTs. A total of Noverlap = 7 overlapping positions on each side were added, corresponding to an overlap region of 4.3 mm. The reconstructed position in the overlap region might not correspond to the real interaction position, and a reduction in the spatial resolution close to the interface region was introduced because the extrapolation was done across a discontinuity and the reconstructed position in this extrapolated region corresponded to points that had a completely different distribution of light in the real calibration grid. The main advantage of this method is that the loss in sensitivity is reduced compared to the previous approach, and the distribution of events close to the surface has a more symmetric shape and less discontinuity. If the overlap region is too large, part of this region can be excluded and events that converge there can be discarded. The size of the LUT in the x and y direction is now Size3 = Size2 + 2 * Noverlap = 190. An example of LUT behavior in the overlapping region is shown in Fig. 7-bottom. The dotted lines represent the overlap region: as it can be seen, even if the extrapolated region of the left crystal is used, the events in that region are reconstructed in the other crystal. The black dots represent the points in which the event was discarded.
Figure 7.
Example of LUT generation for a single channel and for the four depths of a single line of the LUT using the central extrapolation method (top) and the central overlap method (bottom).
No filters were applied to the LUTs obtained for the mean, while the LUTs related to the standard deviation were usually noisier and some correction of outlier points was used to minimize the artifacts in the position reconstruction. In particular, outliers of the standard deviation LUTs (before the interpolation) were replaced by an average of their eight nearest neighbors: the variation between a point and each point in its neighborhood was calculated, and if one of these variations was greater than twice the average of the group of points, the value was replaced with that obtained with a 5 × 5 Gaussian filter. No changes were applied to those points where the distribution was continuous.
3. RESULTS
3.1 Energy Resolution
Figure 8 shows an example of the energy distribution obtained at three positions of the scan: close to the centre of one crystal (left), close to the interface region between two crystals (centre), close to the centre of the module (right). A Gaussian fit of the photo-peak is also shown for each distribution and results are reported on each plot. The difference in amplitude between the three peaks is not entirely due to the effect of light optics at the interfaces but also to the different gain and PDE of the channels of the PMT.
Figure 8.
Example of energy distribution at three different points of the detector: at the centre of the continuous region of a crystal (left), at the centre of the optical interface between two crystals (centre), at the corner of the interface of all four crystals (right).
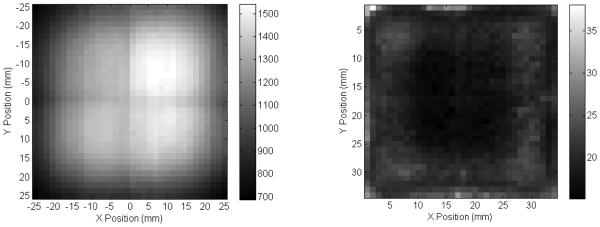
Figure 9-left uses a gray scale map to display the energy peak value for each of the 34 × 34 points scanned. The lower values at the edges of the module are due to the absorption of light by the black lateral surfaces.
Figure 9.
Peak position, expressed as ADC values (left) and energy resolution expressed as a percentage of the FWHM of the peak distribution divided by the peak position (right) for the 34-by-34 positions of the scan.
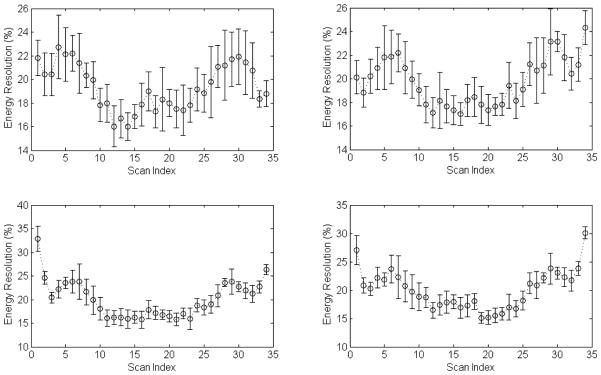
The read-out electronics is designed so that the baseline of the signal corresponds to a level of 0 ADC counts, so the energy resolution can be measured evaluating the FWHM of the distribution and dividing by the position of the energy peak. The FWHM and the peak centre were evaluated using a Gaussian fit on the photo-peak. Figure 9-right represents the map of the energy resolution obtained in the scan. The inner interfaces do not affect the energy performances of the module, while the resolution degrades approaching the edges. An energy resolution better than 20% was obtained in the central part of the module independent of how close the point was to the optical interface between crystals. The energy resolution as a function of the beam position is shown in Fig. 10 for the 9th horizontal and vertical lines of the scan (top plots) and for the two diagonals (bottom plots).
Figure 10.
Energy resolutions in the profiles of the scan corresponding to line 9 (top-left), to column 9 (top-right), to the top-left/bottom-right diagonal (bottom-left) and to the top-right/bottom-left diagonal (bottom-right).
3.2 Least Squares Event Positioning
Each test-set of the 34 × 34 scan points was positioned using the Least Squares method and the three sets of LUTs. In the continuous part of each crystal and at the detector edges the LUTs were the same, and the difference in the reconstructed distributions were concentrated close to the interface. A distribution obtained close to the centre of a crystal is shown in Fig. 11-left (position 9-9), an example of a distribution obtained at the edge of the module is shown in Fig. 11-centre (position 1-9) and the distribution obtained at one corner of the detector (position 34-34) is shown in Fig. 11-right. The maps of the events distribution for a beam position close to the centre of the module (position 17-17) are shown in Fig. 12 for the three methods.
Figure 11.
Maps of the events distribution reconstructed using the Least Squares method for one position close to centre of one of the four crystal in the scan index 9-9 (left), for a position close to the edge of the detector, corresponding to the scan index 1-9 (centre) and at the corner of the detector in the scan index 34-34 (right).
Figure 12.
Maps of the events distribution for one position close to the inner edge of the four detectors reconstructed using the Least Squares method and the three methods for the LUTs generation: standard interpolation (left), central extrapolation (centre), central overlap (right). Only a section of the real detector area is shown in figure to zoom in the area that contains the events. Magenta lines in the plots represent the position of the optical interface.
Using a standard interpolation on the two sides of the optical interface, a large amount of events are positioned at the proximity of the interface, introducing an artifact in the event distribution. The artifact is due to the discontinuity of the LUT value across the interface; it does not appear in the events distribution if the central extrapolation method is used simply because part of the events that were compressed to the boundary now converge to rejection positions and are discarded. Using the central extrapolation method, the spatial distribution at the crystal interfaces is partially recovered at the expense of a much lower sensitivity at the internal surfaces. In the standard interpolation case, instead, there was no loss of events in the interface region. Part of the events discarded with the central extrapolation method are positioned in the overlap region if the central overlap method is applied; in this case the estimate distribution is symmetric, as we expect, and the discontinuity in the distribution due to the interface is significantly reduced in the map of the events. Only a small discontinuity at the tails of the distribution appears in the image, due to the end of the overlap region.
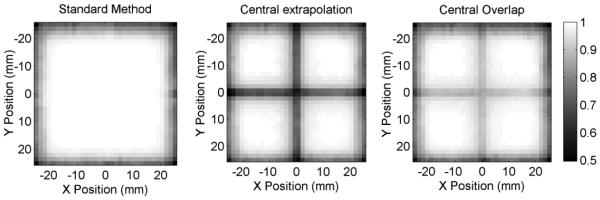
The profiles on the X and Y directions of the distributions obtained with the three methods, corresponding to the real Y and X position of the beam, are shown in Figs. 13 and 14, respectively. Depending on the method used, the fraction of events that are placed in the exclusion points and then discarded is different: the maps of the fraction of accepted events for each beam position and for each method are shown in Fig. 15. The results for the three regions previously described and for all methods are summarized in Table 2. The results concerning the continuous regions and the external regions of the detector are the same in all the three cases. Also the maps of the median distance from the centre of each reconstructed distribution and the bias of each distribution from the real position are shown in Fig. 16 for the central overlap method.
Figure 13.
Profiles on the X direction of the event distribution shown in Fig. 7 for the three methods: standard interpolation (left), central extrapolation (centre), central overlap (right). The Y coordinate of the profiles corresponds to the real Y beam position.
Figure 14.
Profiles on the Y direction of the event distribution shown in Fig. 7 for the three methods: standard interpolation (left), central extrapolation (centre), and central overlap (right). The X coordinate of the profiles corresponds to the true X position of the beam.
Figure 15.
Fraction of accepted events for each position of the scan using the three methods to build-up the Look-Up Tables: (left) standard interpolation method, (centre) central extrapolation method, (right) central overlap method.
Table 2.
Performances obtained using the methods under investigation to build the Look-Up Tables (standard interpolation, central extrapolation and central overlap). The three analyzed regions correspond to: close to the centre of each scintillator (CONTINUOUS REGION), at the boundary region within the crystals (TRANSITION REGION), in an external frame of the detector (EXTERNAL REGION). Mean and median distances of estimates are measured with respect to the average (centre) of the estimate distribution. Events were positioned using a Least Squares method.
| Parameter (mm) | CONTINUOUS REGION |
EXTERNAL REGION |
TRANSITION REGION (standard interpolation)* |
TRANSITION REGION (central extrapolation) |
TRANSITION REGION (central overlap) |
|---|---|---|---|---|---|
| bias | 0.40 | 1.43 | 0.37 | 0.61 | 0.39 |
| mean dist. | 2.46 | 2.74 | 2.79 | 3.13 | 2.94 |
| median dist. | 1.59 | 2.16 | 1.68 | 1.95 | 1.96 |
| FWHM | 1.62 | 2.44 | 1.36 | 1.83 | 2.10 |
| FWTM | 3.76 | 5.52 | 3.20 | 4.22 | 4.98 |
| sum in quadrature of bias and median |
1.65 | 2.60 | 1.73 | 3.19 | 2.00 |
| r | 1.40 | 2.61 | 1.42 | 1.45 | 1.54 |
results in transition region with standard interpolation method are partially driven by the artifact in the reconstructed distribution.
Figure 16.
Maps of the median distance from the centre of the estimate distribution (left) and of the bias of each distribution (right) obtained using the central-overlap LUTs and the Least Squares positioning method.
3.3 Maximum Likelihood Positioning Method
The results obtained with the Maximum Likelihood search in the first two approaches are similar to those of the Least Squares method and have the same limitations in terms of artifacts and sensitivity. The results obtained with Maximum Likelihood search are summarized here for the third method (central overlap), which is the most promising.
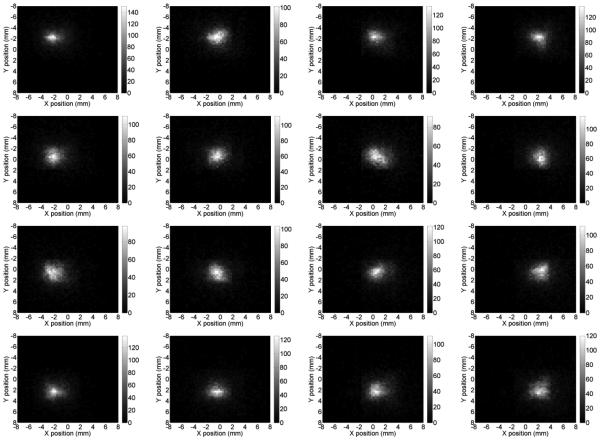
The maps of the median distance from the centre of the estimate distribution (left) and the map of the bias between the mean estimate position and the true beam position (right) are shown in Fig. 17. A pattern is clearly visible in the median distance map, in fact the resolution slightly changes if the beam is in front of a single channel of the PMT or between two or four channels. The same effect can be seen less clearly in the map of the bias. Small changes in performances between the four quadrants can be due to different PDE of the channels and to local imperfections of the top reflecting surface. The 4 × 4 distributions closer to the centre of the module are shown in Fig. 18. The edge effects can be noticed at the positions where the overlap region ends, because events reconstructed beyond it were rejected. Table 3 summarizes the performance obtained with the Maximum Likelihood method for comparison with the results in Table 2 obtained for the Least Squares method.
Figure 17.
Map of the median distance from the centre of the estimate distribution (left) and of the bias of each distribution (right) obtained with the Maximum Likelihood method.
Figure 18.
Maps of the events distribution for the 4-by-4 central beam positions using the central overlap method for the LUT generation and the Maximum Likelihood method.
Table 3.
Maximum likelihood estimation performance obtained using the central overlap method to build the Look-Up Tables for mean and standard deviation. The three analyzed regions are the same as for Table 1. Mean and median distances of estimates are measured with respect to the centre of the ensemble distribution.
| Parameter (mm) | CONTINUOUS REGION |
TRANSITION REGION |
EXTERNAL REGION (central overlap) |
|---|---|---|---|
| bias | 0.29 | 0.38 | 1.41 |
| mean dist. | 2.61 | 2.84 | 3.01 |
| median dist. | 1.78 | 1.90 | 2.34 |
| FWHM | 1.70 | 2.08 | 2.04 |
| FWTM | 4.22 | 4.81 | 4.99 |
| sum in quadrature of bias and median |
1.74 | 1.94 | 2.73 |
| r | 1.49 | 1.54 | 2.72 |
4. DISCUSSION
Positioning performances (resolution and bias) and energy resolution are comparable for all the three methods in the four continuous regions of the scintillator. The small discrepancies in the results for the four quadrants can be due to slight differences in the optical coupling between crystal and photo-detector, between crystal and reflective surface and to differences in sensitivity in the 64 channels of the PMT.
Due to the difference in gain of each anode of the PMT and to the absorption of the optical photons at the lateral surfaces, the 511 keV photo-peak position varies with interaction position in the crystal. About 2% degradation in energy resolution can be seen near the quadrant interfaces as compared to the centre of each quadrant; this degradation is lower than that due to the black lateral surfaces at the external edges of the detector.
The first LUT-generation method (Standard Interpolation) is consistent with the methodology applied with a single monolithic crystal (see e. g. Miyaoka et al. 2010), with the only exception that interpolation is made separately on each quadrant. This naïve approach seems the most promising in terms of median distance and FWHM of position estimates near the quadrant interfaces. However, the artifacts in the distribution of the estimated event positions can induce errors in the reconstructed PET image. This estimate-distribution artifact is a result of the discontinuity of the values in the LUT along the optical surface. Fluctuations in the measured signals would cause some events to be positioned across the boundary region, if there were no boundary in the LUT. These events are now confined by the LUT discontinuity and are instead reconstructed as close as possible to the discontinuity, on the side in which the photon interacts. The discontinuity in the LUT appears to improve the spatial positioning in that region; however, the “improved” spatial resolution is an artifact caused by events being piled up at the region of the crystal interface.
Using the second method (Central Extrapolation), events that pileup at the interface in the previous case are placed in the reject region and are discarded, thus reducing the sensitivity at the interface region by about 30%. As mentioned above, part of these discarded events are true events and the rejection is due to the statistical distribution of the signals. Thus, the Central Extrapolation method results in an asymmetric and biased estimate distribution and is undesirable for using PET imaging as a quantitative metric.
The third method (Central Overlap) mitigates the reduction in sensitivity. Many of the events that were previously discarded are now positioned in the other quadrants. This method broadens the FWHM of the reconstructed distribution, but the shape obtained is now symmetric, as we would like it to be if we do not account for a spatially variant point spread function in the image reconstruction. The main advantage of this method is that the point spread function representing the detector response is more uniform in the whole area of the detector.
We have also shown for this detector (and the third method), that assuming an independent normal probability model for the signal distribution, the performance of a maximum likelihood position estimator is comparable to the positioning performance by a least squares estimator. The performance of the module at the edges have not been completely optimized (this work is mainly focused on the analysis of the effect of the interfaces between optically coupled crystal quadrants) and more advantages may be obtained working on the event filtration close to the external edges (where the resolution is lower and the filtering of Compton events is less effective) and on the optimization of the interpolation LUTs at the external edges of the module. The Central Overlap method described here matches together the capabilities of high detection efficiency close to the optical interface and high uniformity in the shape of the point response function of the detector, which simplifies the modeling of the detector in the image reconstruction algorithm. This method is therefore convenient in PET applications where the rejection of such events is not possible since a uniform distribution of the detector response also close to the inner interface and a high detection efficiency in the whole area of the detector are required. However, in some other applications, it might be more convenient to reject these events, in particular if a higher event rejection is possible and if the detector response can be modeled locally in the image reconstruction program. Both methods were therefore proposed as alternatives to be applied in different cases. The reconstruction of a PET image would be necessary to determine if the events should be discarded or reconstructed in the overlap region, and this would require a dedicated study.
5. CONCLUSIONS
The effects of an optical surface between monolithic crystals were studied. Three different calibration methods (Standard Interpolation, Central Extrapolation and Central Overlap) were used to reconstruct the X-Y position near optically coupled interfaces using a least squares method. The first two methods showed artifacts due to the accumulation of events at the optical interface (standard interpolation) or a high reduction in sensitivity (central extrapolation). The addition of an overlap region in the LUTs in the third method caused more than one light shape to correspond to the same real position, and the effects of statistical fluctuations of the signal collected on the anodes and of the Compton events across the surfaces were taken into account, avoiding artifacts. With the central overlap method, a FWHM of about 1.6 mm was obtained at the centre of each monolithic crystal while a FWHM of 2.1 mm was obtained near the optical interfaces between quadrants; a loss in sensitivity of about 15% was seen at the centre of the detector, where the four crystals come together. Only a very small degradation in energy resolution (about 2% more) was observed close to the optical interface region with respect to the centre of each individual crystal.
These results were obtained with a Least Squares estimator. Comparable positioning performance was obtained when using a Maximum Likelihood estimator with an independent normal signal probability model. More optimized techniques to extend the standard deviation LUTs out of the scanned grid have to be implemented to assess if higher performances can be reached.
Most notably, the spatial performances of a module composed of a multi-channel PMT coupled to 4 optically coupled crystals only slightly degrade near optically coupled interfaces as compared to a single monolithic crystal read out by the same photodetector array. Considering results obtained estimating the position with the "Central Overlap" LUT adopting the maximum likelihood method, a loss in spatial resolution of about 0.2 mm was found between the central region of each crystal and the interface region. Degradation of the performances near optically coupled quadrant interfaces is much less than degradation at the external edges of the detector. We thus conclude that adoption of optically coupled crystals for a PET detection system composed of monolithic scintillators can be a useful and feasible method to improve the uniformity of performances in the whole sensitive area and reduce the cost of the scintillator.
ACKNOWLEDGEMENT
This work was supported in part by US National Cancer Institute grant R01CA163498 and by US National Cancer Institute grant R01CA136569.
REFERENCES
- Bruyndonckx P, Leonard S, Tavernier S, Lemaitre C, Devroede O, Wu Y, Krieguer M. Neural network-based position estimators for PET detectors using monolithic LSO blocks. IEEE Transactions on Nuclear Science. 2004;51(5):2520–2525. [Google Scholar]
- Cabello J, Barrillon P, Barrio J, Bisogni MG, Del Guerra A, Lacasta C, Rafecas M, Saikouk H, Solaz C, Solevi P, de La Taille C, Llosá G. High resolution detectors based on continuous crystals and SiPMs for small animal PET. Nuclear Instruments and Methods in Physics Research Section A: Accelerators, Spectrometers, Detectors and Associated Equipment. 2013;718:148–150. [Google Scholar]
- Clinthorne NH, Rogers WL, Shao L, Koral KF. A hybrid maximum likelihood position computer for scintillation cameras. IEEE Trans. Nucl. Sci. 1987;NS-34(1):97–101. [Google Scholar]
- Del Guerra A, Belcari N, Bisogni MG. Positron Emission Tomography: Its 65 years. La Rivista del Nuovo Cimento. 2016;39(4):155–223. [Google Scholar]
- Espana S, Marcinkowski R, Keereman V, Vandenberghe S, Van Holen R. DigiPET: sub-millimeter spatial resolution small-animal PET imaging using thin monolithic scintillators. Physics in Medicine and Biology. 2014;59(13):3405–3420. doi: 10.1088/0031-9155/59/13/3405. [DOI] [PubMed] [Google Scholar]
- Frach T, Prescher G, Degenhardt C, de Gruyter R, Schmitz A, Ballizany R. The digital silicon photomultipliers, principle of operation and intrinsic detector performance. IEEE Nuclear Science Symposium Conference Record (NSS/MIC) 2009:1959–1965. [Google Scholar]
- Gray RM, Macovski A. Maximum a Posteriori Estimation of Position in Scintillation Cameras. IEEE Transactions on Nuclear Science. 1976;23(1):849–852. [Google Scholar]
- Hunter WCJ, Barrett HH, Furenlid LR. Calibration Method for ML Estimation of 3d Interaction Position in a Thick Gamma-Ray Detector. IEEE transactions on nuclear science. 2009;56(1):189–196. doi: 10.1109/TNS.2008.2010704. R. [DOI] [PMC free article] [PubMed] [Google Scholar]
- Joung J, Miyaoka RS, Lewellen TK. cMiCE: a high resolution animal PET using continuous LSO with a statistics based positioning scheme. Nuclear Instruments and Methods in Physics Research Section A: Accelerators, Spectrometers, Detectors and Associated Equipment. 2002;489:584–598. [Google Scholar]
- Lerche CW, Benlloch JM, Sánchez F, Pavón N, Escat B, Gimenez EN, Fernández M, Torres I, Giménez M, Sebastià A, Martínez J. Depth of γ-Ray Interaction Within Continuous Crystals From the Width of Its Scintillation Light-Distribution. IEEE Trans. Nucl. Sci. 2005;52(3):560–572. [Google Scholar]
- Lewellen TK, Miyaoka RS, MacDonald LR, DeWitt D, Hauck S. Evolution of the Design of a Second Generation FireWire Based Data Acquisition System". IEEE Nuclear Science Symposium Conference Record (NSS/MIC) 2010:2510–2514. doi: 10.1109/NSSMIC.2010.5874239. [DOI] [PMC free article] [PubMed] [Google Scholar]
- Li X, Hunter WCJ, Lewellen TK, Miyaoka RS. Use of Cramer-Rao Lower Bound for Performance Evaluation of Different Monolithic Crystal PET Detector Designs. IEEE transactions on nuclear science. 2012;59(1):3–12. doi: 10.1109/TNS.2011.2165968. [DOI] [PMC free article] [PubMed] [Google Scholar]
- Li Z, Wedrowski M, Bruyndonckx P, Vandersteen G. Nonlinear least-squares modeling of 3d interaction position in a monolithic scintillator block. Physics in Medicine and Biology. 2010;55(21):6515–6532. doi: 10.1088/0031-9155/55/21/012. [DOI] [PubMed] [Google Scholar]
- Ling T, Lewellen TK, Miyaoka RS. Depth of interaction decoding of a continuous crystal detector module. Physics in Medicine and Biology. 2007;52(8):2213. doi: 10.1088/0031-9155/52/8/012. [DOI] [PubMed] [Google Scholar]
- Ling T, Lee K, Miyaoka RS. Performance Comparisons of Continuous Miniature Crystal Element (cMiCE) Detectors. IEEE Trans. Nucl. Sci. 2006;53(5):2513–2518. [Google Scholar]
- Ling T, Burnett TH, Lewellen TK, Miyaoka RS. Parametric positioning of a continuous crystal PET detector with depth of interaction decoding. Phys. Med. Biol. 2008;53:1843–1863. doi: 10.1088/0031-9155/53/7/003. [DOI] [PMC free article] [PubMed] [Google Scholar]
- Llosa G, Barrio J, Lacasta C, Bisogni MG, Del Guerra A, Marcatili S, Barrillon P, Bondil-Blin S, de la Taille C, Piemonte C. Characterization of a PET detector head based on continuous LYSO crystals and monolithic, 64-pixel silicon photomultiplier matrices. Physics in Medicine and Biology. 2010;55(23):7299–7315. doi: 10.1088/0031-9155/55/23/008. [DOI] [PubMed] [Google Scholar]
- Lopes MI, Chepel V. Detectors for medical radioisotope imaging: demands and perspectives. Radiation Physics and Chemistry. 2004;71:683–692. [Google Scholar]
- Mendes PR, Martin IS, Canadas M, de Acilu PG, Cuypers R, Perez JM, Willmott C. Characterization and performance of monolithic detector blocks with a dedicated ASIC front-end readout for PET imaging of the human brain. Nucl. Instrum. in Phys. Res. A. 2011;633:S33–5. [Google Scholar]
- Miyaoka RS, Ling T, Lockhart C, Li X, Lewellen TK. Calibration Procedure for a Continuous Miniature Crystal Element (cMiCE) Detector. IEEE Trans. Nucl. Sci. 2010;57(3):1023–1028. doi: 10.1109/NSSMIC.2007.4437070. [DOI] [PMC free article] [PubMed] [Google Scholar]
- Miyaoka RS, Li X, Hunter WCJ, Pierce L, McDougald W, Kinahan PE, Lewellen TK. Resolution Properties of a Prototype Continuous Miniature Crystal Element (cMiCE) Scanner. IEEE Transactions on Nuclear Science. 2011;58(5):2244–2249. doi: 10.1109/TNS.2011.2165296. [DOI] [PMC free article] [PubMed] [Google Scholar]
- Morrocchi M, Ambrosi G, Bisogni MG, Boretto M, Bosi F, Cerello P, Del Guerra A, Ionica M, Liu B, Pennazio F, Piliero MA, Pirrone G, Postolache V, Wheadon R. A four-dimensional photon detector for PET application. JINST. 2016;11(3):C03015. [Google Scholar]
- Seifert S, Van der Lei G, Van Dam HT, Schaart DR. First characterization of a digital SiPM based time-of-flight PET detector with 1 mm spatial resolution. Physics in Medicine and Biology. 2013;58(9):3061–3074. doi: 10.1088/0031-9155/58/9/3061. [DOI] [PubMed] [Google Scholar]
- Staelens S, D’Asseler Y, Vandenberghe S, Koole M, Lemahieu I, Van de Walle R. A three-dimensional theoretical model incorporating spatial detection uncertainty in continuous detector PET. Physics in Medicine and Biology. 2004;49(11):2337–2350. doi: 10.1088/0031-9155/49/11/015. [DOI] [PubMed] [Google Scholar]
- Van Dam HT, Seifert S, Vinke R, Dendooven P, Lohner H, Beekman FJ, Schaart DR. Improved Nearest Neighbor Methods for Gamma Photon Interaction Position Determination in Monolithic Scintillator PET Detectors. IEEE Transactions on Nuclear Science. 2011;58(5):2139–2147. [Google Scholar]
- Vinke R, Levin CS. A method to achieve spatial linearity and uniform resolution at the edges of monolithic scintillation crystal detectors. Physics in Medicine and Biology. 2014;59(12):2975–2995. doi: 10.1088/0031-9155/59/12/2975. [DOI] [PubMed] [Google Scholar]


