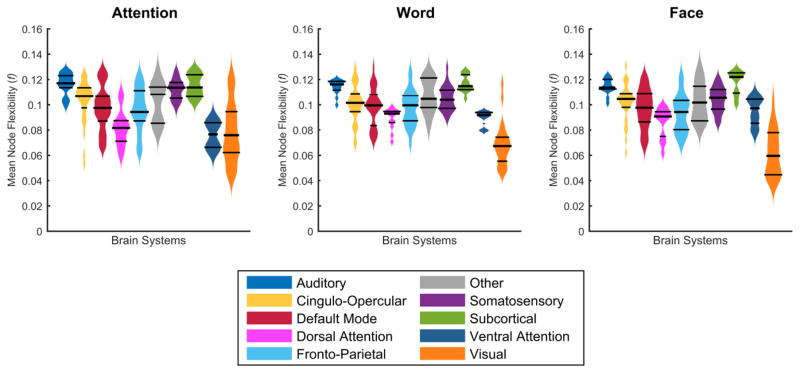
Figure 4. Node flexibility by brain system at window size 75 s.
Node flexibility across the group was averaged for each brain system for the attention, word and face task. The distribution of flexibility is expressed as bean plots, with the middle bar representing the median, and the outside bars representing the interquartile range.

