Abstract
Background
To figure out the relationship between image noise and contrast noise ratio (CNR) at different tube voltages, using anthropomorphic new-born and 1-year-old phantoms, and to discuss the feasibility of radiation dose reduction, based on the obtained CNR index from image noise. We performed helical scans of the anthropomorphic new-born and 1-year-old phantoms. The CT numbers of the simulated aorta and image noise of the simulated mediastinum were measured; then CNR was calculated on 80, 100, and 120-kVp images reconstructed with filtered back projection (FBP) and iterative reconstruction (IR). We also measured the center and surface dose in the case of CNR of 14 using radio-photoluminescence glass dosimeters.
Results
The CT number of the simulated aorta was increased with decreasing tube voltage from 120 to 80 kVp (362.5–535.1 HU for the new-born, 358.9–532.6 HU for the 1-year-old). At CNR of 14, the center dose was 0.4, 0.6 and 0.9 mGy at FBP and 0.5, 0.6 and 0.9 mGy at IR and with the new-born phantom acquired at 80, 100 and 120 kVp, respectively. The center dose for FBP image was reduced by 56% at 80 kVp, 34% at 100 kVp for the new-born and 36% at 80 kVp, 22% at 100 kVp for the 1-year-old compared with that at 120 kVp. We obtained a relationship between image noise and CNR at different tube voltages using the anthropomorphic new-born and 1-year-old phantoms.
Conclusion
The use of index of CNR with low-tube voltage may achieve further radiation dose reduction in pediatric CT examination.
Keywords: Contrast-to-noise-ratio (CNR), Low-tube voltage, Radiation dose, Image noise
Background
Pediatric CT examination plays an important role in establishing the diagnosis, interventional management for pediatric patients. However, the most serious drawback of CT is radiation exposure which links to an increased risk of cancer (Preston et al. 2007, 2012; Miglioretti et al. 2013; Mathews et al. 2013). Children are especially more susceptible to radiation effects than adults; therefore, minimization of the radiation dose is the critical issue in pediatric CT examinations (Brenner et al. 2001).
To reduce radiation dose for pediatric patients, automatic tube current modulation (ATCM) or combination of ATCM and automatic tube voltage selection (ATVS) are an available option for modern CT scanners (Lee et al. 2012; Mayer et al. 2014). As iodinated contrast material is frequently used at pediatric cardiac CT examination, we think that the combined ATVS and ATCM technique is more useful than single use of ATCM because iodine enhancement is improved at low-tube voltage scan. In the combined ATVS and ATCM technique, contrast-to-noise ratio (CNR) is adequate as an image quality index instead of image noise [standard deviation (SD) of the CT number] because identification or characterization of lesions depends on balance between image noise and contrast.
Currently, ATVS has not become popular while most CT scanners are equipped with ATCM. ATCM controls tube current only according to preset image noise irrespective of CNR. Even if the CT scanner is not equipped with ATVS, if we can identify the relationship between image noise and CNR at different tube voltages, we can utilize CNR index by converting image noise value to CNR value.
The purpose of our study was to figure out the relationship between image noise and CNR at different tube voltages using the anthropomorphic new born and 1-year-old phantoms at pediatric CT examinations and then to discuss the feasibility of radiation reduction based on the CNR index and low-tube voltage.
Methods
Phantoms
We used two pediatric anthropomorphic phantoms (ATOM Phantom, CIRS, Norfolk, Virginia, USA) that represent the average individual as new born and 1-year-old child in the study (Fig. 1). Assumed body weight (BW) and body height (BH) for the new-born and 1-year-old phantoms are 3.5 kg and 51 cm and 10 kg and 75 cm, respectively. The phantoms were made of radiologically sensitive tissue-equivalent material and internally artificial skeletons, lungs, and soft tissue formulated for accurate simulation of medical exposures.
Fig. 1.
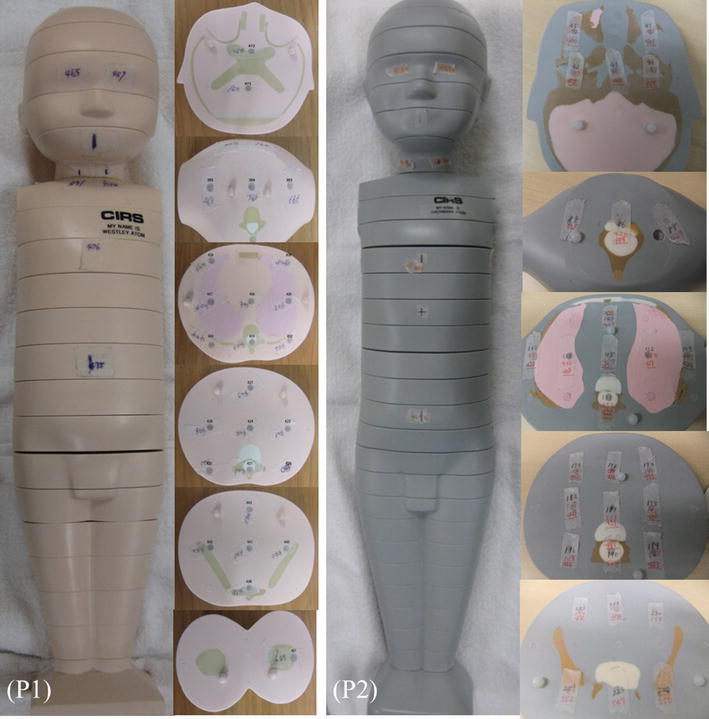
Anthropomorphic new-born (left) and 1-year-old (right) phantoms
The phantoms contained a central tunnel of 5.0 mm in diameter for simulation of the blood-filled aorta (Fig. 2). We filled the simulated aortic lumen with diluted iodinated contrast material (CM) (Omnipaque-300; Daiichi-Sankyo, Tokyo, Japan) and adjusted the CT number with the 1-year-old phantom to 350–370 HU at 120 kVp based on our clinical experience; applied the same diluted iodinated CM to the new-born phantom (Fig. 2).
Fig. 2.
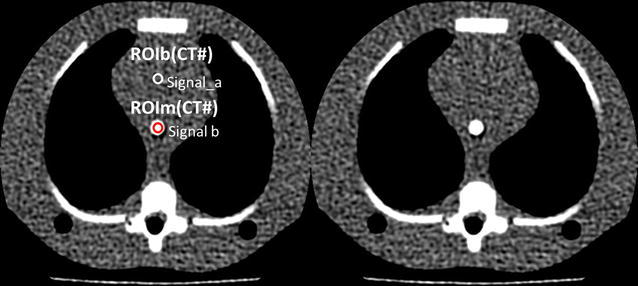
CT number of the simulated aortic (Signal_a) and the mediastinum portions (Signal_b) were measured within 10-pixel-diameter circular region of interest (ROI) in the each phantom
CT scanning
All CT scans were performed on a 64-detector row CT scanner (Lightspeed VCT; GE Healthcare, Milwaukee, Wisconsin) including entire chest of the pediatric anthropomorphic phantom. The scanning parameters were as follows: scan mode, helical scan; section thickness, 0.625 mm; pitch factor, 1.375; gantry rotation time, 0.4 s; detector collimation, 64 × 0.625 mm; scan field of view, 100 mm for new-born phantom and 150 mm for 1-year-old phantom; matrix size, 512 × 512; and reconstruction kernel (standard; GE Healthcare). It is generally acknowledged that faster scanning speed and high pitch factor are necessary to obtain the pediatric CT images without motion artifact (Lell et al. 2011; Long et al. 2015).
The applied tube-voltages were 80, 100, and 120 kVp and tube current was set from 10 to 150 mA on a 10 mA step in two phantoms, respectively. CT images were acquired with filtered back projection (FBP) and iterative reconstruction (IR, blending of 30% of ASIR with FBP) algorithms under the standard kernel/filter.
CT number and image noise measurement
We measured the CT number (HU) and image noise in the aortic (CT#a) and mediastinum portions (CT#m) of the phantoms using a circular region of interest (ROI; Fig. 2). The diameters of the circular ROIs acquired at the simulated aortic and mediastinum portions were all 4.0 mm. We acquired 100 consecutive images in the z direction at each scan, performed 3 scans, and then calculated mean values for all the phantoms. In our study, the contrast for calculation of CNR was defined as the value of aortic CT number in the images of 80, 100, and 120-kVp in each phantom and CNR was calculated from CT number of the simulated aorta divided by image noise (aortic CT number/image noise) at the simulated mediastinum portion. Finally we obtained the relationship between image noise, CNR and tube current and then also obtained the relationship between image noise and CNR. We calculated the image noise during optimal CNR using lower tube voltage at clinical practice.
Dose measurements
We performed helical scans for calculating tube current at 80, 100 and 120 kVp during CNR of 14 using new-born and 1 year-old phantoms. We measured the surface and center doses in the new-born and 1-year-old phantoms. The radio-photoluminescence glass dosimeters (RPLGD) GD-352M with a tin filter (Dose Ace, glass dosimeter; Asahi Techno Glass, Shizuoka, Japan) were inserted at the positions of the phantom center and front, back, left, and right side of the phantom surface. We performed 3 scans from the upper end of the apex to the lower region of the diaphragm in the pediatric cardiac CT scan. The FDG-1000 reader (ATGC-2004; Asahi Techno Glass) were used for dose measurements.
Results
Aortic CT number
The aortic CT numbers with FBP and IR increased for new born from 363 to 535 HU with FBP and from 362 to 534 HU with IR from 120 to 80 kVp. And for 1 year old they increased from 359 to 532 HU with FBP and from 361 to 533 HU with IR for 120–80 kVp on scans of pediatric anthropomorphic phantoms (Table 1). The iodinated contrast improvement acquired at 80 and 100 kVp was approximately 1.5 and 1.2 times higher than the value of 120 kVp irrespective of the pediatric phantom size and reconstruction algorithm of FBP or IR.
Table 1.
Aortic CT numbers for anthropomorphic pediatric phantoms acquired at 80, 100, and 120 kVp
| Tube voltage (kVp) | CT number of aorta (HU) | CT number of mediastinum (HU) | ||
|---|---|---|---|---|
| New born | 1 year old | New born | 1 year old | |
| FBP | ||||
| 80 | 535 (519–541) | 531 (525–535) | 13 (11–14) | 22 (20–25) |
| 100 | 443 (435–451) | 438 (425–440) | 14 (11–15) | 27 (24–31) |
| 120 | 363 (358–367) | 358 (357–360) | 16 (12–17) | 30 (28–33) |
| IR | ||||
| 80 | 533 (522–543) | 532 (528–539) | 12 (10–13) | 21 (19–23) |
| 100 | 433 (428–438) | 430 (423–436) | 13 (11–14) | 26 (24–30) |
| 120 | 362 (359–365) | 362 (359–363) | 15 (13–16) | 29 (27–32) |
Variation of image noise and CNR
The variation for image noise or CNR with increasing tube current on new-born and 1-year-old phantoms was shown in Figs. 3 and 4. The variation curve for image noise entirely shifted higher image noise at 80 kVp compared with other tube-voltages at 100 and 120 kVp (Fig. 3). The variation curve for CNR was calculated from aortic CT number (Table 1) and image noise at different tube currents (Fig. 3). The relationship between CNR and image noise at different tube voltages was shown in Fig. 5. At CNR of 13, 14, and 15 with FBP and IR, image noise value acquired at 80 and 100 kVp was shown in Table 2 (also see Fig. 5). With increasing CNR from 13 to 15, image noise decreased approximately 6 HU at 80 kVp and 4 HU at 100 kVp.
Fig. 3.
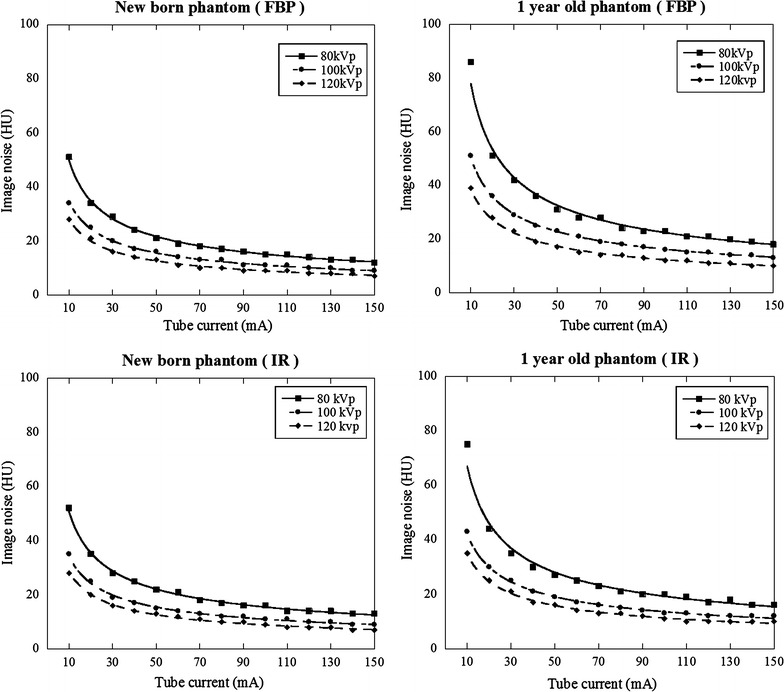
Image nose (SD of CT number) variations with varying tube current: new-born and 1-year-old phantoms
Fig. 4.
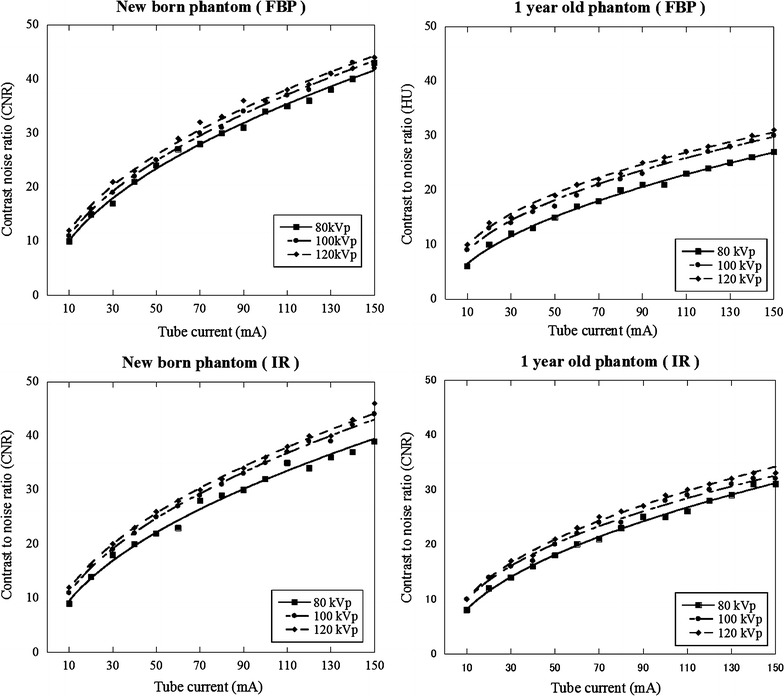
Variations of contrast-to-noise ratio (CNR) with varying tube current: new-born and 1 year-old phantoms
Fig. 5.
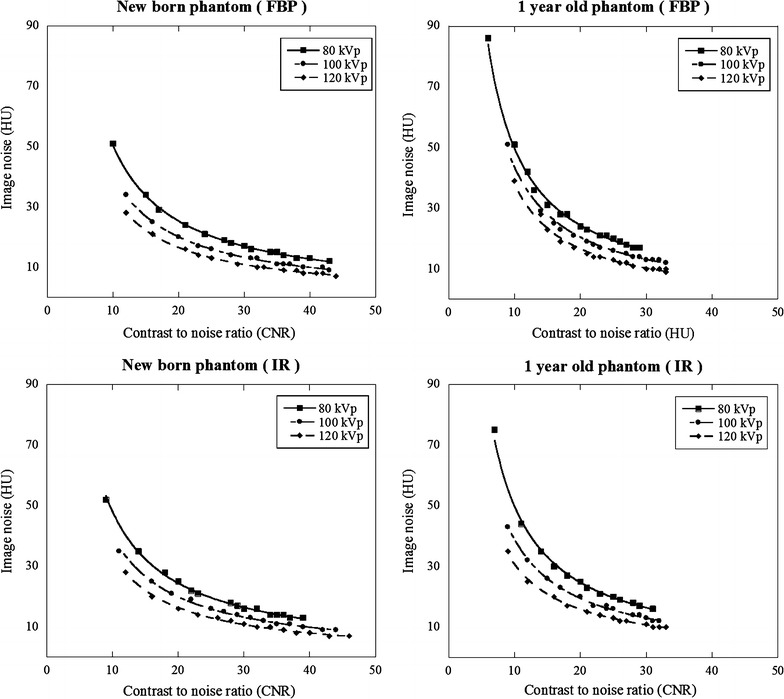
Relationship between image noise and contrast-to-noise ratio (CNR) at different tube voltage: new-born and 1-year-old phantoms
Table 2.
The image noise with low tube voltage for CNR at 13, 14, and 15
| Tube voltage (kVp) | CNR | ||
|---|---|---|---|
| 13 | 14 | 15 | |
| New born | |||
| FBP | |||
| 80 | 39 | 37 | 33 |
| 100 | 32 | 30 | 26 |
| IR | |||
| 80 | 39 | 37 | 34 |
| 100 | 31 | 30 | 27 |
| 1 year old | |||
| FBP | |||
| 80 | 37 | 35 | 31 |
| 100 | 30 | 29 | 26 |
| IR | |||
| 80 | 39 | 37 | 33 |
| 100 | 32 | 30 | 28 |
Radiation dose
At CNR of 14, the tube current, image noise, surface, and center doses are listed in Table 3 (also see Figs. 3, 4, 5). The center dose was 0.4, 0.6 and 0.9 mGy with FBP and 0.5, 0.6 and 0.9 mGy with IR for new-born phantom and 0.9, 1.1 and 1.4 mGy with FBP and 0.7, 1.0 and 1.2 mGy with IR for 1-year-old phantom at 80, 100, and 120 kVp respectively. The center dose for FBP image was reduced by 56% at 80 kVp, 34% at 100 kVp for new born and 36% at 80 kVp, 22% at 100 kVp for 1 year old compared with the that at 120 kVp. The surface dose for FBP image was reduced by 33% at 80 kVp, 33% at 100 kVp for new born and 27% at 80 kVp, 13% at 100 kVp for 1 year old compared with the that at 120 kVp.
Table 3.
Image noise and radiation dose at different tube voltages in the case of CNR at 14
| Tube voltage (kVp) | Tube current (mA) | Surface dose (mGy) | Center dose (mGy) | Measurd image noise (HU) |
|---|---|---|---|---|
| New born | ||||
| FBP | ||||
| 80 | 20 | 0.6 | 0.4 | 37 |
| 100 | 15 | 0.6 | 0.6 | 30 |
| 120 | 15 | 0.9 | 0.9 | 25 |
| IR | ||||
| 80 | 20 | 0.6 | 0.5 | 37 |
| 100 | 15 | 0.7 | 0.6 | 30 |
| 120 | 15 | 0.9 | 0.9 | 25 |
| 1 year old | ||||
| FBP | ||||
| 80 | 45 | 1.1 | 0.9 | 35 |
| 100 | 30 | 1.3 | 1.1 | 29 |
| 120 | 25 | 1.5 | 1.5 | 25 |
| IR | ||||
| 80 | 40 | 0.9 | 0.7 | 37 |
| 100 | 25 | 1.1 | 1.0 | 30 |
| 120 | 20 | 1.4 | 1.2 | 25 |
Figure 6 shows 1-year-old phantom images with FBP and IR at CNR of 14. The FBP and IR images acquired at 80- and 100 kVp were the same detectability as that at 120 kVp.
Fig. 6.
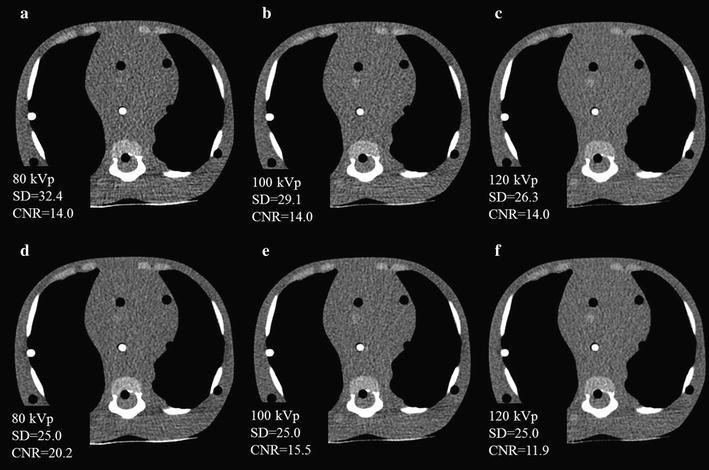
Anthropomorphic pediatric phantom image acquired for 1 year old at 80 (a), 100 (b) and 120 kVp (c) with CNR of 14, and at 80 (d), 100 (e) and 120 kVp (f) with image noise of 25 HU at IR
Discussion
We obtained a relationship between image noise and CNR and evaluated the radiation dose using the index of CNR at different tube voltages on anthropomorphic new born and 1-year-old phantoms. At low-tube-voltage, the center dose based on the index of CNR was lower than that with the index of image noise at new born (e.g. 0.4 vs. 0.9 mGy with FBP and, 0.5 vs. 0.9 mGy with IR at 80 kVp) and 1-year-old phantoms (e.g. 0.9 vs. 1.5 mGy with FBP and 0.7 vs. 1.2 mGy with IR at 80 kVp) due to effect of increasing iodine contrast. The center dose for FBP image was reduced by 56% at 80 kVp, 34% at 100 kVp for new born and 36% at 80 kVp, 22% at 100 kVp for 1 year old compared with the that at 120 kVp.
When the index of CNR is applied, appropriate CT number is necessary to improve the vessel contrast (Boone et al. 2003; Siegel et al. 2004; Funama et al. 2005). Fei et al. (2008) reported that the best aortic CT number for cardiac examinations was over 350 HU at 120 kVp for maintaining image quality. Considering the reported data and our clinical experience, our study set the iodine contrast so that to 350 HU at 120 kVp. In the case of low-tube-voltage, the value increases 1.5 times at 80 kVp and 1.2 times at 100 kVp, respectively than the value of 120 kVp. To predict aortic CT number, past CT images with follow-up examination may be utilized if the same injection method is employed. In addition, the use of test bolus scan with diluted contrast medium may be useful (Masuda et al. 2014). Because, a strong correlation was found between aortic CT numbers on images obtained with a test bolus using diluted contrast material and subsequently acquired coronary CTA images.
When we use automatic tube current modulation for calculation of CNR, it is important to set the optimal noise index to avoid image quality degradation using ATCM. Considering the reported data and our clinical experience, image noise is approximately 25–30 HU achieved at 120 kVp (Layritz et al. 2013). Therefore, we set the image noise of 25 HU at 120 kVp and corresponding CNR was 14 (350/25). In clinical situation, we think the value of CNR ranged 12–16 is considered to be an adequate CNR. When low-tube-voltage is applied, the setting of the noise index must take into account the image contrast and noise. From our study, if we obtain the image of CNR at 14 and 80 kVp, setting image noise is 37 HU with FBP and IR for new born, 35 HU with FBP and 37 HU with IR for 1-year old (see Table 2). In addition, in the case of different contrast value, image noise needs to multiply the factor of increasing or decreasing contrast ratio from the Fig. 5. For instance, expected contrast and CNR are 400 HU and 14 with FBP for 1 year old, image noise calculates as 35 × 400/350 = 40 HU. Visibility of structure in the images for new-born and 1-year-old phantoms was comparable to the image acquired with 120 kVp. We think this is due to small body size and not pronounced the image noise texture. In addition, despite of real human, simple configuration of the phantom may help the visibility of structure. We need to determine upper limit of the image noise without sacrificing image quality in clinical situation even though CNR is maintained.
Many researchers have studied the low-tube-voltage technique (Dong et al. 2012; Yu et al. 2011; Kim and Newman 2010; Reid et al. 2010). some of them reported ATVS technique which automatically controls both tube voltage and tube current (Ghoshhajra et al. 2013; Funama et al. 2013; Durand et al. 2014). Funama et al. (2013) reported that ROC analysis-based CNR for lesion detection, CNR-based AEC potentially provide image quality advantages for clinical implementation. Also, Krazinski et al. (2014) reported that automated tube voltage selection can operator-independently optimize cardiovascular CTA image acquisition parameters with improved image quality at reduced dose. When maintaining CNR with low-tube-voltage technique, higher iodine contrast leads to increasing image noise and regulates increase of excessive tube current. In contrast, low-tube-voltage technique increases tube current for keeping image noise level without consideration of higher iodine contrast compared with the tube current at 120 kVp. To control the increasing tube current, IR is promising method. Iterative reconstruction is advanced developments that show the potential to improve image quality, primarily by reducing image noise, despite low-dose CT protocols (Moscariello et al. 2011; Winklehner et al. 2011; Marin et al. 2010). In addition, ATCM is also the necessary tool to control an optimal tube voltage selection.
Our study has several limitations. First, we evaluated image quality only for pediatric patients using an anthropomorphic phantom but not on real pediatric patients. The influence of cardiac and respiratory motion or stair-step artifacts on the image quality was not taken into consideration. Second, we evaluated new-born and 1-years old phantoms for focusing of CHD in pediatric patients. With increasing age, the results might be varied due to increasing body size. Third, we only used a small scan field of view and corresponding small bowtie filter. Toth (2002) showed that variations in dose and image quality changes are higher with a small bowtie filter than a medium or large bowtie filter and we performed the study using a single model of CT scanner from a single vendor. The relation between tube voltage, image noise, radiation dose, reconstruction kernel, slice thickness, tube filtration, detector system, and phantom size may depend to some degree on CT scan specifications and vary among scanners.
Conclusion
In conclusion, we obtained relationship between image noise and CNR at different tube voltages using the anthropomorphic new born and 1-year-old phantoms at pediatric CT examinations. The use of CNR index with low-tube voltage may achieve further radiation dose reduction in pediatric CT.
Authors’ contributions
TM carried out the treatment plans, literature search, data acquisition manuscript preparation and manuscript writing. MK carried out the data acquisition manuscript preparation. TO carried out the data acquisition manuscript preparation. YF carried out the manuscript editing and manuscript review. KA carried out the manuscript editing and manuscript review. All authors read and approved the final manuscript.
Competing interests
The authors declare that they have no competing interests.
Contributor Information
Takanori Masuda, Phone: +81-82-243-9191, Email: takanorimasuda@yahoo.co.jp.
Yoshinori Funama, Email: funama@kumamoto-u.ac.jp.
Masao Kiguchi, Email: kiguchi@hiroshima-u.ac.jp.
Naoyuki Imada, Email: n_imada_2008@yahoo.co.jp.
Takayuki Oku, Email: pixy241724@yahoo.co.jp.
Tomoyasu Sato, Email: tomoyasu_satou@yahoo.co.jp.
Kazuo Awai, Email: awai@hiroshima-u.ac.jp.
References
- Boone JM, Geraghty EM, Seibert JA, Wootton-Gorges SL. Dose reduction in pediatric CT: a rational approach. Radiology. 2003;228:352–360. doi: 10.1148/radiol.2282020471. [DOI] [PubMed] [Google Scholar]
- Brenner D, Elliston C, Hall E, Berdon W. Estimated risks of radiation-induced fatal cancer from pediatric CT. AJR. 2001;176:289–296. doi: 10.2214/ajr.176.2.1760289. [DOI] [PubMed] [Google Scholar]
- Dong F, Davros W, Pozzuto J, Reid J. Optimization of kilovoltage and tube current-exposure time product based on abdominal circumference: an oval phantom study for pediatric abdominal CT. AJR. 2012;199:670–676. doi: 10.2214/AJR.10.6153. [DOI] [PubMed] [Google Scholar]
- Durand S, Paul J-F, et al. Comparison of image quality between 70 kVp and 80 kVp: application to paediatric cardiac CT. Eur Radiol. 2014;24(12):3003–3009. doi: 10.1007/s00330-014-3341-4. [DOI] [PubMed] [Google Scholar]
- Fei X, Du X, Yang Q, Shen Y, Li P, Liao J, et al. 64-MDCT coronary angiography: phantom study of effects of vascular attenuation on detection of coronary stenosis. AJR. 2008;191:43–49. doi: 10.2214/AJR.07.2653. [DOI] [PubMed] [Google Scholar]
- Funama Y, Awai K, Nakayama Y, Kakei K, Nagasue N, Shimamura M, et al. Radiation dose reduction without degradation of low-contrast detectability at abdominal multisection CT with a low-tube voltage technique: phantom study. Radiology. 2005;237:905–910. doi: 10.1148/radiol.2373041643. [DOI] [PubMed] [Google Scholar]
- Funama Y, Sugaya Y, Miyazaki O, Utsunomiya D, Yamashita Y, Awai K. Automatic exposure control at MDCT based on the contrast-to-noise ratio: theoretical background and phantom study. Phys Med. 2013;29:39–47. doi: 10.1016/j.ejmp.2011.11.004. [DOI] [PubMed] [Google Scholar]
- Ghoshhajra BB, Engel LC, Karolyi M, Sidhu MS, Wai B, Barreto M, et al. Cardiac computed tomography angiography with automatic tube potential selection: effects on radiation dose and image quality. J Thorac Imaging. 2013;28:40–48. doi: 10.1097/RTI.0b013e3182631e8a. [DOI] [PubMed] [Google Scholar]
- Kim JE, Newman B. Evaluation of a radiation dose reduction strategy for pediatric chest CT. AJR. 2010;194:1188–1193. doi: 10.2214/AJR.09.3726. [DOI] [PubMed] [Google Scholar]
- Krazinski AW, Meinel FG, Schoepf UJ, Silverman JR, Canstein C, De Cecco CN, et al. Reduced radiation dose and improved image quality at cardiovascular CT angiography by automated attenuation-based tube voltage selection: intra-individual comparison. Eur Radiol. 2014;24:2677–2684. doi: 10.1007/s00330-014-3312-9. [DOI] [PubMed] [Google Scholar]
- Layritz C, Muschiol G, Flohr T, Bietau C, Marwan M, Schuhbaeck A, et al. Automated attenuation-based selection of tube voltage and tube current for coronary CT angiography: reduction of radiation exposure versus a BMI-based strategy with an expert investigator. J Cardiovasc Comput Tomogr. 2013;7:303–310. doi: 10.1016/j.jcct.2013.08.010. [DOI] [PubMed] [Google Scholar]
- Lee KH, Lee JM, Moon SK, Baek JH, Park JH, Flohr TG, et al. Attenuation-based automatic tube voltage selection and tube current modulation for dose reduction at contrast-enhanced liver CT. Radiology. 2012;265:437–447. doi: 10.1148/radiol.12112434. [DOI] [PubMed] [Google Scholar]
- Lell MM, May M, Deak P, Alibek S, Kuefner M, Kuettner A, et al. High-pitch spiral computed tomography: effect on image quality and radiation dose in pediatric chest computed tomography. Invest Radiol. 2011;46:116–123. doi: 10.1097/RLI.0b013e3181f33b1d. [DOI] [PubMed] [Google Scholar]
- Long CM, Long SS, Johnson PT, Mahesh M, Fishman EK, Zimmerman SL. Utility of low-dose high-pitch scanning for pediatric cardiac computed tomographic imaging. J Thorac Imaging. 2015;27:27. doi: 10.1097/RTI.0000000000000131. [DOI] [PubMed] [Google Scholar]
- Marin D, Nelson RC, Schindera ST, Richard S, Youngblood RS, Yoshizumi TT, et al. Low-tube-voltage, high-tube-current multidetector abdominal CT: improved image quality and decreased radiation dose with adaptive statistical iterative reconstruction algorithm–initial clinical experience. Radiology. 2010;254:145–153. doi: 10.1148/radiol.09090094. [DOI] [PubMed] [Google Scholar]
- Masuda T, Funama Y, Imada N, Sato T, Yamagami T, Tatsugami F, et al. Prediction of aortic enhancement on coronary CTA images using a test bolus of diluted contrast material. Acad Radiol. 2014;21:1542–1546. doi: 10.1016/j.acra.2014.07.002. [DOI] [PubMed] [Google Scholar]
- Mathews JD, Forsythe AV, Brady Z, Butler MW, Goergen SK, Byrnes GB, Giles GG, Wallace AB, Anderson PR, Guiver TA, McGale P, Cain TM, Dowty JG, Bickerstaffe AC, Darby SC (2013) Cancer risk in 680,000 people exposed to computed tomography scans in childhood or adolescence: data linkage study of 11 million Australians. BMJ 346:f2360. doi:10.1136/bmj.f2360 [DOI] [PMC free article] [PubMed]
- Mayer C, Meyer M, Fink C, Schmidt B, Sedlmair M, Schoenberg SO, et al. Potential for radiation dose savings in abdominal and chest CT using automatic tube voltage selection in combination with automatic tube current modulation. AJR. 2014;203:292–299. doi: 10.2214/AJR.13.11628. [DOI] [PubMed] [Google Scholar]
- Miglioretti DL, Johnson E, Williams A, Greenlee RT, Weinmann S, Solberg LI, et al. The use of computed tomography in pediatrics and the associated radiation exposure and estimated cancer risk. JAMA Pediatr. 2013;167:700–707. doi: 10.1001/jamapediatrics.2013.311. [DOI] [PMC free article] [PubMed] [Google Scholar]
- Moscariello A, Takx RA, Schoepf UJ, Renker M, Zwerner PL, O’Brien TX, et al. Coronary CT angiography: image quality, diagnostic accuracy, and potential for radiation dose reduction using a novel iterative image reconstruction technique-comparison with traditional filtered back projection. Eur Radiol. 2011;21:2130–2138. doi: 10.1007/s00330-011-2164-9. [DOI] [PubMed] [Google Scholar]
- Pearce MS, Salotti JA, Little MP, McHugh K, Lee C, Kim KP, et al. Radiation exposure from CT scans in childhood and subsequent risk of leukaemia and brain tumours: a retrospective cohort study. Lancet. 2012;380:499–505. doi: 10.1016/S0140-6736(12)60815-0. [DOI] [PMC free article] [PubMed] [Google Scholar]
- Preston DL, Ron E, Tokuoka S, Funamoto S, Nishi N, Soda M, et al. Solid cancer incidence in atomic bomb survivors: 1958–1998. Radiat Res. 2007;168:1–64. doi: 10.1667/RR0763.1. [DOI] [PubMed] [Google Scholar]
- Reid J, Gamberoni J, Dong F, Davros W. Optimization of kVp and mAs for pediatric low-dose simulated abdominal CT: Is it best to base parameter selection on object circumference? AJR. 2010;195:1015–1020. doi: 10.2214/AJR.09.3862. [DOI] [PubMed] [Google Scholar]
- Siegel MJ, Schmidt B, Bradley D, Suess C, Hildebolt C. Radiation dose and image quality in pediatric CT: effect of technical factors and phantom size and shape. Radiology. 2004;233:515–522. doi: 10.1148/radiol.2332032107. [DOI] [PubMed] [Google Scholar]
- Toth TL. Dose reduction opportunities for CT scanners. Pediatr Radiol. 2002;32:261–267. doi: 10.1007/s00247-002-0678-7. [DOI] [PubMed] [Google Scholar]
- Winklehner A, Karlo C, Puippe G, Schmidt B, Flohr T, Goetti R, et al. Raw data-based iterative reconstruction in body CTA: evaluation of radiation dose saving potential. Eur Radiol. 2011;21:2521–2526. doi: 10.1007/s00330-011-2227-y. [DOI] [PubMed] [Google Scholar]
- Yu L, Bruesewitz MR, Thomas KB, Fletcher JG, Kofler JM, McCollough CH. Optimal tube potential for radiation dose reduction in pediatric CT: principles, clinical implementations, and pitfalls. Radiographics. 2011;31:835–848. doi: 10.1148/rg.313105079. [DOI] [PubMed] [Google Scholar]


