This work revealed that β2-noradrenergic receptor activation increases the frequency and strength of external tufted (ET) cell rhythmic bursting by augmenting INaP and Ih, two key currents involved in burst initiation and frequency in these cells. The increase in ET excitability by β2-receptor activation may better enable ET cell rhythmic bursting, and hence glomerular network activity, to pace faster sniff rates during heightened norepinephrine release associated with arousal.
Keywords: bursting, external tufted cells, hyperpolarization-activated cation current, isoproterenol, persistent sodium current
Abstract
The main olfactory bulb (MOB) receives a rich noradrenergic innervation from the nucleus locus coeruleus. Despite the well-documented role of norepinephrine and β-adrenergic receptors in neonatal odor preference learning, identified cellular physiological actions of β-receptors in the MOB have remained elusive. β-Receptors are expressed at relatively high levels in the MOB glomeruli, the location of external tufted (ET) cells that exert an excitatory drive on mitral and other cell types. The present study investigated the effects of β-receptor activation on the excitability of ET cells with patch-clamp electrophysiology in mature mouse MOB slices. Isoproterenol and selective β2-, but not β1-, receptor agonists were found to enhance two key intrinsic currents involved in ET burst initiation: persistent sodium (INaP) and hyperpolarization-activated inward (Ih) currents. Together, the positive modulation of these currents increased the frequency and strength of ET cell rhythmic bursting. Rodent sniff frequency and locus coeruleus neuronal firing increase in response to novel stimuli or environments. The increase in ET excitability by β-receptor activation may better enable ET cell rhythmic bursting, and hence glomerular network activity, to pace faster sniff rates during heightened norepinephrine release associated with arousal.
NEW & NOTEWORTHY
This work revealed that β2-noradrenergic receptor activation increases the frequency and strength of external tufted (ET) cell rhythmic bursting by augmenting INaP and Ih, two key currents involved in burst initiation and frequency in these cells. The increase in ET excitability by β2-receptor activation may better enable ET cell rhythmic bursting, and hence glomerular network activity, to pace faster sniff rates during heightened norepinephrine release associated with arousal.
noradrenergic input to the main olfactory bulb (MOB) from the pontine nucleus locus coeruleus plays key roles in odor learning, recognition, and recall (reviewed in Linster et al. 2011). In neonatal rodents, norepinephrine (NE) release and β-noradrenergic receptor activation in the MOB play a pivotal role in associative odor learning (Sullivan et al. 2000; Sullivan and Wilson 2003; Zhang et al. 2010). In mature rodents, NE release, acting primarily at α-receptors, enhances olfactory detection and discrimination especially to weak odor concentrations (Doucette et al. 2007; Escanilla et al. 2012; Mandairon et al. 2008).
Electrophysiological studies have identified potential cellular and circuit actions of NE in the MOB consistent with noradrenergic modulation of olfactory function observed in behavioral studies. In neonates, β-receptor activation facilitates the induction of long-term potentiation at olfactory nerve synapses and also at mitral-to-granule cell synapses (Yuan 2009; Zhang et al. 2010). In neonatal but not mature rodents, β-receptor activation increases GABA-mediated inhibition of mitral cells (Zimnik et al. 2013). By contrast, in postweanling rodents, there appears to be a developmental shift such that α-receptors are more influential. Thus direct α1-receptor-mediated increases in mitral cell excitability and responses to weak olfactory nerve input (Ciombor et al. 1999; Hayar et al. 2001; Jiang et al. 1996;) are compatible with the α1-receptor-mediated enhancement of weak odor detection behaviorally. Similarly, enhancement of granule cell-mediated inhibition of mitral cells by α1-receptors is consistent with improved odor discrimination observed behaviorally (Linster et al. 2011; Nai et al. 2009, 2010; Pandipati and Schoppa 2012; Smith et al. 2009; Zimnik et al. 2013).
Distinct cellular physiological actions of β-receptors in mature animals have remained elusive. Although β-receptor modulation of field potential activity in the MOB has been reported (Okutani et al. 1998), the specific neuronal target of β-receptors was not identified. β-Receptor agonists induce large spontaneous glutamatergic excitatory postsynaptic currents (EPSCs) in mitral cells via an indirect presynaptic, action potential-dependent action (Hayar et al. 2001). These EPSCs are similar to long-lasting depolarizations in mitral cells that originate in the glomerular layer and are generated, at least in part, by external tufted (ET) cells (Carlson et al. 2000; De Saint Jan et al. 2009; Gire et al. 2012; Gire and Schoppa 2009). In this regard, it is noteworthy that the density of β-receptor binding sites and cellular mRNA expression are especially high in the glomeruli (Nicholas et al. 1993; Woo and Leon 1995a, 1995b). Although NE fibers are sparse in the glomeruli, the fibers are concentrated in the deep portion of the glomeruli where ET somata are located (McLean et al. 1989). Additionally, neurochemical studies indicate that the NE concentration in the glomerular layer is similar to that in the deeper layers (Mesfioui et al. 1998; Nadi et al. 1981).
The goal of the present study was to investigate the effects of β-receptor activation on the activity of ET cells. Electrophysiological studies in mouse olfactory bulb revealed that β-receptor agonists uniformly increase ET cell excitability by enhancing persistent sodium (INaP) and hyperpolarization-activated inward (Ih) currents underlying rhythmic bursting. Together, these effects increase the frequency and strength of ET cell rhythmic bursting.
MATERIALS AND METHODS
Slice preparation.
C57BL/6J mice of either sex (25–35 days old) were deeply anesthetized by isoflurane inhalation and decapitated in accordance with National Institutes of Health guidelines for research animal care and protocols approved by the Institutional Animal Care and Use Committee of the University of Tennessee Health Science Center. The olfactory bulbs were removed and placed in ice-cold sucrose-artificial cerebrospinal fluid (ACSF) containing (in mM) 120 sucrose, 62 NaCl, 26 NaHCO3, 1.25 NaH2PO4, 3 KCl, 4 MgSO4, 0.1 CaCl2, and 15 glucose (pH 7.4, ∼310–315 mosM, oxygenated with 95% O2-5% CO2). Horizontal slices (400-μm thickness) were cut with a vibratome (Leica VT1200S; Leica Microsystems, Wetzlar, Germany). After recovery at 33°C for 15 min, slices were transferred to normal ACSF at room temperature (∼23°C) and incubated for at least 1 h before recording. The normal ACSF contained (in mM) 126 NaCl, 26 NaHCO3, 3 KCl, 1.25 NaH2PO4, 2 MgCl2, 2 CaCl2, and 15 glucose (pH 7.3, ∼305–310 mosM, oxygenated with 95% O2-5% CO2). For voltage-clamp studies of INaP and Ih, the modified ACSF contained (in mM) 151.2 NaCl, 3 KCl, 2 MgCl2, 2 CaCl2, 15 glucose, 10 tetraethylammonium chloride (TEA), 0.2 CdCl2, 1 NiCl2, and 10 HEPES with ZD7288 (100 μM for INaP experiments) or TTX (1 μM for Ih experiments) (pH 7.4, ∼305–310 mosM). CdCl2 and NiCl2 were added to block Ca2+ currents and TEA to block K+ currents. In all experiments, dl-2-amino-5-phosphonovaleric acid (APV, 50 μM), 6-cyano-7-nitroquinoxaline-2,3-dione (CNQX, 10 μM), and gabazine (10 μM) were added to the ACSF to block ionotropic glutamate and GABA receptors, to minimize network interactions.
Electrophysiology.
For recording, single slices were perfused at 3 ml/min with ACSF warmed to 30°C. Neurons were visualized with an upright microscope (BX50WI; Olympus, Tokyo, Japan) equipped with near-infrared differential interference contrast and fluorescence optics. Cell-attached (Zhou and Roper 2011) and conventional (Zhou et al. 2008) whole cell patch-clamp recordings were performed with a MultiClamp 700B amplifier (Molecular Devices, Sunnyvale, CA). Patch pipettes were pulled from borosilicate glass (OD 1.5 mm, ID 0.86 mm; Sutter Instrument, Novato, CA) in a horizontal pipette puller (model P-97 Flaming/Brown Micropipette puller; Sutter Instrument). Patch pipettes had resistances of ∼5–7 MΩ in the bath. The Cs+-based internal solution for voltage-clamp recording contained (in mM) 130 cesium methanesulfonate (CsMeSO3), 4 NaCl, 0.5 CaCl2, 4 phosphocreatine di(tris) salt, 4 MgATP, 0.3 Na2GTP, 5.5 EGTA, and 10 HEPES (pH 7.3 was adjusted with CsOH, and osmolarity was 291 mosM). The K+-based internal solution for current-clamp recording contained (in mM) 132 potassium gluconate, 4 NaCl, 0.5 CaCl2, 4 phosphocreatine di(tris) salt, 4 MgATP, 0.3 Na2GTP, 5.5 EGTA, and 10 HEPES (pH 7.3 was adjusted with KOH; 289 mosM). Alexa Fluor 594 hydrazide (5 μM; Thermo Fisher Scientific) was added to the internal solution in all experiments for in situ labeling.
Current or voltage records were low-pass filtered at 10 kHz (MultiClamp 700B) and digitized at 20 kHz with a Digidata 1322A interface (Molecular Devices, Union City, CA) and Clampex 9.2 software (Molecular Devices). The liquid junction potential was corrected with the Pipette Offset function of MultiClamp 700B before recordings were performed. Access resistance was typically <20 MΩ, and recordings were discarded if access resistance changed >15% during the experiment. The current-voltage (I-V) relationship of INaP was assessed with a slow voltage ramp protocol (−80 to −40 mV or −110 to −20 mV, 26.7 mV/s) from a holding potential of −60 mV. Ih currents were evoked with hyperpolarizing voltage pulses (5 mV/step, 500-ms duration) from a potential of −40 mV to a final potential of −125 mV. Input membrane resistance was calculated from current elicited by negative voltage pulse (−10 mV) from a holding potential of −60 mV. ET cells were initially identified by morphology under differential interference contrast optics as a pear-shaped soma within the glomerular layer and an apical dendrite with a tuftlike arborization that ramified within a single glomerulus. ET cells were further identified by their characteristic electrophysiological properties distinct from periglomerular and short axon cells: spontaneous rhythmic bursting and a random or nonclustered pattern of spontaneous excitatory postsynaptic potentials or EPSCs (Hayar et al. 2004a, 2004b, 2005; Liu and Shipley 2008). Rhythmic bursting was typically confirmed in extracellular recordings before switching to whole cell mode. Cells without rhythmic bursting were not studied.
Data analysis.
Data were analyzed off-line with Clampfit 9.2 (Molecular Devices) and Origin 8.5 (Origin Lab, Northampton, MA). Conductance for INaP was derived from I-V curves according to the formula G = I/(Vm − Vr), where Vm = membrane test potential and Vr = estimated reversal potential for sodium ions (68.9 mV). To determine the half-maximal activation voltage for INaP, the ratio of conductance (G) to maximal conductance (Gmax), G/Gmax, was plotted to membrane potential. ET cell spike bursts were analyzed as previously described (Dong et al. 2009; Dong and Ennis 2014; Liu and Shipley 2008). Spike detection was performed off-line by using Clampfit 9.2 to calculate burst rate (defined as the average number of bursts/s based on 3-min continuous recording), the number of spikes per burst, the firing frequency (the average number of spikes/s), and burst duration (the average time interval between the first and the last spike in a burst). A spike burst was defined as a series of two or more consecutive spikes occurring at <75-ms intervals (Dong et al. 2009). To quantify the regularity of bursting, we calculated the coefficient of variation (CV) of interburst intervals determined by dividing the standard deviation of the interburst intervals by the mean interburst interval (Hayar et al. 2004b; Zhou and Roper 2011). Spike train autocorrelations were generated by using Clampfit 9.2 to additionally assess bursting regularity and to obtain the autocorrelation index, measured as the amplitude of the first peak in the autocorrelograms. Minimum membrane potential (MMP) was defined as the nadir of the membrane potential after each burst (Liu and Shipley 2008). Envelope amplitude was defined as the average difference in voltage between MMP and mean negative peak of spikes of burst. The slope of linear component of the depolarizing envelope of ET cell spike bursts was obtained with Linear Fit through Origin 8.5 (MicroCal, Northampton, MA). Group data I-V curves were plotted with a sigmoidal function (Origin 8.5). Data are expressed as means ± SE. ANOVA with Tukey post hoc tests was used to compare multiple data points of two I-V curves. Paired t-tests were used to compare data from some experiments.
Drugs.
Drugs were dissolved in ACSF and delivered by bath application. All chemicals including isoproterenol (Isop), metoprolol, denopamine, ICI 118,551, formoterol, TEA, CdCl2, and nickel(II) chloride hexahydrate were obtained from Sigma-Aldrich (St. Louis, MO), except for APV, CNQX, gabazine, TTX, and ZD7288, which were obtained from Tocris Bioscience (Ellisville, MO). Fresh solutions of Isop and denopamine were prepared from stock solution for each recording and protected from exposure to oxygen and light by ascorbic acid (0.4 mM).
RESULTS
Isoproterenol enhances INaP.
We first investigated the effects of the nonselective β-receptor agonist Isop on INaP, a current essential for spontaneous burst initiation in ET cells (Dong and Ennis 2014; Hayar et al. 2004a; Liu and Shipley 2008). As previously reported (Dong and Ennis 2014; Hayar et al. 2004a; Liu and Shipley 2008), slow voltage ramps reliably evoked a TTX-sensitive inward current that increased with membrane depolarization, peaking at −40 mV with an activation threshold of approximately −60 mV (or in the midpoint of the ramp; Fig. 1, A and B). In the presence of Isop, as in control, INaP significantly increased in amplitude from −80 mV to −40 mV (F8,80 = 124.07, 2-way ANOVA, n = 5; Fig. 1C). The TTX-sensitive INaP component was isolated by subtracting membrane current in control and Isop conditions from currents in TTX (Fig. 1, A–C). Analysis of subtraction curves revealed a significant impact of Isop on INaP (F1,80 = 27.62, P < 0.01, 2-way ANOVA, n = 5), with a leftward curve shift compared with control (Fig. 1, B and C). INaP amplitude was significantly increased in the range of −60 to −45 mV compared with control (all P < 0.01, paired t-tests; Fig. 1C). Isop induced a net current with a peak increase of −39.6 ± 4.8 pA at about −50 mV (Fig. 1, B and C, blue line). The maximal magnitudes of INaP at −40 mV in control and Isop conditions (−86.7 ± 5.4 pA vs. −90.1 ± 4.6 pA) were not significantly different (P > 0.05, paired t-test, both n = 5). Thus Isop shifts the overall window of INaP toward hyperpolarizing potentials.
Fig. 1.
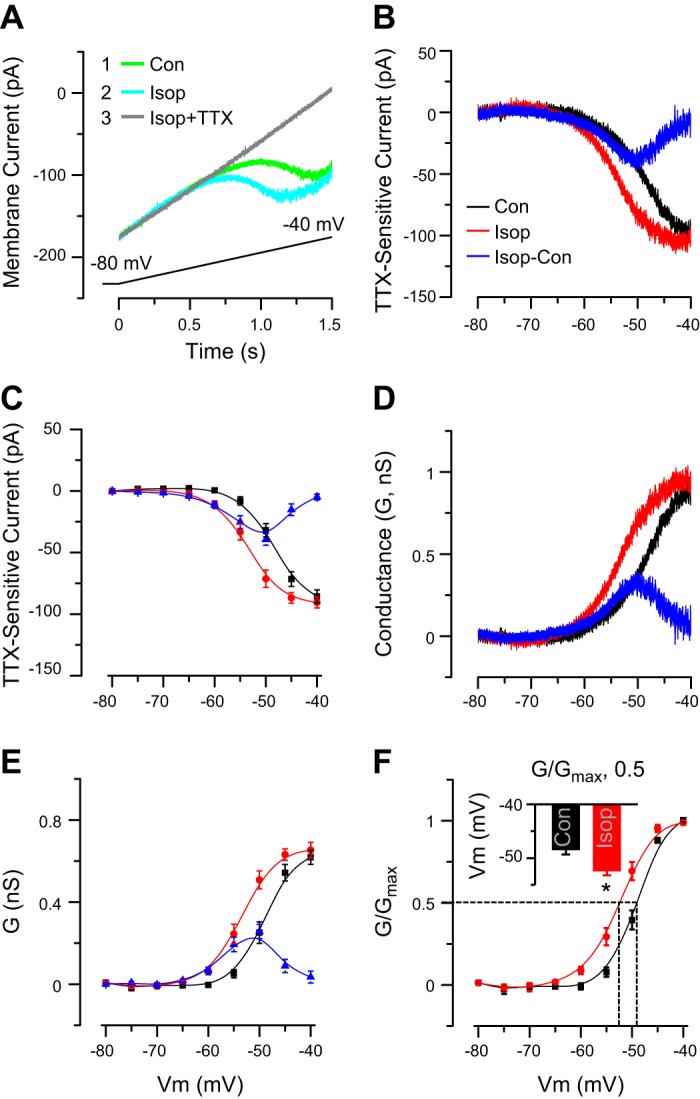
Isop enhances INaP. A: example ET cell voltage-clamp recording shows that a slow depolarizing voltage ramp (from −80 mV to −40 mV, shown at bottom, 26.6 mV/s) elicits an INaP (Isop, 10 μM). Inset indicates order of drug applications. INaP was activated in the middle of the ramp (A) or at approximately −60 mV (as shown in B and C) and was TTX sensitive. Con, control. B: example subtraction I-V curves (from cell in A) show TTX-sensitive INaP in control and Isop. Blue curve shows the net increase in INaP induced by Isop. C: group data from 5 ET cells show TTX-sensitive current INaP in control and Isop and the net change of INaP induced by Isop (Isop-sensitive INaP). Note leftward shift of I-V curve with a decrease in INaP activation threshold and increased INaP amplitude from −60 mV to −45 mV evoked by Isop. D: I-V curves for INaP (in B) were converted to conductance. E: group data from 5 ET cells show INaP conductance in control and Isop treatment and the net change induced by Isop. Isop induced a leftward shift in conductance-voltage curve and increased the INaP conductance. F: group data from 5 ET cells show the G/Gmax-V relationship in control and Isop. Note leftward shift induced by Isop. Dashed lines denote half-maximal activation values in control and Isop. Inset shows that Isop had a more negative membrane potential (Vm) at half-maximal activation. *P < 0.01 vs. control, paired t-test.
I-V curves for INaP (in Fig. 1B) were converted to conductance. Isop significantly altered conductance (F1,80 = 20.83, P < 0.01, 2-way ANOVA, n = 5), with a left-shifted conductance curve compared with control (Fig. 1, D and E), significantly increasing conductance in the range of −60 to −45 mV (P < 0.05 at −60 and −45 mV and P < 0.01 at −55 and −50 mV, paired t-tests; Fig. 1E). The peak net conductance increase evoked by Isop was 0.324 ± 0.045 nS at about −50 mV (Fig. 1, D and E, blue line). The maximal conductance magnitudes at −40 mV were not significantly different (0.775 ± 0.046 nS in control vs. 0.814 ± 0.049 nS in Isop, both n = 5, P > 0.05, paired t-test). Paralleling these results, Isop produced a significant leftward shift in the G/Gmax-V relationship (F1,80 = 20.45, P < 0.01, 2-way ANOVA, n = 5; Fig. 1F). The half-maximal activation value for INaP was significantly hyperpolarized compared with control: control, −48.46 ± 0.88, Isop, −52.40 ± 0.82 mV (n = 5; P < 0.01, paired t-test; Fig. 1F, inset). These results show that Isop shifts the conductance and activation threshold of INaP in ET cells toward more negative membrane potentials.
Selective β2-receptor activation enhances INaP.
We next sought to delineate the β-receptor subtype(s) involved in the enhancement of INaP by Isop. Similar to Isop, the selective β2-receptor agonist formoterol (100 nM) produced a significant leftward shift in the I-V curve (F1,80 = 9.73, P < 0.01, 2-way ANOVA, n = 5; Fig. 2, A and B), with a net peak in inward current amplitude of −37.5 ± 4.4 pA at about −50 mV (Fig. 2B, blue line, and Fig. 2E). The leftward shift of the INaP half-maximal activation value (approximately −4 mV, data not shown) and the peak increase in INaP current induced by formoterol were similar to these for Isop (Fig. 2E). The selective β2-receptor antagonist ICI 118,551 (100 nM, 5 min before Isop application) completely blocked the effects of Isop (10 μM, n = 4; Fig. 2, C and E) and formoterol (100 nM, n = 4; Fig. 2E) on INaP. In contrast, the β1-receptor-selective agonist denopamine at different concentrations (50 μM, n = 5, shown in Fig. 2, D and E; 150 μM, not shown) did not induce significant changes in the I-V relationship or amplitude of INaP. Additionally, the β1-receptor-selective antagonist metoprolol (1 μM, 5 min or 10 min before 10 μM Isop, both n = 3) did not alter the effect of Isop on INaP (Fig. 2E). These results suggest that β2-, but not β1-, receptors mediate the Isop-evoked enhancement of INaP.
Fig. 2.
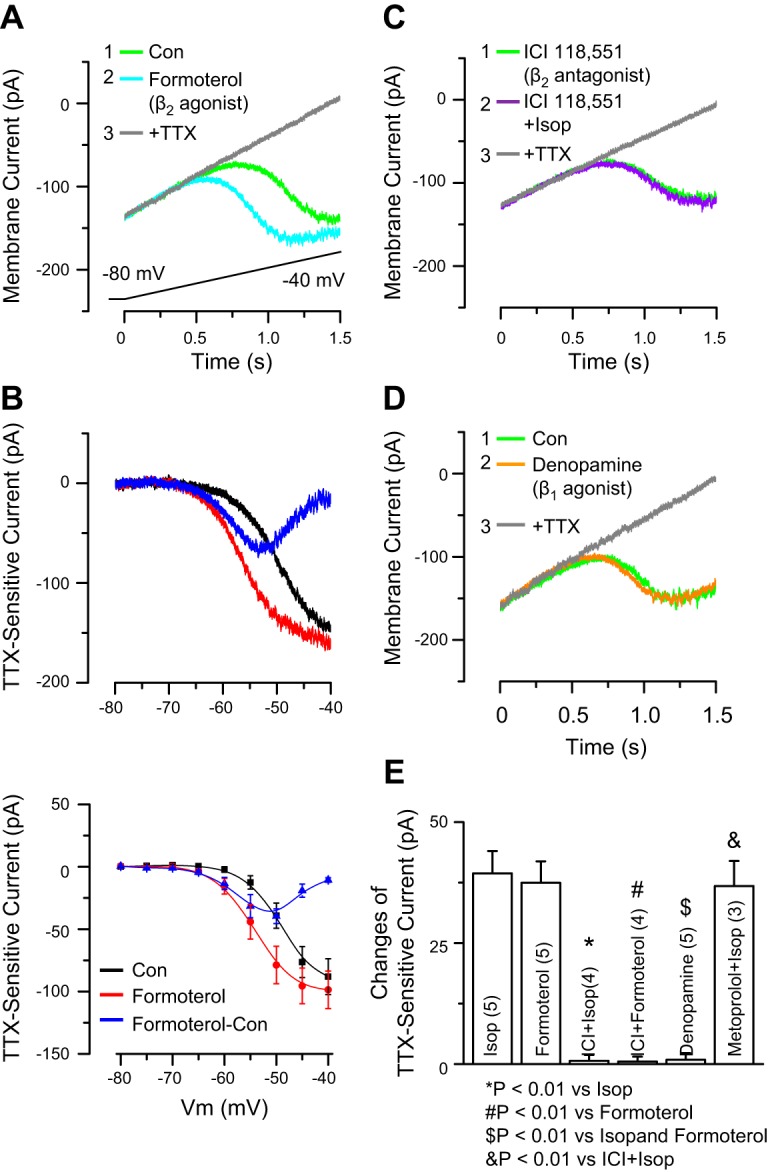
β2-, Not β1-, receptors enhance INaP. A: example ET cell recording shows that formoterol (100 nM) augments INaP elicited by a slow depolarizing voltage ramp. Inset indicates order of drug applications. B: example (top) and group data (n = 5, bottom) of subtraction I-V curves show TTX-sensitive INaP in control and formoterol (100 nM) and the net increase elicited by formoterol. Formoterol caused a leftward shift of the I-V curve with a decrease of INaP activation threshold and augmented INaP amplitude. C: example I-V curves for INaP during Isop application in the presence of the selective β2-receptor antagonist ICI 118,551 (100 nM, bath applied 5 min before Isop application). ICI 118,551 completely blocked the Isop-induced leftward shift. D: example I-V curves for INaP during bath application of the β1-receptor selective agonist denopamine (50 μM). Denopamine did not affect curves. E: group data show the net INaP amplitude change at −50 mV in the different conditions (n shown in parentheses).
Isoproterenol enhances Ih.
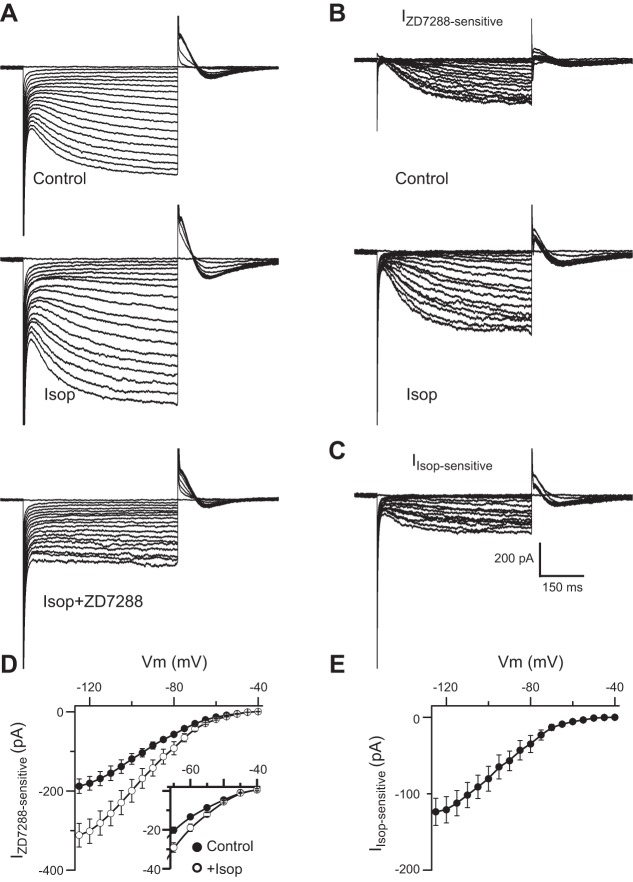
We next investigated potential β-receptor modulation of Ih that is also key to ET cell rhythmic bursting (Liu and Shipley 2008). Hyperpolarizing steps evoked a slowly developing inward current that increased with hyperpolarization from −40 mV to −125 mV and was eliminated by the selective Ih blocker ZD7288 (100 μM; Fig. 3A). The inward current was significantly different between the control and Isop groups at −45 mV and more negative potentials (paired t-test, P < 0.05, n = 5). Substraction analyses (Fig. 3, B and D) showed that the amplitude of the ZD7288-sensitive current was significantly larger in the presence of Isop than in control (F1,161 = 63.34, 2-way ANOVA, n = 5, P < 0.01), with a peak difference at −125 mV (−187.95 ± 18.27 pA in control vs. −311.6 ± 29.94 in Isop, n = 5; Fig. 3D). At a membrane potential of −60 mV, near the ET cell MMP, Ih amplitude increased from −13.31 ± 0.71 pA in control to −18.92 ± 1.89 pA with Isop (P < 0.05, paired t-test, n = 5; Fig. 3D, inset). The I-V relationship of the net current attributable to Isop steadily increased with membrane hyperpolarization, with a peak value of −123.65 ± 17.83 pA at −125 mV (n = 5; Fig. 3, C and E).
Fig. 3.
Isop augments Ih. A: example ET cell voltage-clamp traces show hyperpolarization-activated inward currents evoked by hyperpolarizing voltage steps (5-mV increment) from a holding potential of −40 mV to −125 mV in control, Isop (10 μM), and Isop+ZD7288 (100 μM). B: the ZD7288-sensitive current Ih in control and Isop obtained by subtraction analysis. Additional experiments (not shown) demonstrated that the I-V relationship in ZD7288 alone was identical to Isop+ZD7288 (P > 0.05, ANOVA, n = 4). C: the Isop-sensitive/enhanced Ih component obtained by subtracting current in control from that in the presence of Isop. D and E: group data (n = 5 cells) showing the I-V curves of ZD7288-sensitive Ih in control and Isop (D) and the net Isop-sensitive Ih (E). Inset in D shows enlarged y-axis scale to highlight differences in the ZD7288-sensitive Ih from −40 to −65 mV. Measurements of currents were obtained after steady-state conditions had been reached (480 ms after voltage step induction).
Selective β2-receptor activation enhances Ih.
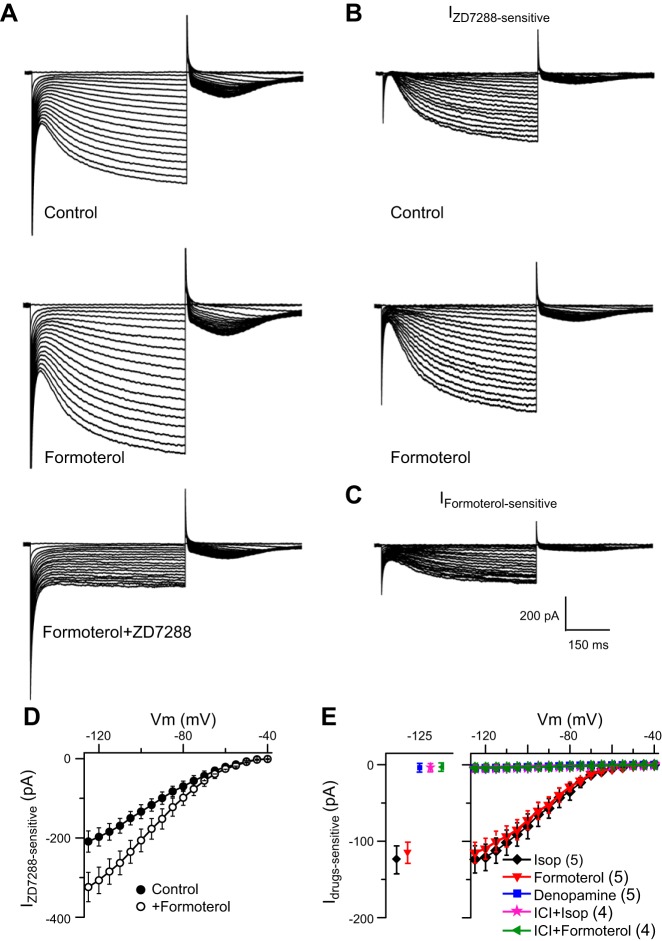
The effects of Isop on Ih were mimicked by the selective β2-receptor agonist formoterol (100 nM; Fig. 4, A–C). The ZD7288-sensitive inward current was significantly enhanced by formoterol compared with control (F1,161= 43.99, 2-way ANOVA, P < 0.01, n = 5; Fig. 4, B and D). The net increase in inward current amplitude attributable to formoterol (Fig. 4E) was similar to Isop (Fig. 3, C and E); for example at −125 mV, the increases in inward current with formoterol and Isop (−114.91 ± 13.68 and −123.65 ± 17.83 pA, respectively) were not significantly different (P > 0.05, both n = 5, 1-way ANOVA). The selective β2-receptor antagonist ICI 118,551 (100 nM, 5 min before Isop or formoterol) completely blocked the enhancement of Ih by Isop (10 μM) and formoterol (100 nM; Fig. 4E). In contrast, the selective β1-receptor agonist denopamine (50 μM) did not significantly alter Ih (Fig. 4E). These results suggest that activation of β2-, but not β1-, receptors mediates the increase in the amplitude of Ih in ET cells.
Fig. 4.
β2-, Not β1-, receptor activation augments Ih. A: example voltage-clamp traces show Ih in control, formoterol (100 nM), and formoterol+ZD7288 (100 μM). B: the ZD7288-sensitive Ih in control and formoterol obtained by subtraction. C: the formoterol-sensitive/enhanced Ih component. D: group data (n = 5 cells) show that formoterol increases the amplitude of the ZD7288-sensitive Ih. E: group data showing the net drug-sensitive Ih in the different conditions (n in parentheses); see text for details.
β-Receptor activation strengthens rhythmic bursting.
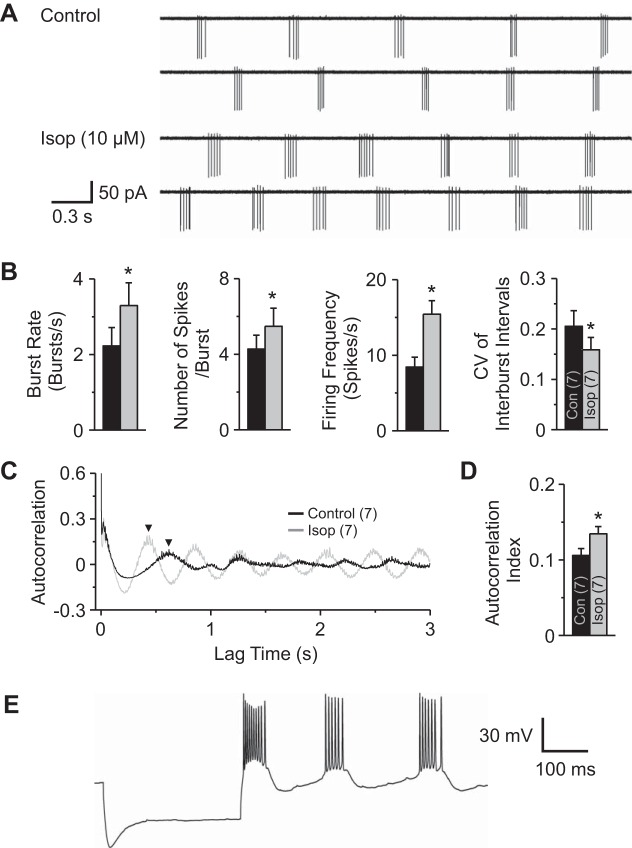
We next investigated the effects of β-receptor activation on ET cell rhythmic bursting using cell-attached voltage-clamp mode (Fig. 5A). Whole cell recordings were established at the end of the experiment to unambiguously identify ET cells electrophysiologically (Fig. 5E). In the presence of APV-CNQX-gabazine, Isop significantly increased the burst rate (from 2.23 ± 0.48 bursts/s to 3.29 ± 0.60 bursts/s, P < 0.01, paired t-test, n = 7) and the number of spikes per burst (4.27 ± 0.74 spikes/burst to 5.48 ± 0.96 spikes/burst, P < 0.01, paired t-test, n = 7), resulting in an increase in the mean firing frequency (8.43 ± 1.31 spikes/s to 15.42 ± 1.78 spikes/s, P < 0.01, paired t-test, n = 7; Fig. 5, A and B). Isop also significantly decreased the CV of interburst intervals from 0.21 ± 0.03 to 0.16 ± 0.02, which indicated that bursts occurred at more regular intervals during application of Isop (P < 0.01, paired t-test, n = 7; Fig. 5B). Consistent with this, Isop produced a more regular burst pattern in spike train autocorrelograms, significantly increasing the autocorrelation index from 0.105 ± 0.009 to 0.135 ± 0.01 (P < 0.01, paired t-test, n = 7; Fig. 5, C and D).
Fig. 5.
Isop increases ET cell bursting and firing frequency. A: example cell-attached voltage-clamp recording traces from an ET cell in control and Isop (10 μM). B: group data from 7 ET cells show that Isop significantly increased the burst rate, number of spikes/burst, and firing frequency and the CV of the interburst intervals was reduced during Isop application. Note that the CV was 0.18 in control and 0.12 in Isop in the cell shown in A. C: spike train autocorrelation (from cell in A) before (Control) and during Isop application. Note that Isop leads to the emergence of multiple peaks at regular intervals in the autocorrelogram sideband. D: group data showing a significant increase in autocorrelation index, the amplitude of the first peak in the autocorrelogram (C, arrowheads). E: example whole cell current-clamp recording trace after cell-attached recording shows Ih and rebound spike bursts characteristic of ET cells. All experiments were performed in the presence of APV-CNQX-gabazine. *P < 0.01 vs. Control (n in parentheses), paired t-tests.
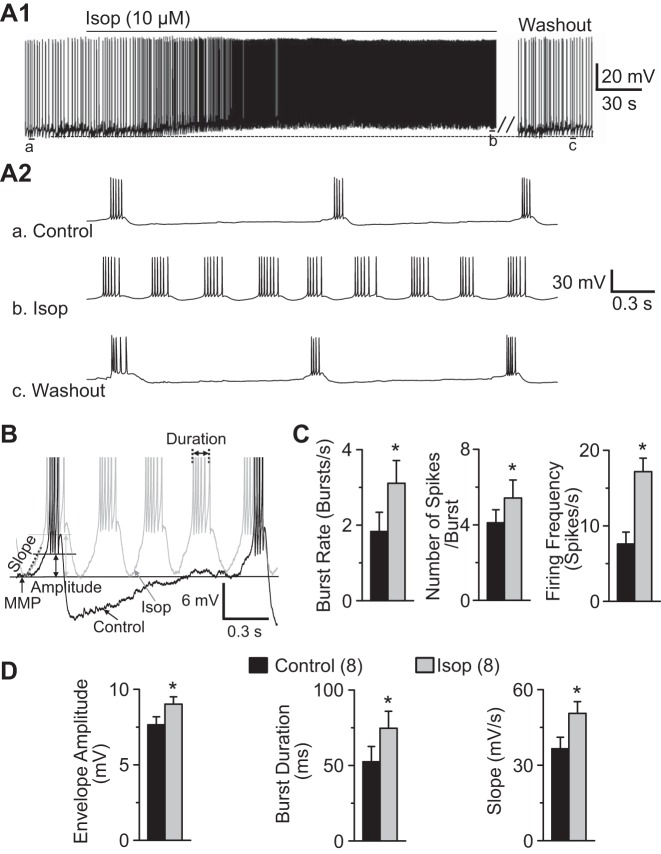
In separate whole cell current-clamp recordings, Isop (10 μM) depolarized ET cells by 6.65 ± 0.37 mV from the baseline MMP of −54.74 ± 1.70 mV (P < 0.01, paired t-test, n = 8; Fig. 6A1). Isop decreased the input resistance from 190.5 ± 16.6 MΩ in control to 161.2 ± 12.5 MΩ (P < 0.01, paired t-test, n = 8). Isop increased the burst rate (1.83 ± 0.51 to 3.11 ± 0.65 bursts/s), the number of spikes per burst (4.11 ± 0.69 to 5.42 ± 0.83 spikes/burst), and the mean firing frequency (7.59 ± 1.58 to 17.18 ± 2.06 spikes/s) (P < 0.01, paired t-tests, n = 8; Fig. 6C). Isop significantly increased the amplitude (7.65 ± 0.53 mV to 9.01 ± 0.48 mV) and duration (52.5 ± 10.1 ms to 74.6 ± 11.2 ms) of the slow depolarizing envelope underlying ET cell spike bursts (n = 8, P < 0.01, paired t-tests; Fig. 6, B and D). Isop also increased the slope of the rising phase of the depolarizing envelope from 36.53 ± 4.56 mV/s to 50.59 ± 4.67 mV/s (P < 0.01, paired t-test, n = 8; Fig. 6, B and D). These findings suggest that Isop enhances ET cell excitability and rhythmic bursting.
Fig. 6.
β-Receptor activation depolarizes ET cells and increases rhythmic bursting. A1: example ET cell current-clamp recording shows that Isop (10 μM) reversibly depolarizes and increases its burst frequency in the presence of APV-CNQX-gabazine and the ET cell is fully recovered upon 14-min washout (∼10–17 min, 7 ET cells). A2: faster timescale traces taken from points a–c in A1. B: diagram shows burst parameters. Note that trace was from cell in A1 in control and with application of Isop and the spikes were truncated. C: group data from 8 ET cells show that Isop significantly increased the burst rate, number of spikes/burst, and firing frequency. D: group data from 8 ET cells show that Isop increased the amplitude and rising phase slope of the slow depolarizing envelope, as well as the burst duration. *P < 0.01 vs. Control (n in parentheses), paired t-tests. MMP, minimal membrane potential.
Activation of INaP depolarizes the ET cell membrane potential toward the threshold of spike bursts (Liu and Shipley 2008). The observed Isop-induced facilitations of INaP and Ih are consistent with the increased burst rate. However, the Isop-induced depolarization could also underlie the increased burst rate because injected current-induced depolarization has been shown to increase the ET cell burst rate (Hayar et al. 2004a). To address this, we prevented spontaneous bursting with negative current injection and then applied a slow current ramp (10 pA/s) to evoke bursts. As shown in Fig. 7, Isop decreased the burst latency (3.63 ± 0.36 s to 2.44 ± 0.27 s) and increased the slope between the ramp onset and first burst (2.56 ± 0.30 mV/s to 3.84 ± 0.35 mV/s) (P < 0.01, paired t-tests, n = 7; Fig. 7). These results indicate that Isop hastens evoked ET cell bursting.
Fig. 7.
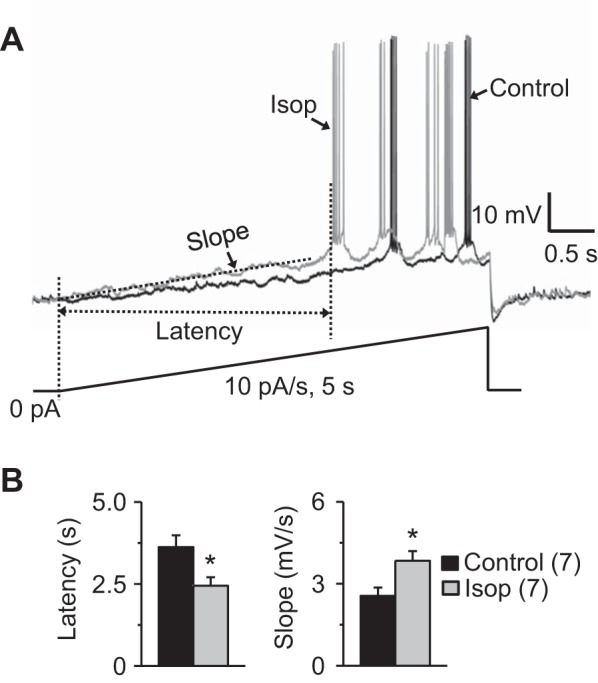
β-Receptor activation hastens evoked ET cell bursting. A: a slow current ramp (10 pA/s, shown at bottom from a holding potential of approximately −65 mV) was applied to evoke burst in ET cells before and during Isop (10 μM) application in the presence of APV-CNQX-gabazine. Isop shortens the delay to the 1st burst and increases the slope from ramp onset. Note that cell was hyperpolarized to −65 mV using injected current to stop spontaneous firing burst, and the membrane was depolarized and no additionally injected current was used during application of Isop. To better show the change of slope, the traces for Isop and control are superimposed. B: group data (n = 7 ET cells) show that Isop significantly shortens the delay to the 1st burst and increases the slope from ramp onset to the burst depolarizing envelope onset. *P < 0.01 vs. Control, paired t-tests.
INaP and Ih mediate isoproterenol-induced enhancement of burst firing.
The results to this point demonstrate that β-receptor activation augments INaP and Ih to increase the rate and strength of ET cell rhythmic bursting. The use of selective INaP and Ih channel blockers to confirm that β-receptor modulation of these two currents is solely responsible for increased bursting is problematic. For example, low concentrations of TTX or riluzole to block INaP irreversible terminate bursting, while ZD7288 halts bursting in a manner that can be partially restored by depolarizing current injection (Dong and Ennis 2014; Liu and Shipley 2008). As an alternative approach to determine whether β-receptor activation engages other channels, we examined whether Isop alters the I-V relationship in the presence of ZD7288 (100 μM) and TTX (1 μM) to block Ih and INaP, respectively. With a K+-based internal solution and ACSF without Ca2+ and K+ channel blockers, Isop did not influence the I-V curve in the presence of ZD7288 and TTX (n = 5; Fig. 8A). We next tested whether Isop alters the ET cell membrane potential in the presence of ZD7288 (100 μM) and TTX (1 μM). The two blockers alone hyperpolarized ET cells to −64.33 ± 2.06 mV from the baseline MMP of −55.51 ± 1.81 mV (P < 0.01, paired t-test), consistent with previous findings (Liu and Shipley 2008), and subsequent Isop did not induce a significant change (0.24 ± 0.31 mV, n = 5; Fig. 8B). Together these observations suggest that the enhancement of ET cell bursting by Isop is primarily due to positive modulation of INaP and Ih.
Fig. 8.
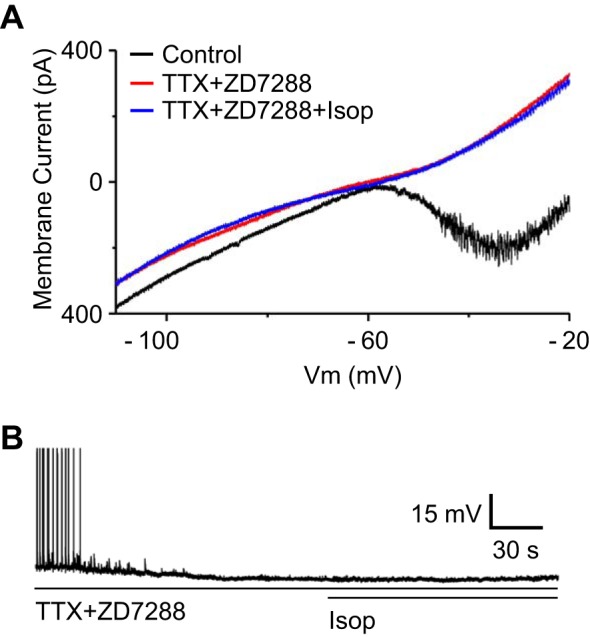
β-Receptor effects are nil when INaP and Ih are blocked. A: example ramp protocol I-V curves show that Isop was without effect when applied in the presence of TTX (1 μM) and ZD7288 (100 μM) to block Na+ and Ih currents, respectively. B: example current-clamp trace (spikes truncated) shows that ET cell is hyperpolarized and spontaneous burst is terminated in the presence of TTX and ZD7288 and Isop does not alter membrane potential in the presence of these blockers.
DISCUSSION
The present results demonstrate that activation of β-noradrenergic receptors directly increases the excitability of ET cells by augmenting two key currents involved in burst initiation and frequency in these cells. The enhancements of Ih and INaP were specifically mediated by the β2-receptor subtype. These findings are consistent with the high density of β2-receptor binding sites and cellular mRNA expression in the glomerular layer and with findings in other brain areas that β-receptor activation increases Ih and INaP (Bergles et al. 1996; Nicholas et al. 1993; Pape and McCormick 1989; Saitow and Konishi 2000; Viemari et al. 2013; Woo and Leon 1995a, 1995b). Our results complement other recent studies showing that ET cell bursting is influenced by neuromodulatory transmitters such as serotonin, acetylcholine, and dopamine (D'Souza et al. 2013; Liu et al. 2012, 2013, 2015).
ET cell burst initiation and frequency are largely determined by Ih, INaP, and low-voltage-activated calcium currents (Hayar et al. 2004a; Liu and Shipley 2008). In each burst cycle, postburst hyperpolarizations engage Ih, which drives the membrane potential to activate INaP and subsequently low-voltage-activated currents. As both Ih and INaP are active at resting membrane potentials (i.e., MMPs), positive or negative modulation of these currents significantly impacts the spontaneous burst cycle of ET cells (Hayar et al. 2004a; Liu and Shipley 2008). The present results demonstrate that β-receptor activation increases Ih amplitude and augments INaP by shifting the activation threshold to more hyperpolarized membrane potential together with an increased current magnitude from −60 to −45 mV. The increase in Ih would be predicted to reduce postburst hyperpolarizations and also allow Ih to engage a more vigorous INaP at more hyperpolarized voltages. As observed in the present studies, burst frequency would therefore increase by facilitating INaP activation at an earlier stage in the interburst cycle. Depolarization of ET cells by current injection increases ET cell burst rate (Hayar et al. 2004a). Therefore, the depolarization elicited by β-receptor activation alone would also be expected to increase burst rate. However, when negative current injection was used to compensate for this depolarization, the latency of evoked bursts decreased. This suggests that the increased burst rate was not a simple consequence of membrane depolarization. Additionally, the rate of rise for evoked bursts increased, consistent with the facilitation of Ih and INaP.
Activation of β-receptors also evoked a modest increase in the number of spikes per burst. This effect cannot be attributed to depolarization alone, as depolarizing current injection reduces the number of spikes per burst in ET cells (Hayar et al. 2004a). The increase in burst strength may be due to the increase in the amplitude or duration of the depolarizing envelope that generates the spike burst. The depolarizing envelope is terminated by hyperpolarizing Ca2+-dependent K+ currents (Liu and Shipley 2008). The increased depolarizing envelope duration may be a consequence of the increase in Ih, which operates to counteract hyperpolarizations. Alternatively, it is possible that β-receptor activation directly modifies Ca2+-dependent K+ or other currents that contribute to the ET cell burst cycle (Liu and Shipley 2008). However, the lack of effect of Isop on the I-V relationship and membrane potential (with standard internal solution and ACSF) when Ih and INaP were blocked indicates that there was no evidence for these potential effects.
The underlying mechanism of the modulatory effects of β2-receptor activation on Ih and INaP in ET cells is not clear. In other cell types, β-receptors couple to the G protein complex to stimulate adenylyl cyclase and increase adenosine 3′,5′-cyclic monophosphate (cAMP) and downstream effectors such as cAMP-dependent protein kinase A (PKA; Gelinas et al. 2008). cAMP and specific β-receptor-evoked stimulation of cAMP are known to positively modulate Ih and INaP by phosphorylation caused by cAMP-dependent PKA (Liao et al. 2010; Nikitin et al. 2006; Saitow and Konishi 2000). cAMP can also bind directly to the Ih channel to increase open time, leading to larger Ih current amplitude (Lüthi and McCormick 1999; Pape and McCormick 1989). We did not determine whether β-receptor agonists simultaneously increase Ih and INaP in individual ET cells, but this seems likely given that these currents were increased in all neurons tested.
Our findings disclose a potential mechanism for the previously reported Isop-evoked increase in the frequency of long-lasting depolarizations (LLDs) in mitral cells (Hayar et al. 2001). The increase in LLDs persisted when GABAA receptors were blocked, excluding a disinhibitory mechanism, but was prevented by TTX, indicating a necessity for spike-driven glutamate release. A number of studies have pinpointed the critical role of ET cell glutamate release in the generation of LLDs (De Saint Jan et al. 2009; Gire and Schoppa 2009; Najac et al. 2011). The increase in the ET cell burst rate and number of spikes/burst elicited by Isop may therefore be responsible for the corresponding increase in mitral cell LLDs.
ET cells play a prominent role in coordinating intraglomerular network activity and amplifying output from mitral/tufted cells (De Saint Jan et al. 2009; Gire et al. 2012; Gire and Schoppa 2009; Hayar et al. 2004b, 2005; Najac et al. 2011; Shao et al. 2012). The intrinsic bursting properties of these cells are thought to reinforce the rhythmic, sniff-driven temporal pattern of sensory input onto the glomerular network. It is noteworthy that sniff frequency and locus coeruleus neuronal activity exhibit similar activity profiles in waking animals. Sniff frequency and locus coeruleus neuronal firing rates increase in parallel in response to novel stimuli or environments (Berridge and Waterhouse 2003; Kay and Laurent 1999; Wachowiak 2011; Welker 1964). ET cell bursts faithfully entrain to repetitive olfactory nerve input from 1 to 5 Hz, but entrainment begins to progressively fail at faster frequencies (i.e., >5 Hz) characteristic of active or investigational sniffing (Hayar et al. 2004a). The increase in ET excitability by β-receptor activation may better enable the ET cell bursts, and hence the glomerular network, to pace faster sniff rates during arousal.
GRANTS
This work was supported by National Institute on Deafness and Other Communication Disorders Grant DC-008702. The contents are solely the responsibility of the authors and do not necessarily represent the official views of the National Institutes of Health.
DISCLOSURES
No conflicts of interest, financial or otherwise, are declared by the author(s).
AUTHOR CONTRIBUTIONS
F.-W.Z., H.-W.D., and M.E. conception and design of research; F.-W.Z. and H.-W.D. performed experiments; F.-W.Z., H.-W.D., and M.E. analyzed data; F.-W.Z., H.-W.D., and M.E. interpreted results of experiments; F.-W.Z. prepared figures; F.-W.Z. and M.E. drafted manuscript; F.-W.Z. and M.E. edited and revised manuscript; F.-W.Z., H.-W.D., and M.E. approved final version of manuscript.
REFERENCES
- Bergles DW, Doze VA, Madison DV, Smith SJ. Excitatory actions of norepinephrine on multiple classes of hippocampal CA1 interneurons. J Neurosci 16: 572–585, 1996. [DOI] [PMC free article] [PubMed] [Google Scholar]
- Berridge C, Waterhouse B. The locus coeruleus-noradrenergic system: modulation of behavioral state and state-dependent cognitive processes. Brain Res Rev 42: 33–84, 2003. [DOI] [PubMed] [Google Scholar]
- Carlson GC, Shipley MT, Keller A. Long-lasting depolarizations in mitral cells of the rat olfactory bulb. J Neurosci 20: 2011–2021, 2000. [DOI] [PMC free article] [PubMed] [Google Scholar]
- Ciombor KJ, Ennis M, Shipley MT. Norepinephrine increases rat mitral cell excitatory responses to weak olfactory nerve input via alpha-1 receptors in vitro. Neuroscience 90: 595–606, 1999. [DOI] [PubMed] [Google Scholar]
- De Saint Jan D, Hirnet D, Westbrook GL, Charpak S. External tufted cells drive the output of olfactory bulb glomeruli. J Neurosci 29: 2043–2052, 2009. [DOI] [PMC free article] [PubMed] [Google Scholar]
- Dong HW, Ennis M. Activation of group I metabotropic glutamate receptors enhances persistent sodium current and rhythmic bursting in main olfactory bulb external tufted cells. J Neurophysiol 111: 641–647, 2014. [DOI] [PMC free article] [PubMed] [Google Scholar]
- Dong HW, Hayar A, Callaway J, Yang XH, Nai Q, Ennis M. Group I mGluR activation enhances Ca2+-dependent nonselective cation currents and rhythmic bursting in main olfactory bulb external tufted cells. J Neurosci 29: 11943–11953, 2009. [DOI] [PMC free article] [PubMed] [Google Scholar]
- Doucette W, Milder J, Restrepo D. Adrenergic modulation of olfactory bulb circuitry affects odor discrimination. Learn Mem 14: 539–547, 2007. [DOI] [PMC free article] [PubMed] [Google Scholar]
- D'Souza RD, Parsa PV, Vijayaraghavan S. Nicotinic receptors modulate olfactory bulb external tufted cells via an excitation-dependent inhibitory mechanism. J Neurophysiol 110: 1544–1553, 2013. [DOI] [PMC free article] [PubMed] [Google Scholar]
- Escanilla O, Alperin S, Youssef M, Ennis M, Linster C. Noradrenergic but not cholinergic modulation of olfactory bulb during processing of near threshold concentration stimuli. Behav Neurosci 126: 720–728, 2012. [DOI] [PMC free article] [PubMed] [Google Scholar]
- Gelinas JN, Tenorio G, Lemon N, Abel T, Nguyen PV. Beta-adrenergic receptor activation during distinct patterns of stimulation critically modulates the PKA-dependence of LTP in the mouse hippocampus. Learn Mem 15: 281–289, 2008. [DOI] [PMC free article] [PubMed] [Google Scholar]
- Gire DH, Franks KM, Zak JD, Tanaka KF, Whitesell JD, Mulligan AA, Hen R, Schoppa NE. Mitral cells in the olfactory bulb are mainly excited through a multistep signaling path. J Neurosci 32: 2964–2975, 2012. [DOI] [PMC free article] [PubMed] [Google Scholar]
- Gire DH, Schoppa NE. Control of on/off glomerular signaling by a local GABAergic microcircuit in the olfactory bulb. J Neurosci 29: 13454–13464, 2009. [DOI] [PMC free article] [PubMed] [Google Scholar]
- Hayar A, Heyward PM, Heinbockel T, Shipley MT, Ennis M. Direct excitation of mitral cells via activation of alpha1-noradrenergic receptors in rat olfactory bulb slices. J Neurophysiol 86: 2173–2182, 2001. [DOI] [PubMed] [Google Scholar]
- Hayar A, Karnup S, Ennis M, Shipley MT. External tufted cells: a major excitatory element that coordinates glomerular activity. J Neurosci 24: 6676–6685, 2004a. [DOI] [PMC free article] [PubMed] [Google Scholar]
- Hayar A, Karnup S, Shipley MT, Ennis M. Olfactory bulb glomeruli: external tufted cells intrinsically burst at theta frequency and are entrained by patterned olfactory input. J Neurosci 24: 1190–1199, 2004b. [DOI] [PMC free article] [PubMed] [Google Scholar]
- Hayar A, Shipley MT, Ennis M. Olfactory bulb external tufted cells are synchronized by multiple intraglomerular mechanisms. J Neurosci 25: 8197–8208, 2005. [DOI] [PMC free article] [PubMed] [Google Scholar]
- Jiang M, Griff ER, Ennis M, Zimmer LA, Shipley MT. Activation of locus coeruleus enhances the responses of olfactory bulb mitral cells to weak olfactory nerve input. J Neurosci 16: 6319–6329, 1996. [DOI] [PMC free article] [PubMed] [Google Scholar]
- Kay LM, Laurent G. Odor- and context-dependent modulation of mitral cell activity in behaving rats. Nat Neurosci 2: 1003–1009, 1999. [DOI] [PubMed] [Google Scholar]
- Liao Z, Lockhead D, Larson ED, Proenza C. Phosphorylation and modulation of hyperpolarization-activated HCN4 channels by protein kinase A in the mouse sinoatrial node. J Gen Physiol 136: 247–258, 2010. [DOI] [PMC free article] [PubMed] [Google Scholar]
- Linster C, Nai Q, Ennis M. Nonlinear effects of noradrenergic modulation of olfactory bulb function in adult rodents. J Neurophysiol 105: 1432–1443, 2011. [DOI] [PMC free article] [PubMed] [Google Scholar]
- Liu S, Aungst JL, Puche AC, Shipley MT. Serotonin modulates the population activity profile of olfactory bulb external tufted cells. J Neurophysiol 107: 473–483, 2012. [DOI] [PMC free article] [PubMed] [Google Scholar]
- Liu S, Plachez C, Shao Z, Puche A, Shipley MT. Olfactory bulb short axon cell release of GABA and dopamine produces a temporally biphasic inhibition-excitation response in external tufted cells. J Neurosci 33: 2916–2926, 2013. [DOI] [PMC free article] [PubMed] [Google Scholar]
- Liu S, Shao Z, Puche A, Wachowiak M, Rothermel M, Shipley MT. Muscarinic receptors modulate dendrodendritic inhibitory synapses to sculpt glomerular output. J Neurosci 35: 5680–5692, 2015. [DOI] [PMC free article] [PubMed] [Google Scholar]
- Liu S, Shipley MT. Multiple conductances cooperatively regulate spontaneous bursting in mouse olfactory bulb external tufted cells. J Neurosci 28: 1625–1639, 2008. [DOI] [PMC free article] [PubMed] [Google Scholar]
- Lüthi A, McCormick DA. Modulation of a pacemaker current through Ca2+-induced stimulation of cAMP production. Nat Neurosci 2: 634–641, 1999. [DOI] [PubMed] [Google Scholar]
- Mandairon N, Peace S, Karnow A, Kim J, Ennis M, Linster C. Noradrenergic modulation in the olfactory bulb influences spontaneous and reward-motivated discrimination, but not the formation of habituation memory. Eur J Neurosci 27: 1210–1219, 2008. [DOI] [PubMed] [Google Scholar]
- McLean JH, Shipley MT, Nickell WT, Aston-Jones G, Reyher CK. Chemoanatomical organization of the noradrenergic input from locus coeruleus to the olfactory bulb of the adult rat. J Comp Neurol 285: 339–349, 1989. [DOI] [PubMed] [Google Scholar]
- Mesfioui A, Math F, Jmari K, El Hessni A, Choulli MK, Davrainville JL. Effects of amphetamine and phenylethylamine on catecholamine release in the glomerular layer of the rat olfactory bulb. Biol Signals Recept 7: 235–243, 1998. [DOI] [PubMed] [Google Scholar]
- Nadi NS, Head R, Grillo M, Hempstead J, Grannot-Reisfeld N, Margolis FL. Chemical deafferentation of the olfactory bulb: plasticity of the levels of tyrosine hydroxylase, dopamine and norepinephrine. Brain Res 213: 365–377, 1981. [DOI] [PubMed] [Google Scholar]
- Nai Q, Dong HW, Hayar A, Linster C, Ennis M. Noradrenergic regulation of GABAergic inhibition of main olfactory bulb mitral cells varies as a function of concentration and receptor subtype. J Neurophysiol 101: 2472–2484, 2009. [DOI] [PMC free article] [PubMed] [Google Scholar]
- Nai Q, Dong HW, Linster C, Ennis M. Activation of alpha1 and alpha2 noradrenergic receptors exert opposing effects on excitability of main olfactory bulb granule cells. Neuroscience 169: 882–892, 2010. [DOI] [PMC free article] [PubMed] [Google Scholar]
- Najac M, De Saint Jan D, Reguero L, Grandes P, Charpak S. Monosynaptic and polysynaptic feed-forward inputs to mitral cells from olfactory sensory neurons. J Neurosci 31: 8722–8729, 2011. [DOI] [PMC free article] [PubMed] [Google Scholar]
- Nicholas AP, Pieribone VA, Hökfelt T. Cellular localization of messenger RNA for beta-1 and beta-2 adrenergic receptors in rat brain: an in situ hybridization study. Neuroscience 56: 1023–1039, 1993. [DOI] [PubMed] [Google Scholar]
- Nikitin ES, Kiss T, Staras K, O'Shea M, Benjamin PR, Kemenes G. Persistent sodium current is a target for cAMP-induced neuronal plasticity in a state-setting modulatory interneuron. J Neurophysiol 95: 453–463, 2006. [DOI] [PubMed] [Google Scholar]
- Okutani F, Kaba H, Takahashi S, Seto K. The biphasic effect of locus coeruleus noradrenergic activation on dendrodendritic inhibition in the rat olfactory bulb. Brain Res 783: 272–279, 1998. [DOI] [PubMed] [Google Scholar]
- Pandipati S, Schoppa NE. Age-dependent adrenergic actions in the main olfactory bulb that could underlie an olfactory-sensitive period. J Neurophysiol 108: 1999–2007, 2012. [DOI] [PMC free article] [PubMed] [Google Scholar]
- Pape HC, McCormick DA. Noradrenaline and serotonin selectively modulate thalamic burst firing by enhancing a hyperpolarization-activated cation current. Nature 340: 715–718, 1989. [DOI] [PubMed] [Google Scholar]
- Saitow F, Konishi S. Excitability increase induced by beta-adrenergic receptor-mediated activation of hyperpolarization-activated cation channels in rat cerebellar basket cells. J Neurophysiol 84: 2026–2034, 2000. [DOI] [PubMed] [Google Scholar]
- Shao Z, Puche AC, Liu S, Shipley MT. Intraglomerular inhibition shapes the strength and temporal structure of glomerular output. J Neurophysiol 108: 782–793, 2012. [DOI] [PMC free article] [PubMed] [Google Scholar]
- Smith RS, Weitz CJ, Araneda RC. Excitatory actions of noradrenaline and metabotropic glutamate receptor activation in granule cells of the accessory olfactory bulb. J Neurophysiol 102: 1103–1114, 2009. [DOI] [PMC free article] [PubMed] [Google Scholar]
- Sullivan R, Stackenwalt G, Nasr F, Lemon C, Wilson D. Association of an odor with activation of olfactory bulb noradrenergic beta-receptors or locus coeruleus stimulation is sufficient to produce learned approach responses to that odor in neonatal rats. Behav Neurosci 114: 957–962, 2000. [DOI] [PMC free article] [PubMed] [Google Scholar]
- Sullivan RM, Wilson DA. Molecular biology of early olfactory memory. Learn Mem 10: 1–4, 2003. [DOI] [PMC free article] [PubMed] [Google Scholar]
- Viemari JC, Garcia AJ 3rd, Doi A, Elsen G, Ramirez JM. β-Noradrenergic receptor activation specifically modulates the generation of sighs in vivo and in vitro. Front Neural Circuits 7: 179, 2013. [DOI] [PMC free article] [PubMed] [Google Scholar]
- Wachowiak M. All in a sniff: olfaction as a model for active sensing. Neuron 71: 962–973, 2011. [DOI] [PMC free article] [PubMed] [Google Scholar]
- Welker WI. Analysis of sniffing of the albino rat. Behaviour 22: 233–244, 1964. [Google Scholar]
- Woo CC, Leon M. Distribution and development of beta-adrenergic receptors in the rat olfactory bulb. J Comp Neurol 352: 1–10, 1995a. [DOI] [PubMed] [Google Scholar]
- Woo CC, Leon M. Early olfactory enrichment and deprivation both decrease beta-adrenergic receptor density in the main olfactory bulb of the rat. J Comp Neurol 360: 634–642, 1995b. [DOI] [PubMed] [Google Scholar]
- Yuan Q. Theta bursts in the olfactory nerve paired with beta-adrenoceptor activation induce calcium elevation in mitral cells: a mechanism for odor preference learning in the neonate rat. Learn Mem 16: 676–681, 2009. [DOI] [PMC free article] [PubMed] [Google Scholar]
- Zhang JJ, Okutani F, Huang GZ, Taniguchi M, Murata Y, Kaba H. Common properties between synaptic plasticity in the main olfactory bulb and olfactory learning in young rats. Neuroscience 170: 259–267, 2010. [DOI] [PubMed] [Google Scholar]
- Zhou FW, Matta SG, Zhou FM. Constitutively active TRPC3 channels regulate basal ganglia output neurons. J Neurosci 28: 473–482, 2008. [DOI] [PMC free article] [PubMed] [Google Scholar]
- Zhou FW, Roper SN. Altered firing rates and patterns in interneurons in experimental cortical dysplasia. Cereb Cortex 21: 1645–1658, 2011. [DOI] [PubMed] [Google Scholar]
- Zimnik NC, Treadway T, Smith RS, Araneda RC. α1A-Adrenergic regulation of inhibition in the olfactory bulb. J Physiol 591: 1631–1643, 2013. [DOI] [PMC free article] [PubMed] [Google Scholar]


